Member Services Desk
Weekly Market Update
This MSD Weekly Market Update reflects information for the week ending July 11, 2025.
Economist Views
Click to expand the below image.
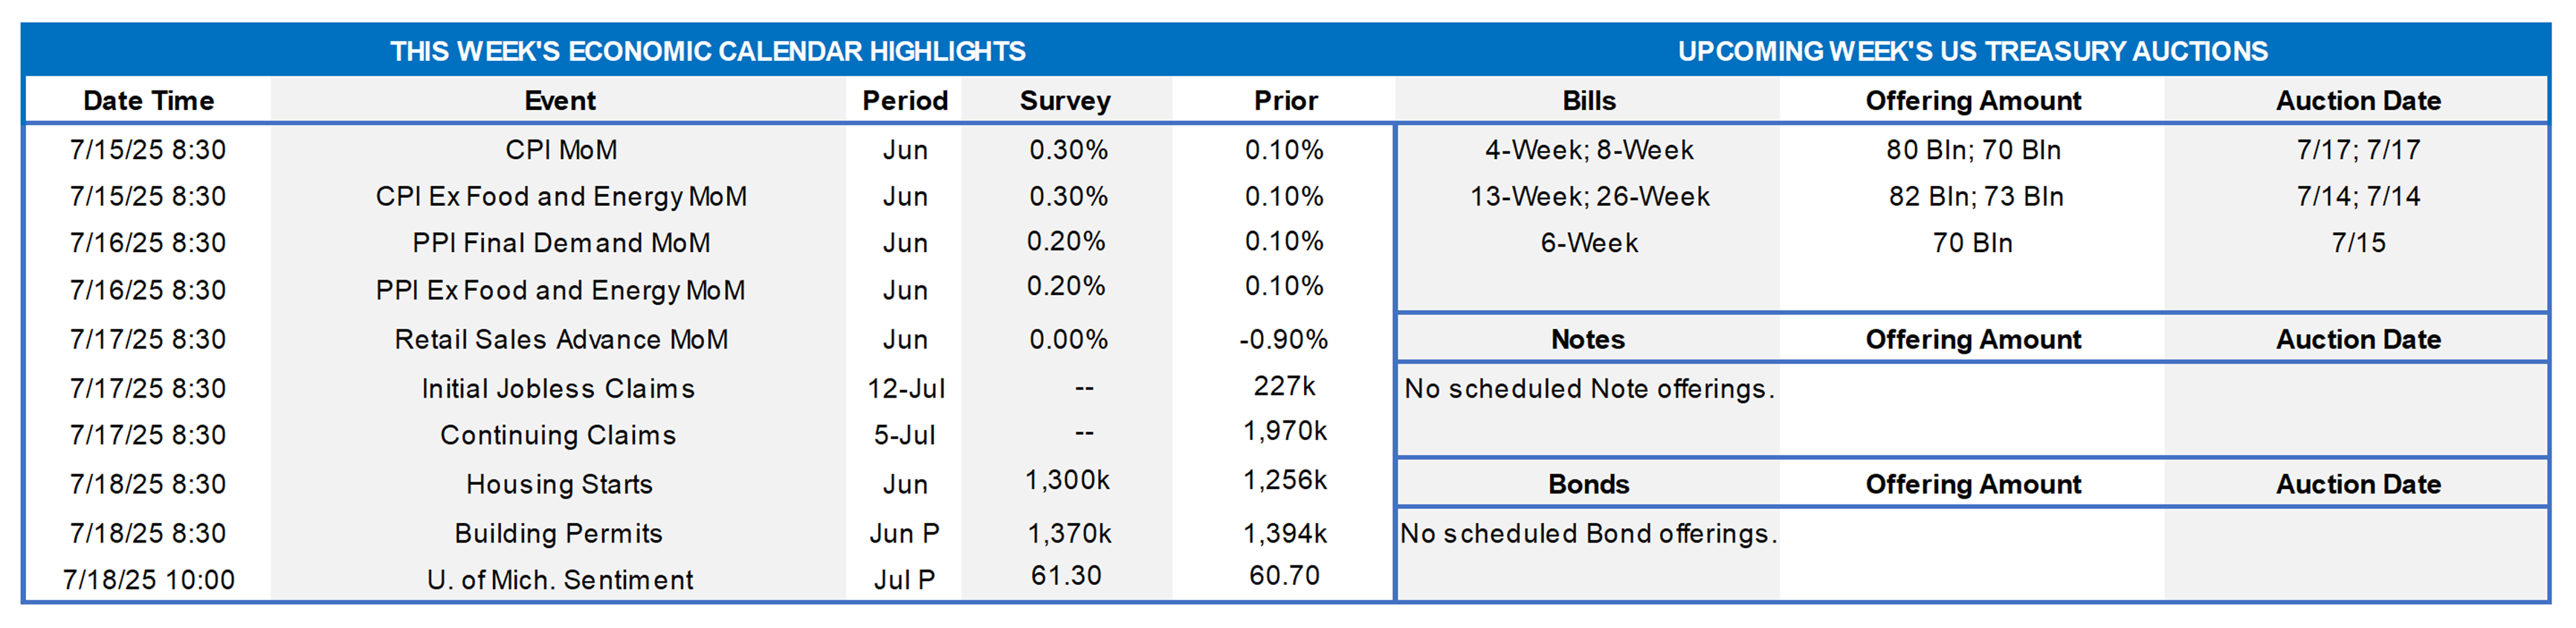
After a light post-holiday week, the economic data calendar will be notably busier in the week ahead. The inflation-related reports are likely to be the most monitored and potentially influential releases, as they should provide further clarity on the timing of tariff impacts. The Fed has essentially said it is in “wait-and-see” mode on rate policy, partially owing to tariff policy. The pre-holiday jobs report, while not all-around robust, was stable enough to squash market pricing of a chance of a Fed cut at the July 30th FOMC meeting. The Fed and markets will, via the upcoming week’s inflation reports, thereby obtain a fresh look at the other side of the Fed’s dual mandate. The release this past week of the June 18th FOMC meeting minutes revealed somewhat of a split in the committee between concerns over tariff-fueled inflation and signs of weaker labor markets.
Consumer Price Index (CPI) report: The June reading for CPI is expected to reveal an uptick to .3% month-on-month vs. last month’s relatively benign .1% reading. Excluding the more volatile food and energy components, the core reading is also expected to be .30% rise vs. last month’s .1%. Chances are that the price pressures from tariff policy will be unclear, as the inventory buildup from Q1 is still to be depleted, and importers/sellers refrain from passing along costs yet.
Producer Price Index Final Demand MoM: Producer Prices for June are expected to show an uptick to .2% month-on-month vs. the last month’s reading of .1%. Market strategists forecast the same .2% rise for the core-PPI excluding food and energy vs. last month’s .1%. Higher prices borne by producers are likely to emerge in the PPI data before those are passed on to consumers and surface in CPI. Nondurable goods bear close monitoring, as they tend to have a shorter shelf-life for inventories, and so price pressures should materialize first in nondurable vs. durable goods.
Retail Sales: Forecasts call for a flat month-on–month reading for June. This result would mark a rebound from May’s .9% decline.
Initial and Continuing Claims: Initial Claims have trended in a relatively steady zone in recent weeks, but economists are closely monitoring Continuing Claims, which are on an upward trend, potentially sending an early-warning signal of weakening job markets.
Housing Starts: Expectations are for a small increase of ~45K new starts in June vs. May.
Building Permits: Forecasts call for a June reading of 1,370K, which would be a slight decrease from the May figure of 1,394K.
University of Michigan Sentiment: Expectations are for an uptick from 60.7 to 61.3. Given the survey’s recent lofty results on the inflation outlook, this portion of the report will garner scrutiny.
Federal Reserve:
- July 15 Fed’s Collins will deliver closing keynote at NABE event
- July 15 Fed’s Logan Speaks on the Economy
- July 15 Fed’s Barkin Gives Speech in Baltimore
- July 16 Fed Releases Beige Book at 2pm
- July 16 Fed’s Williams Speaks on Economic Outlook and Policy
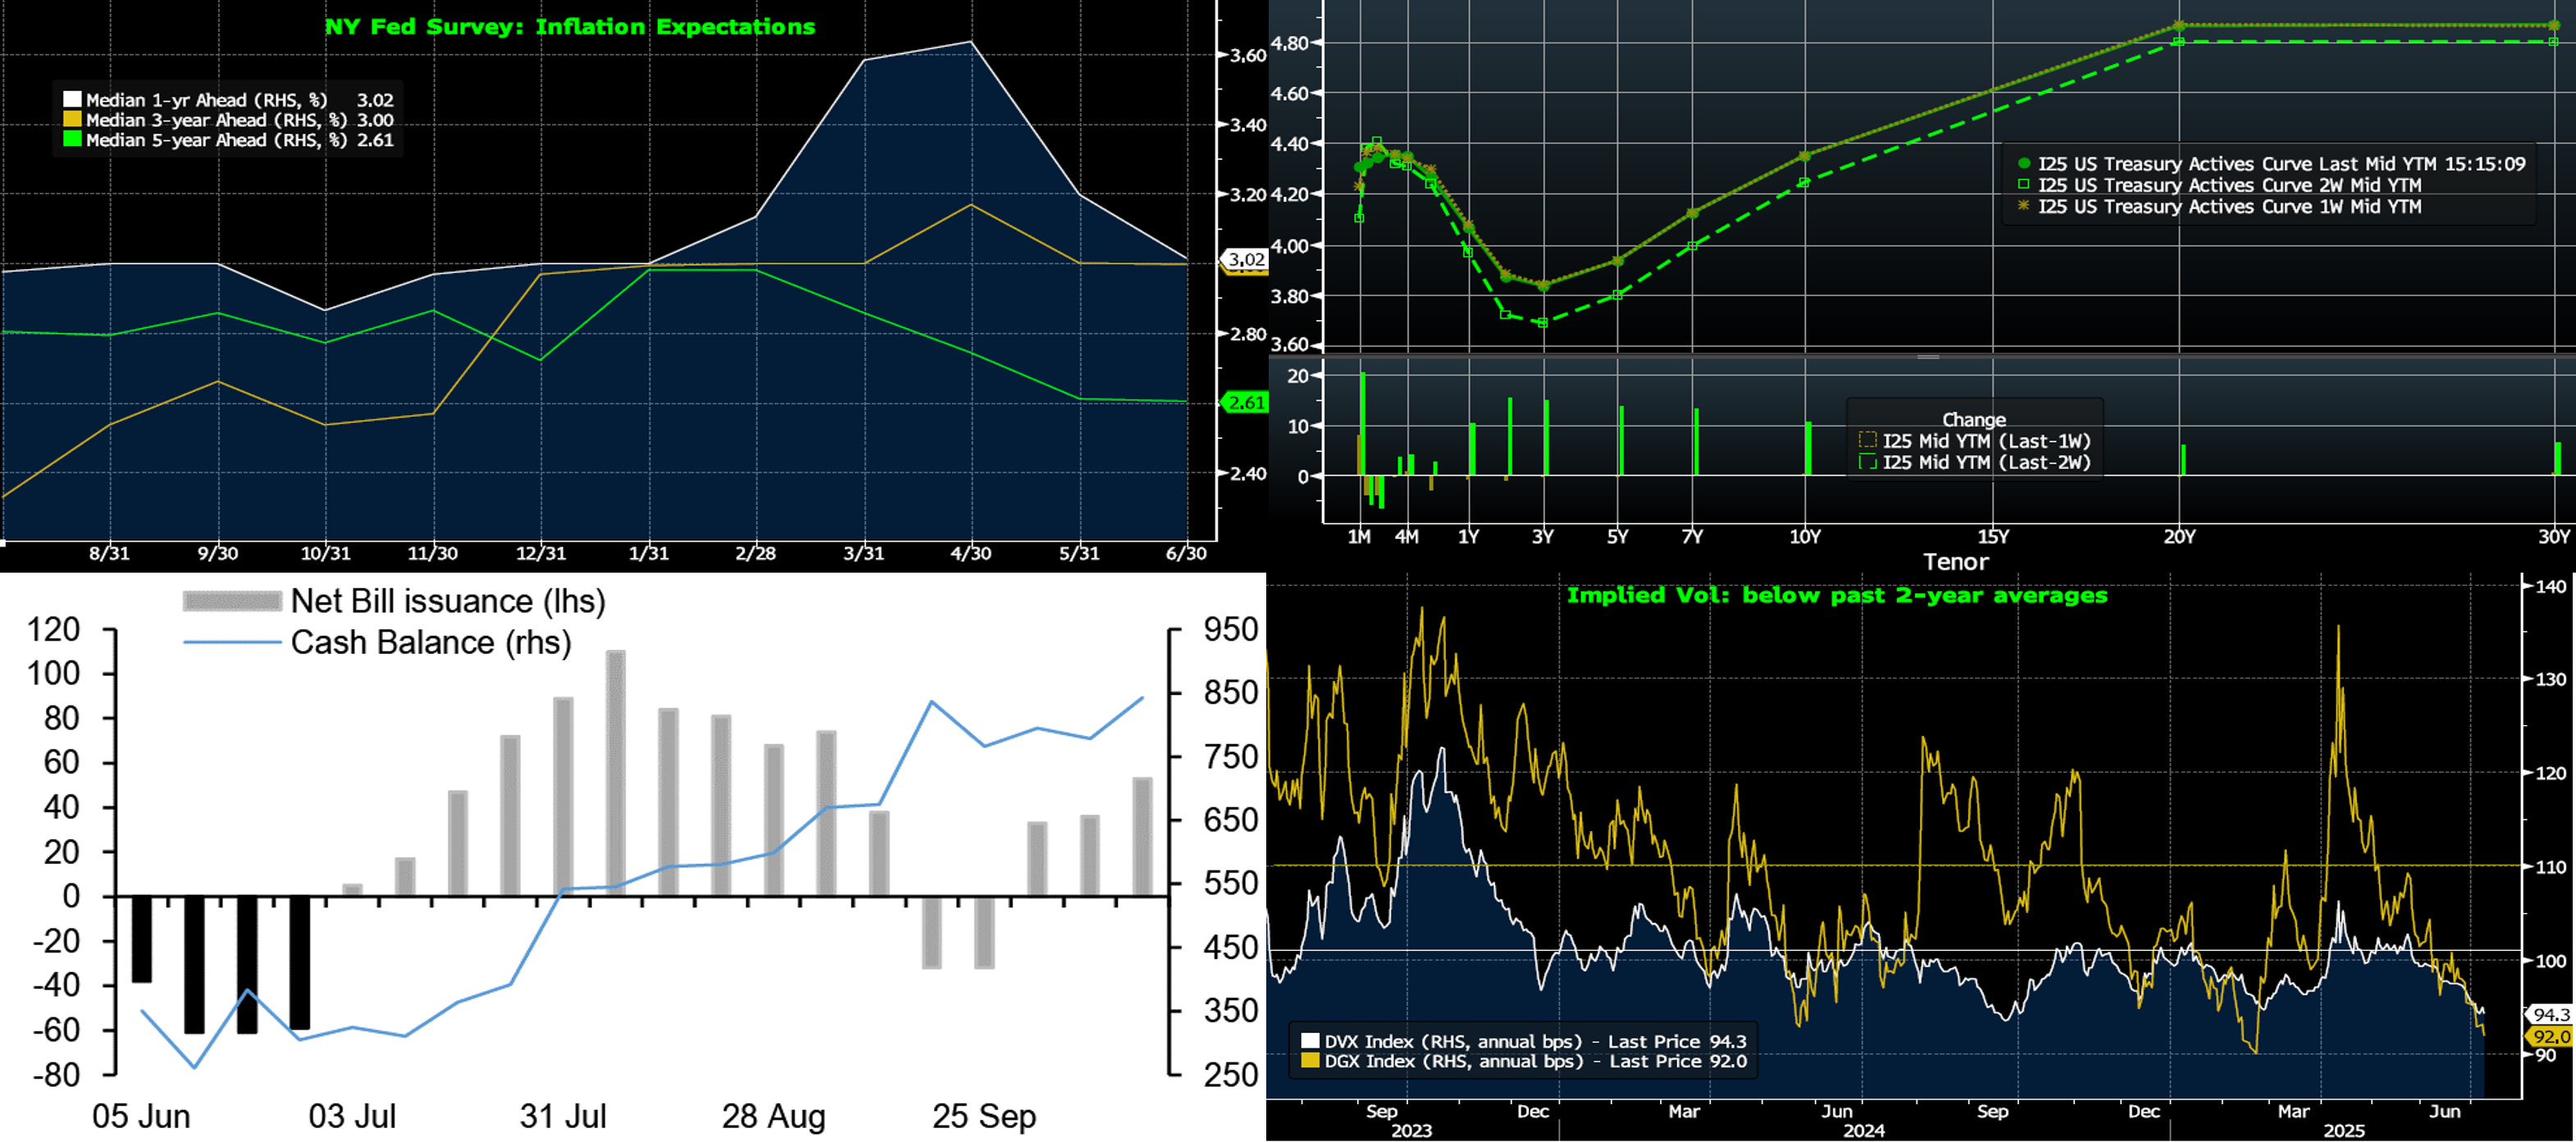
CHART 1 UPPER LEFT
Sources: Bloomberg, FRB NY. This past week, the NY Fed released its latest monthly Survey of Consumer Expectations. As seen here, the report revealed some likely comforting news to the Fed regarding inflation dynamics. Essentially, inflation expectations have reverted to early-2025 pre-tariff announcement levels. In particular, the 1-year barometer declined notably to ~3%. Likely, the recurring pauses in tariffs, in tandem with the time delay for impacts to be clearer, have helped the reversion in these expectations. While clearly above the Fed’s stated goal of 2%, these measures have at least subsided to less worrisome levels. Note that these measures are derived from a survey; the Fed will naturally pay close attention to the upcoming “hard data” in the upcoming week’s CPI and PPI reports. From an employment perspective in the survey, households provided mixed signals, with many bracing for a more difficult time finding a new job, a view which comports with recent data revealing that US companies are generally in slow mode on the hiring or layoffs front.
CHART 2 UPPER RIGHT
Sources: Bloomberg. Top pane is yield (LHS, %); bottom pane is change (LHS, bps). As of late Thursday, the UST term curve was higher by 5 to 15 bps, with shorter tenors leading, from two Thursdays ago. The bulk of the move occurred in quick reaction to July 3rd’s jobs report, as the report was solid enough to notably dilute the market’s pricing of more aggressive Fed cuts. Since then, rates have held steady and the curve rests on top of its same position of a week ago. On the tariff front, the July 8th extended tariffs deadline has now been pushed to August 1st. At this point, markets appear to be shrugging off fresh tariff news, in an apparent view that tariffs will be diluted or delayed, and instead waiting for more definitive impacts on prices and economic growth. As of late Thursday afternoon, the market prices end-2025 fed funds at 3.82%, or ~13 bps higher than two weeks ago. The market’s end-2026 forward is ~3.12%, or 14.5 bps higher than two weeks ago.
CHART 3 LOWER LEFT
Sources: US Treasury; JP Morgan. Shown here is weekly net T-bill issuance (LHS, $bn), both recent historical and JP Morgan projections, as well as the US Treasury General Account (TGA, RHS, $bn). Net issuance has been negative for much of 2025, due to the debt ceiling. Consequently, the TGA was drawn down, which contributed to adding liquidity to the financial system and richer/tighter spreads in short-end markets such as FHLB discount notes. But last week’s signing of the federal budget bill included an increase to the debt ceiling, so these dynamics are expected to reverse in the months ahead. Treasury is expected to rebuild the TGA for operational and stability reasons, and net T-bill issuance is now set to turn decidedly positive. While these changes will affect spreads and potentially bank deposit levels, the overall impacts are expected to be modest. Money Market Funds, sitting at or near record AUM levels, are expected to move into T-bills at now more attractive levels. Strategists expect SOFR, due to a surge in T-bill supply, to widen to Fed Funds by a few bps and perhaps trade ~2 to 3 bps over it.
CHART 4 LOWER RIGHT
Sources: Bloomberg. After spikes in early spring, implied volatility in options markets has fallen back to more tepid levels. Indeed, as seen here, the Deutsche Bank DVX (longer expiry swaptions) and DGX (shorter expiry swaptions) barometers are both clearly below their past 2-year averages. This decline in implied volatility, in tandem with an inverted to flat yield curve, serves to cheapen the cost of interest rate caps. As a reminder for those interested in hedges to higher rates, whether for economic, balance sheet, or regulatory stress test reasons, our Fixed-with-Cap Advance product can serve as a timely solution. Please contact us to learn more about this and/or other products.
FHLBNY Advance Rates Observations
Front-End Rates
- As of Thursday afternoon, short-end rates were generally higher by 2 to 5 bps vs. two weeks ago. Post the July 3rd employment report, the market pared back its pricing of 2025 Fed cuts. Meanwhile, while robust Money Market Fund AUM levels in the past few months have underpinned demand for short-end paper and benefited our funding spreads, the backdrop has changed somewhat now that the debt ceiling has been raised via the budget bill signed on July 4th. Net T-bill supply, negative year-to-date, is now expected to turn decidedly positive as Treasury rebuilds its General Account. This change should serve to reduce liquidity in the financial system. See prior slide for further color.
- The market will focus most closely on the upcoming week’s inflation data.
Term Rates
- The longer-term curve, as of late Thursday and generally mirroring the moves in USTs and swaps, was 10 to 14 bps higher from two Thursdays ago. The shorter tenors led the flattening move. Kindly refer to the previous section for color on market dynamics and changes.
- On the UST term supply front, the upcoming week serves a reprieve from auctions. Note that UST auctions usually occur at 1pm and can occasionally spur volatility around that time. Please contact the Member Services Desk for further information on market dynamics, rate levels, or products.
Reminder: FHLBNY’s 0% Development Advance (ZDA) program is open and running – This program provides members with subsidized funding in the form of interest-rate credits to assist in originating fixed-rate loans or purchasing loans/investments that meet one of the eligibility criteria under the Business Development Advance, Climate Development Advance, Infrastructure Development Advance, Tribal Development Advance, or the new Housing Development Advance. Members can apply for interest rate credits up to $250,000. Please contact Member Services Desk to learn more and check out our ZDA page.
Price Incentives for Advances Executed Before Noon: In effect as of Tuesday, September 5, 2023, the FHLBNY is pleased to now offer price incentives for advances executed before Noon each business day. These pricing incentives offer an opportunity to provide economic value to our members, while improving cash and liquidity management for the FHLBNY. For further details, kindly refer to the Bulletin.
Looking for more information on the above topics? We’d love to speak with you!
Archives
Questions?
If you wish to receive the MSD Weekly Market Update in .pdf format (includes FHLBNY rate charts) or to discuss this content further, please email the MSD Team.