Member Services Desk
Weekly Market Update
This MSD Weekly Market Update reflects information for the week ending January 12, 2024.
Economist Views
Click to expand the below image.
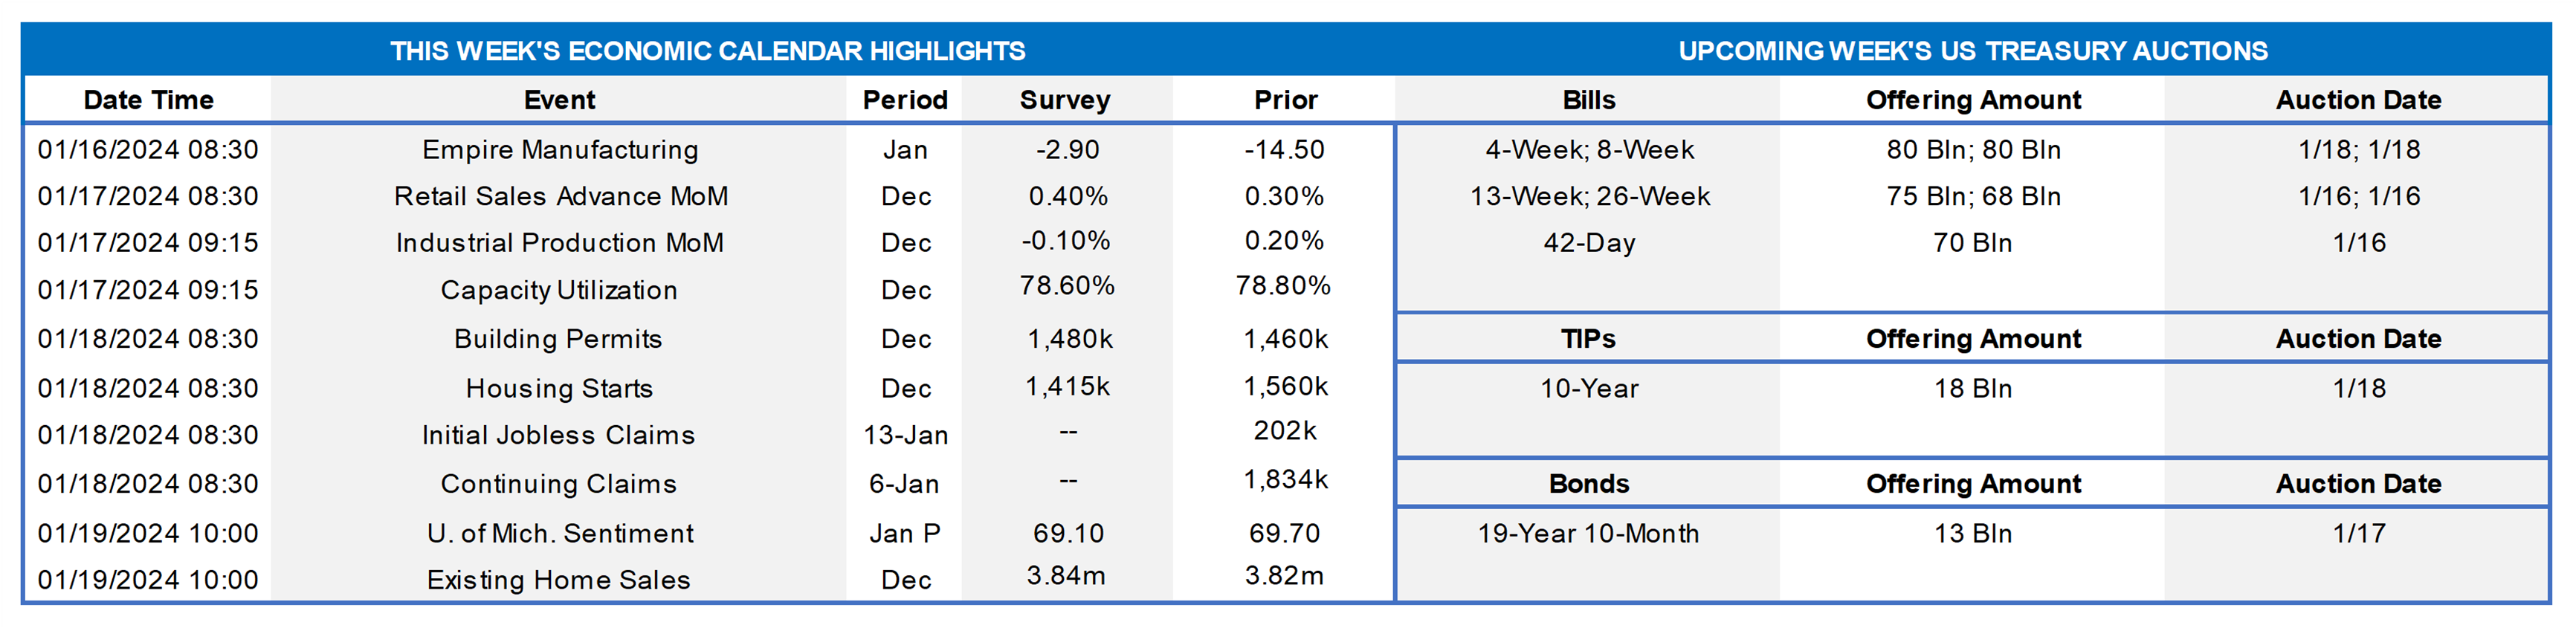
With end-of-year employment and inflation data already released, the market likely will turn to gauging the pace of economic activity during Q4 2023. This week’s reports on retail sales, industrial production and new residential investment activity in December will allow economists to bolster their estimates of real consumer spending and investment outlays during the fall. While real GDP growth is universally expected to slow from the 4.9% annualized clip posted last summer, the range of estimates remains wide, extending from a modest .1% dip to an above-trend 2.5% gain. A quartet of Federal Reserve policymakers, all of whom will be FOMC members in 2024, are scheduled to give their thoughts on the economic outlook and monetary policy.
Empire State Manufacturing Survey: Activity in New York State probably ebbed slightly at the beginning of the New Year. The general business conditions diffusion index – the percentage of survey respondents witnessing a pickup in activity less those experiencing a decline – is expected to register at -2.7% in January, an improvement from the -14.5% reading posted in December.
New York Fed Services Activity Survey: Service-producing activity across New York State, northern New Jersey and southwestern Connecticut likely declined for a fifth straight month in January, though the breadth of deterioration should have improved from the -14.6% reading recorded in December.
Retail & Food Services Sales: Sales likely climbed by .5%, following a better-than-expected .3 prior-month gain. Excluding an anticipated 1.8% jump in auto-dealer revenues, purchases are expected to have edged .2% higher, matching November’s rise. Watch the so-called “control” sales excluding auto, building materials, and gas purchases for clues on consumer spending during Q4. Barring any prior-month revisions, a .3% increase would leave core purchases over the October-November span 3.4% annualized above their July-September average, after a solid 6.1% annualized Q3 gain.
Industrial Production & Capacity Utilization: An anticipated dip in manufacturing output, combined with a weather-related pullback in utilities generation, likely pared this gauge by .3% in December, erasing the modest .2% rise recorded in November. With additions to productive capacity expected to eclipse production during the reference period, the overall operating rate probably moved three ticks lower to 78.5% – the lowest reading since the 77.7% posted in September 2021.
NAHB Housing Market Index: Ongoing reductions in rates probably lifted the sentiment gauge to a three-month high of 40% in January from the 34% reading witnessed in December.
Housing Starts & Building Permits: Unusually favorable weather hints that Street expectations for the number of housing units started and building permits issued in December likely are too low.
Michigan Sentiment Index: Consumers appraisals of current and prospective economic conditions likely propelled the University of Michigan’s confidence gauge to a 2½-year high of 74 in January.
Existing Home Sales: With purchase contract signings nationwide stabilizing over the October-November span, existing home sales probably held steady at a seasonally adjusted 3.82mn in December. That projection, if realized, would place total closings last year at 4.1mn – 19.3% below the 5.08mn dwellings sold in 2022. With the number of available homes on the market likely to contract by 14.2% to a nine-month low of 970K on a not seasonally adjusted basis during the reference period, the supply at the estimated sales pace would decline to just three months – the lowest level since May.
Federal Reserve Appearances:
- Jan. 16 Fed Governor Chris Waller to speak at the Brookings Institution about the economic outlook and monetary policy.
- Jan. 17 Federal Reserve to release Beige Book commentary on district economic conditions.
- Jan. 18 Atlanta Fed President Bostic to speak at the Atlanta Business Chronicle’s 2024 Economic Outlook lunch.
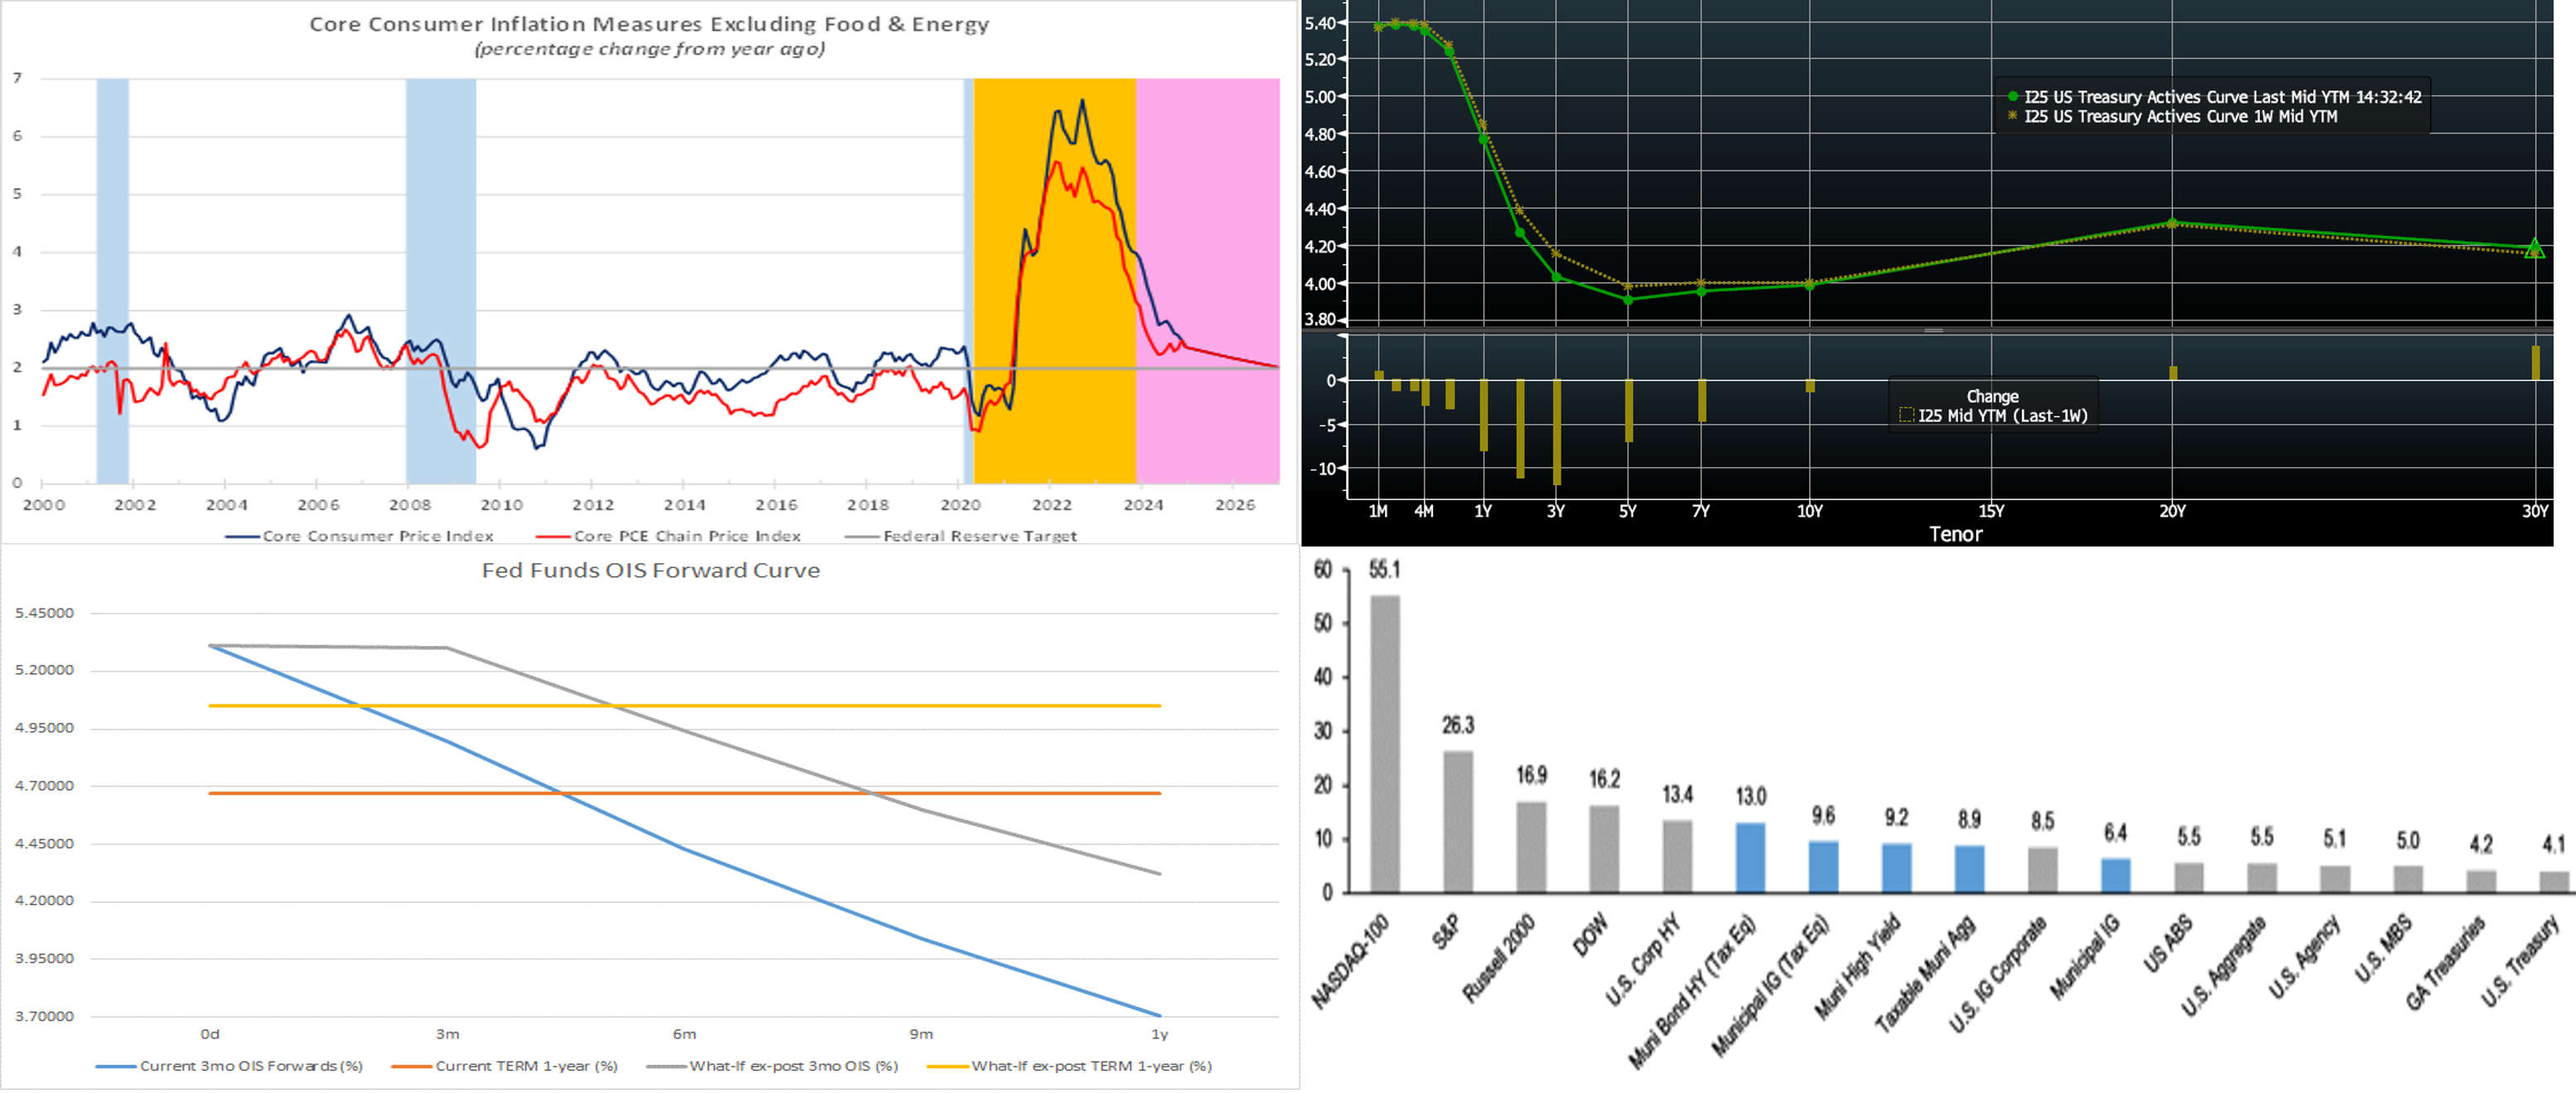
CHART 1 UPPER LEFT
Source: BLS; BEA; Federal Reserve; NBER; FHLBNY. Notes: Blue-shaded areas denote recessions, orange-shaded area highlights current economic expansion, pink-shaded area contains projections. Progress on reining in inflation continued last year. The year-to-year pace of the Consumer Price Index (CPI) was nearly halved to 3.4% over the course of 2023, well below the 9.1% peak witnessed over the 12 months ended June 2022. But stubbornly high shelter costs continue to limit progress on returning to the Fed’s desired 2% target. Indeed, last year’s 6.2% hike in shelter costs was responsible for roughly two-thirds of the rise in the headline CPI witnessed last year and almost 70% of the 3.9% increase in the core measure excluding volatile food and energy. The Summary of Economic Projections released after last month’s FOMC meeting revealed that policymakers expect core inflation gauges to remain above target through 2025.
CHART 2 UPPER RIGHT
Source: Bloomberg. Top pane is yield (LHS, %), bottom pane is change (LHS, bps). From last Thursday afternoon to this one, the UST curve declined in tenors 10-year-and-under, with shorter tenors in the lead. Much of the move occurred this past Thursday afternoon when, despite CPI being a tad above expectations, the market apparently judged the data as nonetheless consistent with an ongoing disinflation trend. Moreover, a heavy slate of UST auctions was absorbed and now in the rear-view mirror. In terms of market-implied pricing of the Fed, the chance of a 25p cut in March is ~70%, up from ~65% last week. The year-end 2024 forward is ~3.83% which equates to 150 bps of cuts.
CHART 3 LOWER LEFT
Source: FHLB-NY. Here we illuminate the importance of the forward curve. For example, let’s assume an institution whose modeling reveals risk to rising or static rates. Perhaps the institution will refrain from action in the belief that the Fed is about to start cutting rates. But the forward curve already has rate cuts priced into it, and, in turn, so do current term rates. Here, we use Overnight Index Swaps for analysis, but the logic also holds for Advance rates. We see here the cuts, ~150 bps by this time next year, in the forwards (blue line); this pricing results in a current 1-year term rate of 4.67% (orange line). But what if the Fed only cuts by ~100 bps (assumed here as 25 bps cuts each in June/July/November/December) in the next year? In that case, as reflected in gray, the actual short-term rates achieved would be higher. And this outcome would result in an effective term rate of ~5.05% for the full year which is clearly worse than if the term 1-year of 4.71% had been taken upfront. To be clear, we do not opine here on current pricing or future direction but only that institutions should assess “what the forward curve is telling us” in their investment, funding, and hedging deliberations.
CHART 4 LOWER RIGHT
Source: Bloomberg Finance LP; JP Morgan. Shown here are 2023 total return metrics (LHS, %) for various investment classes. Highlighted in blue-shading are the returns for Municipal products. As can be seen, the Muni class performed well on both an absolute and relative basis. Indeed, total return after tax adjustment (using 40.8% tax rate) of high-yield (HY) Muni and investment grade (IG) Munis bested each of the fixed income products except US HY Corporates. The Muni class often offers opportunities for after-tax yield pickup compared to USTs and/or MBS. As a reminder, FHLB-NY announced a few months ago the collateral eligibility of Municipal Bonds with a real estate nexus that carry a minimum NRSRO rating of “AA- or above” or equivalent. Please call the Member Services Desk for information.
FHLBNY Advance Rates Observations
Front-End Rates
- Short-end rates were mostly unchanged from a week ago, except for overnight, which retreated from a short-lived move higher last week. Net T-bill supply remains positive, given announcements from Treasury regarding upsized auctions and issuance needs, but the supply continues to be absorbed relatively well, as Money Market Funds (MMFs) switch from the Fed’s RRP to T-bills with competitive yields. Moreover, MMFs currently stand at or near all-time high AUM levels.
- The market will focus on economic data and Fedspeak this upcoming week.
Term Rates
- The longer-term curve, generally mirroring the moves in USTs and swaps, declined from a week ago and was led by shorter tenors. While the 3-year declined ~16 bps, the 5- and 10-year declined by ~10 and 7 bps, respectively. Please refer to the previous section for color.
- On the UST term supply front, the upcoming week serves a 20-year nominal and a 10-year TIPS auction. Note that UST auctions usually occur at 1pm and can occasionally cause volatility around that time. The usual heavy January corporate bond issuance calendar should also feature in the week ahead. Please contact the Member Services Desk for further information on market dynamics, rate levels, or products.
Grant funding under the FHLBNY 2023 Small Business Recovery Grant (SBRG) Program has begun and some funds are still available. The SBRG Program provides grant funds to benefit FHLB-NY members’ small business and non-profit customers. Please visit the SBRG webpage.
Price Incentives for Advances Executed Before Noon: In effect as of Tuesday, September 5, 2023, the FHLBNY is pleased to now offer price incentives for advances executed before Noon each business day. These pricing incentives offer an opportunity to provide economic value to our members, while improving cash and liquidity management for the FHLBNY. For further details, kindly refer to the Bulletin.
The Symmetrical Prepayment Advance Feature
For those anticipating term funding needs, and with rates on an uptrend, it can be an appropriate juncture to consider our SPA feature. This feature allows the member to capture, at prepayment, changes in the fair value of the advance which are favorable to the member. Contact Member Services Desk to discuss.
Looking for more information on the above topics? We’d love to speak with you!
Questions?
If you wish to receive the MSD Weekly Market Update in .pdf format (includes FHLBNY rate charts) or to discuss this content further, please email the MSD Team.