Member Services Desk
Weekly Market Update
This MSD Weekly Market Update reflects information for the week ending June 27, 2025.
Economist Views
Click to expand the below image.
We thank Chief Economist Brian Jones for his invaluable contributions to the Weekly Update and wish him well in retirement! The MSD Update will return on Friday, July 11, 2025. Happy Independence Day!
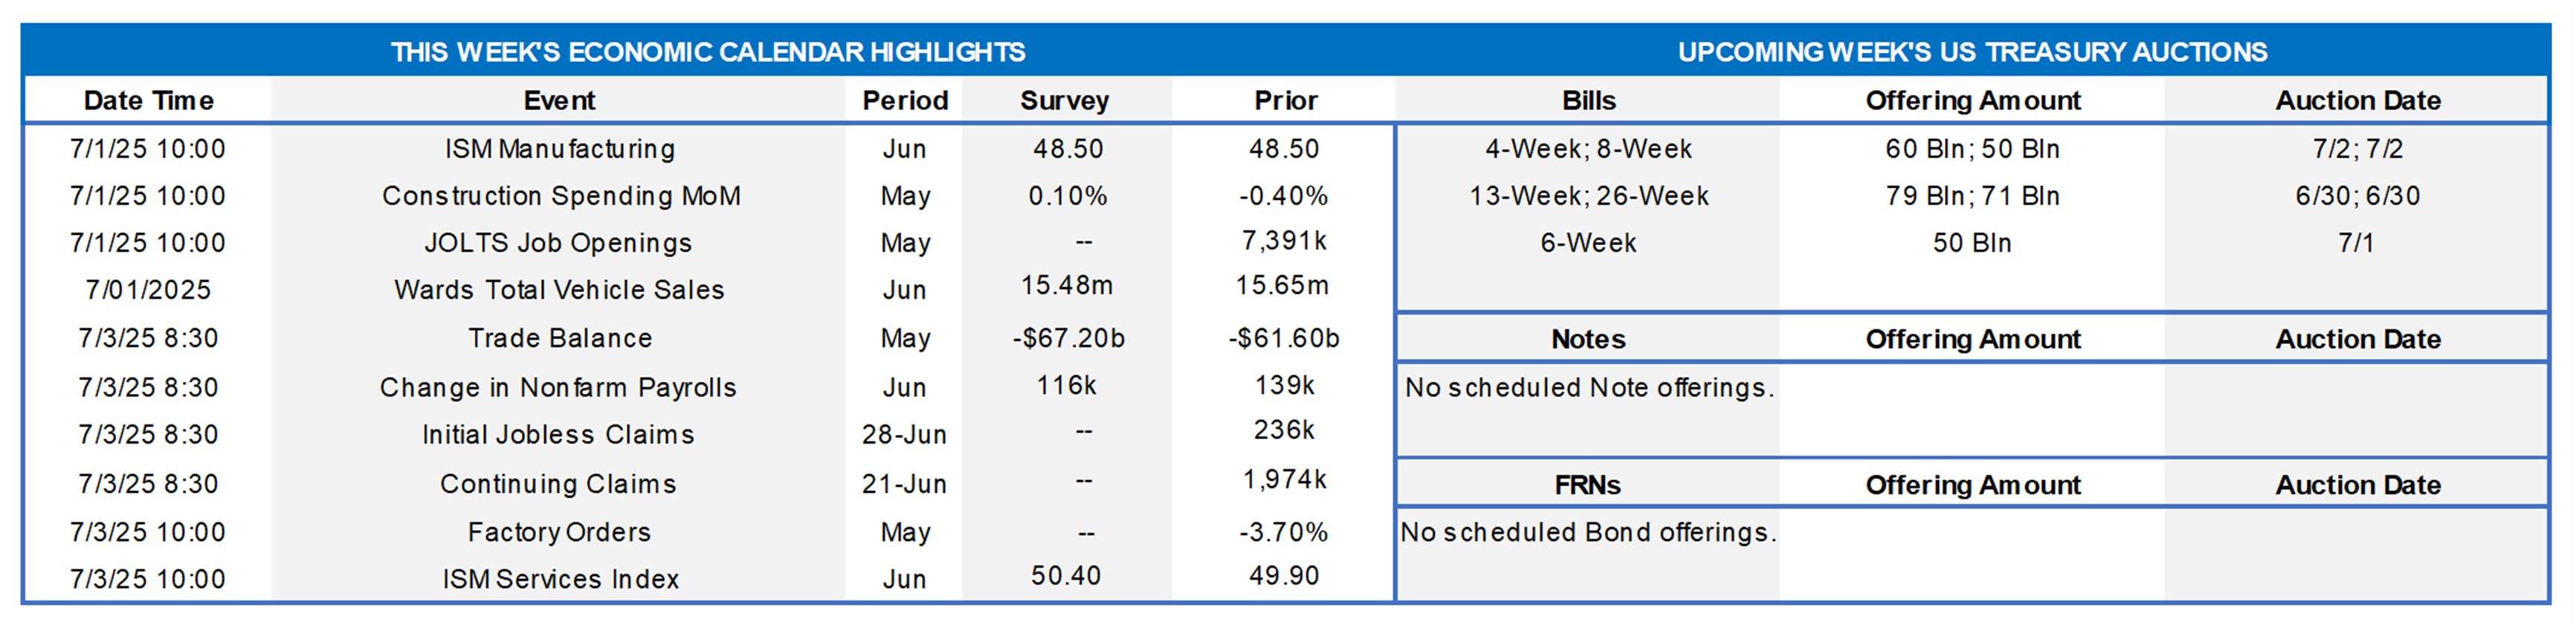
The market’s focus will return to the labor side of the Federal Reserve’s dual mandate this week when the Bureau of Labor Statistics (BLS) releases its update on the employment situation in June. Canvasses from the Institute for Supply Management (ISM) are expected to be mixed, with service-producing activity expanding and manufacturing contracting. A trio of Federal Reserve officials, including Chair Powell, are scheduled to make public appearances this week.
ISM Manufacturing Activity Index: Available canvasses suggest that the gauge dipped to an eight-month low of 48% in June from 48.5% in the previous month. That projection, if realized, would mark the fourth straight monthly contraction in nationwide factory activity.
Construction Spending: The nominal value of new construction put-in-place likely rebounded in May, erasing the .4% dip witnessed in April.
JOLTS Job Openings: A reported pullback in online help-wanted postings suggests nationwide job openings declined by 40K to 7.35mn in May. At an estimated 115K during the reference period, the excess of vacant positions nationwide would represent 1.02 jobs per unemployed person.
Motor Vehicle Sales: Correcting from the tariff-induced surges witnessed in spring, purchases probably retreated by 4.1% to a SAAR of 15mn in June – the lowest tally since the beginning of 2024.
International Trade Balance: Reflecting a reported widening of the merchandise trade deficit, the shortfall on international trade likely rose to $70.8bn in May from $61.6bn in the preceding month.
Jobless Claims: Initial claims for unemployment benefits probably rebounded to a 3-week high of 250K during the filing period ended June 28. The total number of persons receiving regular state benefits during the week of June 21 likely registered above the 2mn mark for the first time since November 2021, suggesting that recent job losers are having a more challenging time finding work.
Employment Situation Report: Labor market soundings likely were mixed as Q2 closed. Buoyed by a favorable swing in weather conditions during this month’s survey period, nonfarm payrolls probably expanded by 190K – the largest net job gain since December. By contrast, weekly tallies of those receiving regular state unemployment insurance benefits suggest that the civilian jobless rate moved two ticks higher to 4.4% in June, placing the Sahm-Rule recession gauge at .27%, still shy of the .5% critical value consistent with previous business-cycle turning points. With a four-week interval between BLS’ canvassing periods, average hourly earnings likely rose by .3%, after a .4% gain in May. That projection, if realized, would place nominal hourly compensation 3.9% above that received a year earlier. Results in line with the above forecasts would probably leave market-based expectations of a 25-bps cut in the federal funds rate target in September unaltered.
Factory Orders: Powered by a reported moonshot in commercial jetliner bookings, factory orders probably jumped by 7.9% in May, completely erasing the 3.7% decline witnessed in April.
ISM Service-Producing Activity Index: The expansion probably resumed in June, with the barometer rising to 51.5% from 49.9% in the preceding month.
Federal Reserve
- June 30 Atlanta Fed President Bostic to speak on the US economic outlook at an event hosted by Market News International.
- July 1 Central Bank Heads Powell, Lagarde (ECB), Bailey (BOE), Ueda (BOJ) and Rhee (BOK) to speak at an ECB policy panel.
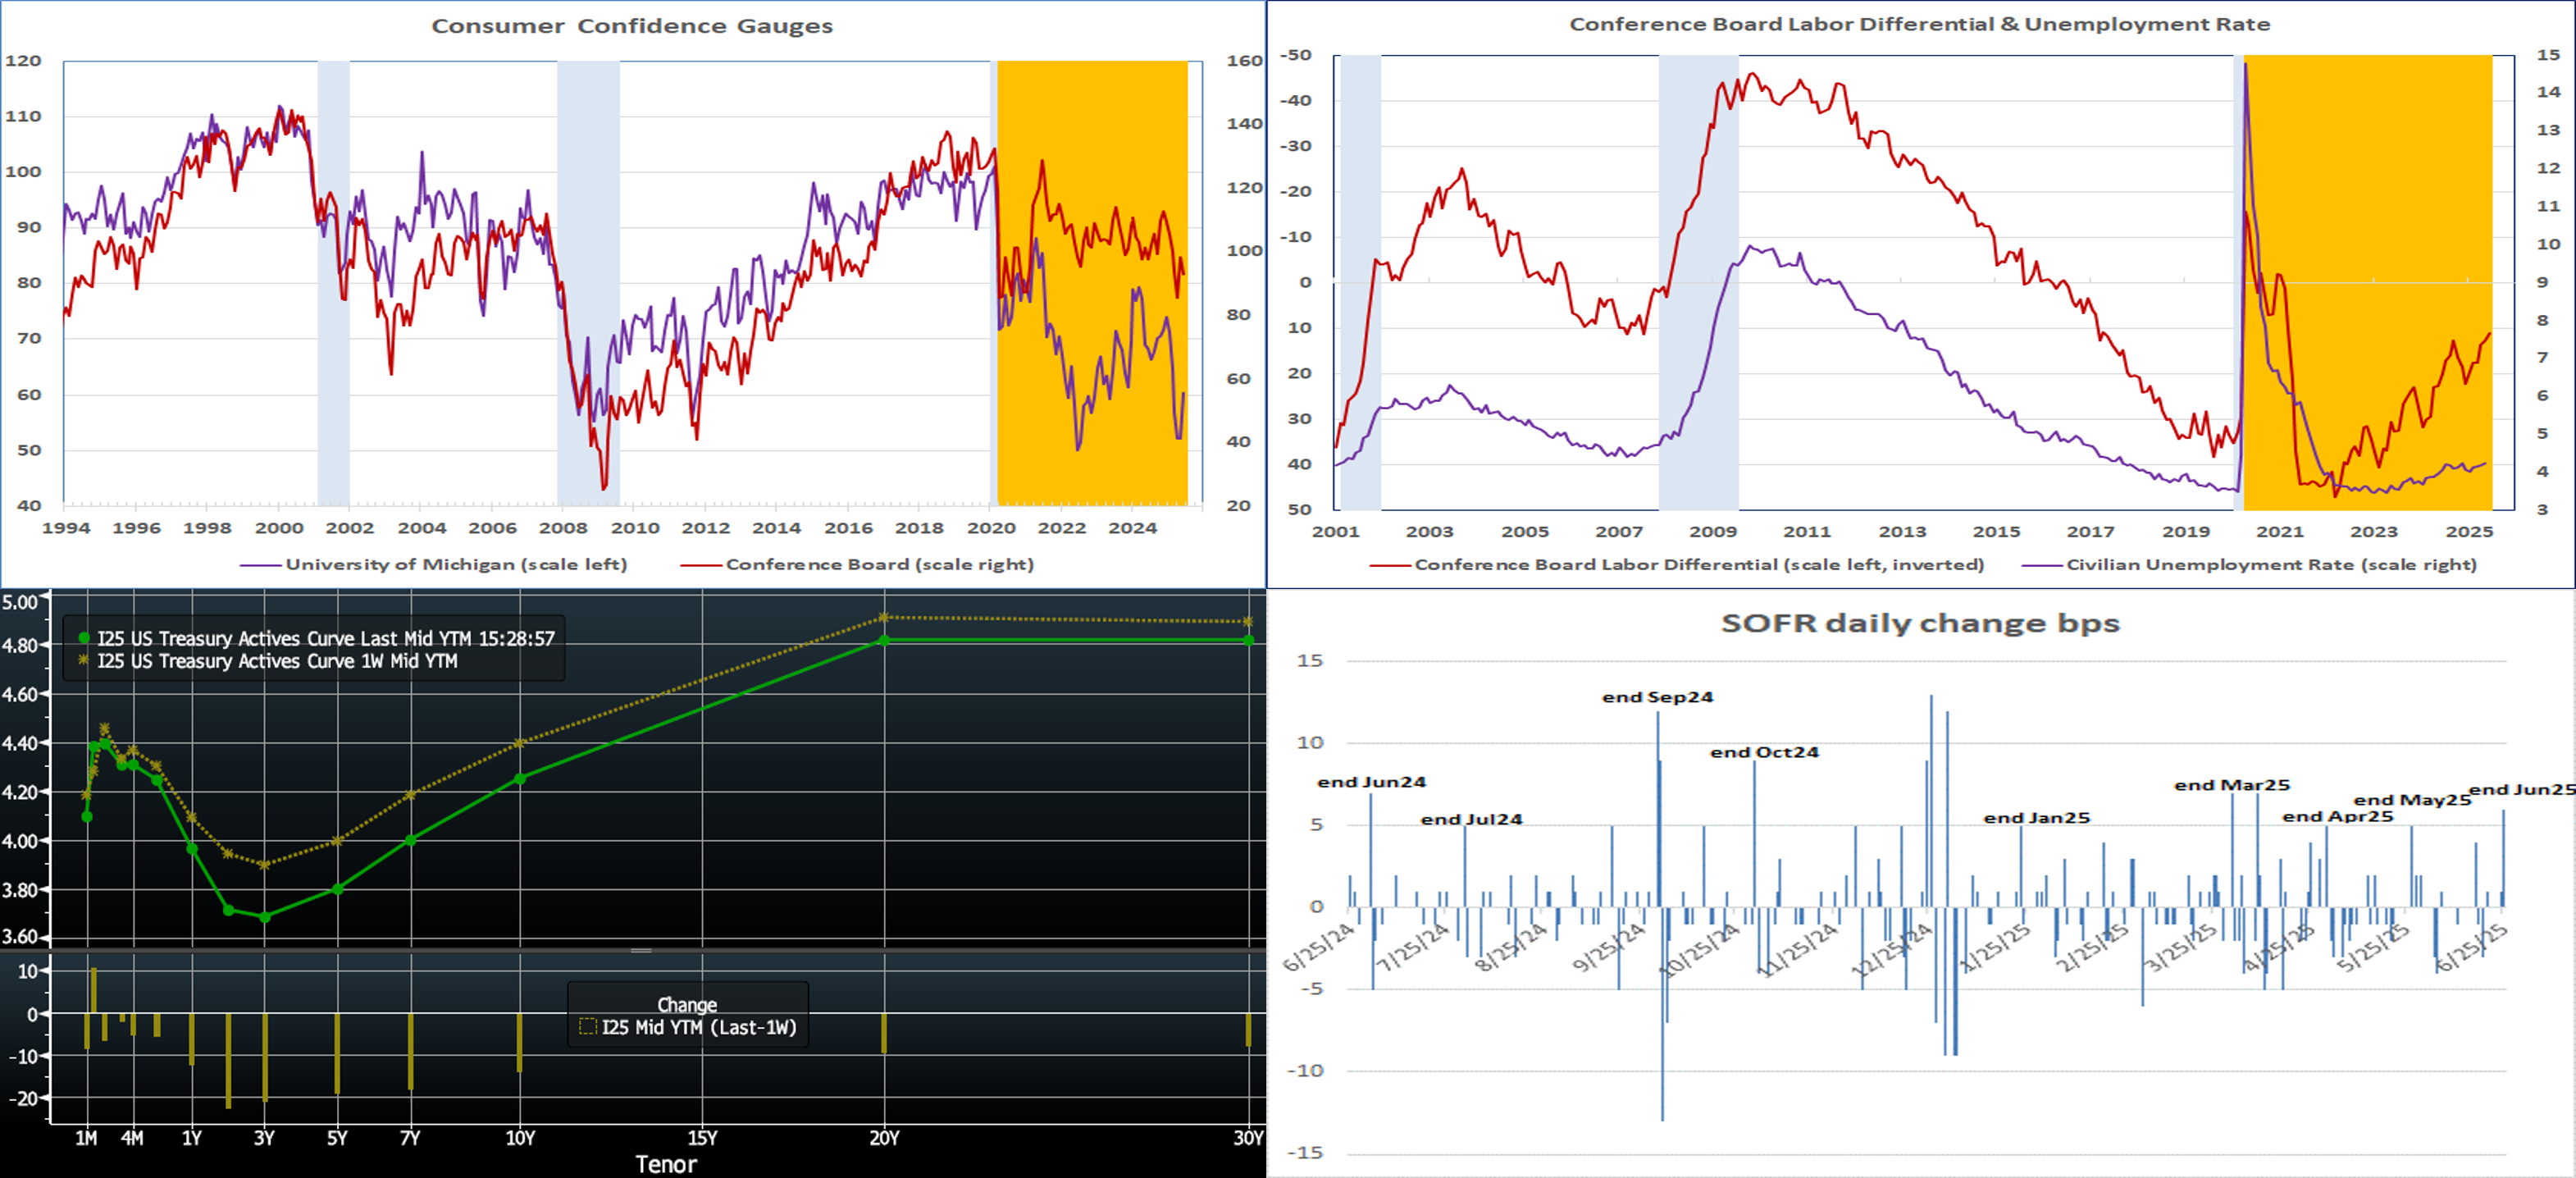
CHART 1 UPPER LEFT and CHART 2 UPPER RIGHT Sources: Bureau of Labor Statistics (BLS); Conference Board; National Bureau of Economic Research; FHLB-NY. Notes: Blue-shaded areas denote recessions; orange-shaded area highlights the current economic expansion. In contrast to the reported improvement in the University of Michigan’s sentiment gauge, this week’s Conference Board consumer confidence barometer portrayed a faltering for June. Not only were survey respondents less upbeat about the present economic environment, but they also were more guarded in their expectations six months out. Labor market conditions were an area of particular concern. Indeed, the Conference Board’s labor differential – the percentage of respondents feeling that jobs are plentiful less those believing that positions are hard to get – slipped from 12.7% in May to 11.1% last month, the weakest reading since March 2021. Heading into the BLS’ July 3rd employment situation report, this development would be consistent with an upward drift in the civilian jobless rate from the 4.2% witnessed in May.
CHART 3 LOWER LEFT Sources: Bloomberg. Top pane is yield (LHS, %); bottom pane is change (LHS, bps). As of late Thursday, the UST term curve had trended lower from the week prior by 7 to 20 bps; the shorter tenors led the curve steepening move, with the 2-year lower by 20 bps. Economic data was generally softer than expected this past week. In addition to the Confidence numbers covered above, Thursday’s Q1 real GDP final revision was announced at -.5% vs. expectations of -.2%. Meanwhile, early-Thursday news stories of the Administration possibly fast-tracking a nomination announcement of a replacement for Fed Chair Powell sparked lower yields in the short end of the curve, as the market assumes any replacement will have a more dovish stance than Powell. Meanwhile, July 8th marks the end date of many of the tariffs put on pause; whether a further pause or a resolution is in store remains to be seen. As of late Thursday afternoon, the market prices end-2025 fed funds at 3.69%, or ~17 bps lower than a week ago. The market’s end-2026 forward is ~2.975%, or 22.5 bps lower than a week ago.
CHART 4 LOWER RIGHT Sources: Bloomberg; NY Fed; FHLB-NY. Shown here are the daily changes in SOFR over the past year. As denoted in the chart, SOFR has sustained a tendency to rise into and around month and quarter-ends. While rising to varying degrees, quarter-ends have experienced the biggest increases; this dynamic is not surprising, given that the market’s balance sheet constraints tend to be higher at quarter-ends and cause more volatility and upward drift in repo market rates. Exacerbating this dynamic are the oft-heavy slate of UST auction settlements near month-ends, which serve to take liquidity out of the system and/or require financing. For instance, last week’s 2/5/10-year auctions all settle on 6/30. SOFR has increased by 8 bps in the past week and appears poised to rise a bit more in the days ahead. This upward pressure on SOFR, in turn, sparks upward pressure on our very-short tenor advance rates, such as, most notably, overnight. The upward pressure on SOFR tends to dissipate in the days or week following month-end. For our borrowers who know that they will likely require short-term liquidity for a period, it can be wise to extend at least some borrowing out of Overnight and into 2 or 3-week tenors and thereby be less impacted by the month-end dynamics. Given that our short-end rates compare favorably to IOER on a dividend-adjusted basis, there is little opportunity cost to possibly maintaining more liquidity than needed. Also, it is wise to consider and gauge the chance of a Fed-easing near month-ends in this borrowing situation; the next FOMC meeting announcement, for instance, happens to fall on July 30th.
FHLBNY Advance Rates Observations
Front-End Rates
- As of Thursday afternoon, short-end rates were mixed vs. a week ago. The 1-month-and-in sector was higher by 1 to 12 bps, with the shortest tenors leading the move. Overnight rose by 12 bps, due to quarter-end pressures detailed in the previous section herein. The 2- to 5-month zone was unchanged to up a bp, while the 6-month dipped by 2 bps. Robust Money Market Fund AUM levels have continued to underpin demand for short-end paper, thereby generally benefiting our funding spreads. Also helpful is that net T-bill supply has been negative year-to-date, owing to debt ceiling dynamics, although this net supply dynamic is expected to change later in the year.
- Along with geopolitical and trade policy developments, the market will particularly focus on Thursday’s jobs data in the upcoming holiday-shortened week.
Term Rates
- The longer-term curve, as of late Thursday and generally mirroring the moves in USTs and swaps, was lower and steeper from the week prior. The 2, 5, and 10-year were lower by 20, 17, and 13 bps, respectively. Kindly refer to the previous section for color on market dynamics and changes.
- On the UST term supply front, the upcoming holiday week serves as a reprieve from auctions. Note that UST auctions usually occur at 1pm and can occasionally spur volatility around that time. Please contact the Member Services Desk for further information on market dynamics, rate levels, or products.
Reminder: FHLBNY’s 0% Development Advance (ZDA) program is open and running – This program provides members with subsidized funding in the form of interest-rate credits to assist in originating fixed-rate loans or purchasing loans/investments that meet one of the eligibility criteria under the Business Development Advance, Climate Development Advance, Infrastructure Development Advance, Tribal Development Advance, or the new Housing Development Advance. Members can apply for interest rate credits up to $250,000. Please contact Member Services Desk to learn more and check out our ZDA page.
Price Incentives for Advances Executed Before Noon: In effect as of Tuesday, September 5, 2023, the FHLBNY is pleased to now offer price incentives for advances executed before Noon each business day. These pricing incentives offer an opportunity to provide economic value to our members, while improving cash and liquidity management for the FHLBNY. For further details, kindly refer to the Bulletin.
Looking for more information on the above topics? We’d love to speak with you!
Archives
Questions?
If you wish to receive the MSD Weekly Market Update in .pdf format (includes FHLBNY rate charts) or to discuss this content further, please email the MSD Team.