Member Services Desk
Weekly Market Update
Economist Views
Click to expand the below image.
The upcoming Federal Open Market Committee (FOMC) meeting will be the key event of the week. While acknowledging recent positive developments on the economic and healthcare fronts, the FOMC likely will reiterate that it expects to maintain an accommodative stance on monetary policy, with a federal funds rate target range of 0 to .25%, until it achieves maximum employment and inflation at a rate of 2% over the longer run. The communiqué to be issued after the meeting probably will also repeat that the Fed will continue to increase its holdings of UST’s by at least $80bn per month and of Agency MBS by at least $40bn per month until substantial further progress has been made toward the Committee’s goals. Since Covid-19 struck, the Fed has increased its outright holdings of securities by $3.1trn to a total of $7trn, with UST’s and MBS accounting for 70% and 30%, respectively, of that rise.
As per convention, the Fed will also publish a new Summary of Economic Projections. Significant upward adjustments are expected to the real GDP growth and unemployment rate forecasts released after the December meeting. Those earlier projections were done before the $900bn Coronavirus Response and Relief Supplemental Appropriations Act was approved on December 21. The new round of estimates will incorporate the anticipated effects of that legislation as well as those of the newly signed $1.9trn American Rescue Plan Act. Consumer price projections may be marked higher as well. Market participants will pay focus to the so-called “dot plot” of policymakers’ rate expectations for any sign that the potential liftoff date of administered rates has been moved forward.
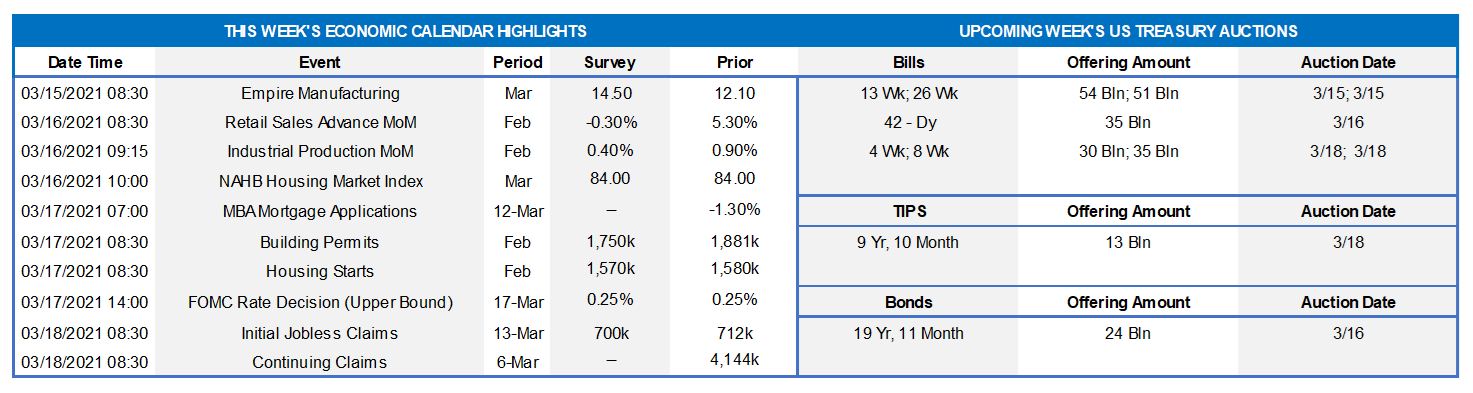
Empire State Manufacturing Survey: The expansion of local factory activity likely entered its ninth month in March, with the extent of gains likely improving on February’s breadth. The general business conditions diffusion index – the percentage of respondents experiencing a pickup in activity less those witnessing a decline – is expected to climb to 14.5% from 12.1% in the prior month.
Retail & Food Services Sales: The Census Bureau’s update on last month’s retail activity will prompt forecasters to mark-to-market their projections for current-quarter consumer spending growth. Reflecting an already reported pullback in unit motor vehicles purchases, the consensus anticipates a comparatively modest 0.3% dip in February. The Street will accord particular attention to “control sales”. Barring any prior-month revisions, the 1% expected decline would place core purchases over the January-February span 14.5% annualized above their fourth-quarter average.
Industrial Production: Stepped-up factory activity, combined with an electricity led increase in utilities output, probably pushed industrial production .4% higher in February. With additions to productive capacity expected to marginally eclipse output during the reference period, the operating rate of the nation’s factories, mines, and utilities likely moved one tick lower to 75.5%.
NAHB Housing Market Index: Home-builder optimism probably improved leading into spring, thereby propelling the gauge of sales and prospective buyer traffic closer to the record high reading of 90 recorded last November.
Jobless Claims: Initial and continuing claims for regular state unemployment insurance benefits likely retreated during their respective reporting periods. Those figures continue to understate the adverse impact of the pandemic on the domestic labor market, however. Indeed, as of February 20, an estimated 20.1mn persons were receiving some sort of unemployment assistance, down from the pandemic peak of 32.4mn reached last June, but still well above the 2.1mn figure that prevailed before COVID-19 struck last March.
Federal Reserve Appearances:
Mar. 17 Federal Open Market Committee Communiqué.
Mar. 17 Federal Reserve to release updated Summary of Economic Projections.
Mar. 17 Federal Reserve Chair Jerome Powel to hold post-FOMC meeting press conference.
Click to expand the below images.
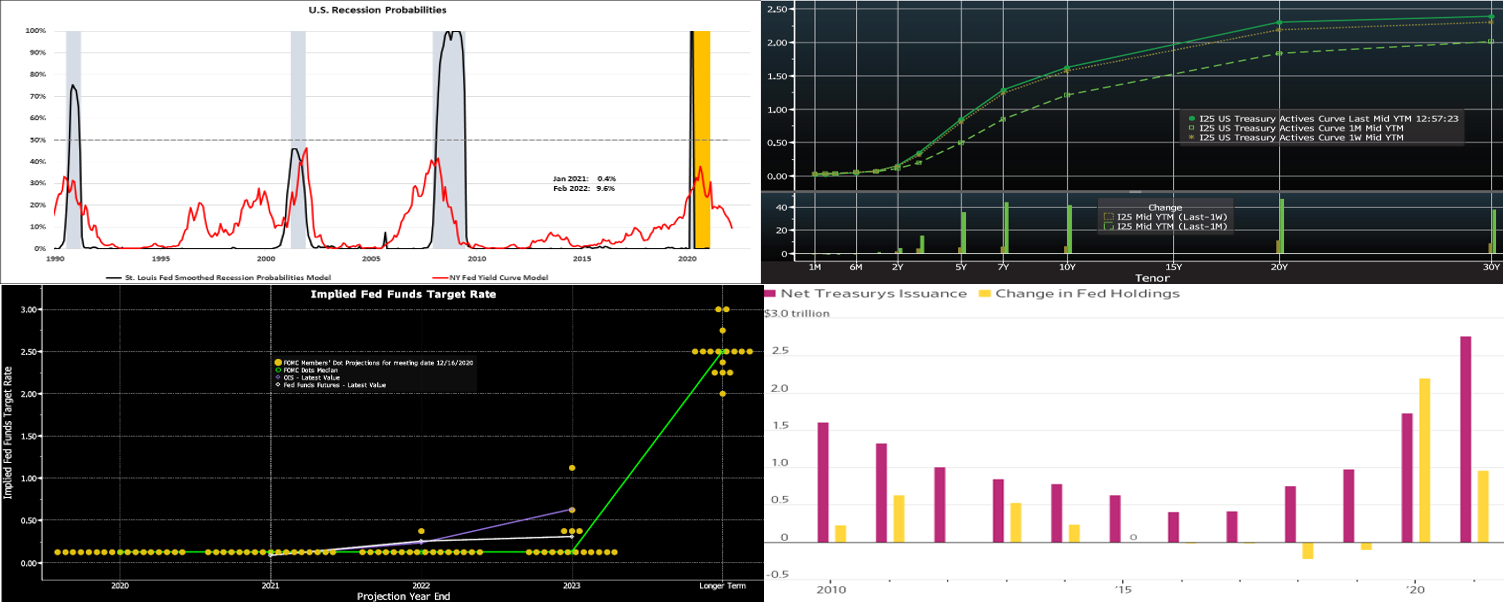
CHART 1 – UPPER LEFT
Source: FRB St. Louis and NY, FHLBNY. The latest reading from the smoothed U.S. recession probabilities model maintained by Professor Jeremy Piger of the University of Oregon, which relies on nonfarm payrolls, industrial output, real personal income excluding transfer payments, and real manufacturing and trade sales – a series considered by the National Bureau of Economic Research in determining business cycle turning points – was little changed at just .4% in January. After hitting the 100% mark in spring 2020, the probability that the domestic economy was in contraction has been negligible over the latest nine months. Reflecting the widening yield spread between the 10-year UST and 3-month T-bill since July, the New York Fed’s model put the chances that the economy will be in a recession next February at a 3-year low of 9.6%. Moreover, recent changes in market rates suggest that the chances of an economic contraction by next March will be even lower.
CHART 2 – UPPER RIGHT
Source: Bloomberg. Note: top pane is yield (%), bottom pane is change (bps). The UST curve again crept higher and steeper week-over-week, with most of the move occurring on Friday. While shorter maturities finished a few bps higher, the 5 through 10-year sector was ~4 to 7 bps higher, in progressive fashion. As mentioned in previous editions, the recent upward and steeper move in rates should prove welcome for many financial institutions’ net interest figures. While the Covid-19 situation has plateaued at still concerning levels, the notable upward trend in vaccinations has boosted economic projections. The American Rescue Plan, the broad and large relief/stimulus legislation signed into law late-week, adds to near-term upward adjustments to forecasts of both economic data and UST supply. Recent economic data has generally outperformed consensus forecasts. The market also eagerly awaits a regulatory decision on an extension past 3/31 of the exemption of banks’ UST holdings from the Supplemental Leverage Ratio calculation; if not extended, then bank demand for UST’s could decrease. These dynamics continue to underpin the “bear steepening”.
CHART 3 – LOWER LEFT
Source: Bloomberg. Given the upcoming FOMC meeting, here is a look at the most recent “dot plot” from the last meeting as well as current OIS (Overnight Index Swaps, the term fed funds rate yield curve) extrapolations of the level of fed funds. The market has priced for over two “hikes” by year-end 2023, due to the improving economic backdrop. Possibly some Fed Committee members may adjust their forecasts/”dots” higher, but the Fed overall may try to “tamp down” such market expectations. The market and curve will listen and react accordingly to the meeting outcome.
CHART 4 – LOWER RIGHT
Source: Bank of America, WSJ. A contributor to recent upward pressure on rates is ongoing and anticipated UST supply and record-size auctions. Net new supply of 2 to 30-year UST’s is expected to reach $2.8trn this year, according to Bank of America Research, up from $1.7trn last year and around $990bn in 2019. The Fed, meanwhile, is expected to purchase $960bn of UST’s this year, down from more than $2trn last year. Consequently, a much greater share of the supply must be absorbed by the markets.
FHLBNY Advance Rates Observations
Front-End Rates
Short-end advance rates finished a bp lower, week-over-week. T-bill issuance was its usual market feature, but net supply has slowed and thereby allowed for easier market absorption. Money market funds’ AUM increased by ~$30bn this past week, led by a surge in Government-Only funds, thereby infusing demand for short paper. From a bigger-picture vantage point, an overall moderation in market supply of short paper, in tandem with high cash levels in the market, is expected to keep short-end rates relatively steady and under downward pressure in the year’s first half.
UST issuance overall is now net positive supply in that more is being issued than what the Fed is buying in its programs. However, with short UST rates at rock-bottom levels and the Fed on hold for a long period, rates are likely to persist in a near-term sideways to softer pattern. Importantly, weekly net T-bill issuance has been lower since last summer and even negative at times in recent weeks/months, and Treasury has announced plans to shift issuance out the curve. Even with the new relief package and related borrowing, these market supply/demand and Treasury issuance dynamics should keep short rates in check on the upside. Notably, overnight GC repo traded below 0% late this past week.
Term Rates
On the week, medium and longer-term Advance rates were ~1 to 7bps higher, with the 5 to 10-year sector of the curve leading the way. See the previous section for further color on relevant market dynamics.
On the UST supply front, this week brings a 10-year TIPS and a 20-year nominal auction. Recent auction sizes have been of record size and another contributor to the curve’s moves, as buyers have demanded higher yields. Corporate issuance, such as Verizon’s massive sale of bonds in longer maturities, has also influenced the curve. Focus this week will center on the FOMC meeting.
New Product Alert: In order to satisfy member needs and provide greater product flexibility to match bond and derivative market conventions, FHLB-NY now offers SOFR-linked advances based on SOFR-index compounding. Note that this product is in addition to SOFR-linked advances based on SOFR-index averaging which have been offered since November 2018.
The Symmetrical Prepayment Advance Feature
With rates at or near multi-year lows, it is a compelling juncture to use the SPA feature on term advances. This feature allows member to capture, at prepayment, changes in the Fair Value of the advance which are favorable to the member. Contact us to discuss.
Looking for more information on the above topics? We’d love to speak with you!
Questions?
If you wish to receive the MSD Weekly Market Update in .pdf format (includes FHLBNY rate charts) or to discuss this content further, please email the
MSD Team.
Special Member Alert
The FHLBNY recently announced a newly expanded and flexible Disaster Relief Funding (DRF) advance program which offers discounted rate advances with maturities 1-mo and greater. Additionally, we have announced that PPP loans will be accepted as eligible collateral. Please contact us with any questions.