Member Services Desk
Weekly Market Update
This MSD Weekly Market Update reflects information for the week ending June 20, 2025.
Economist Views
Click to expand the below image.
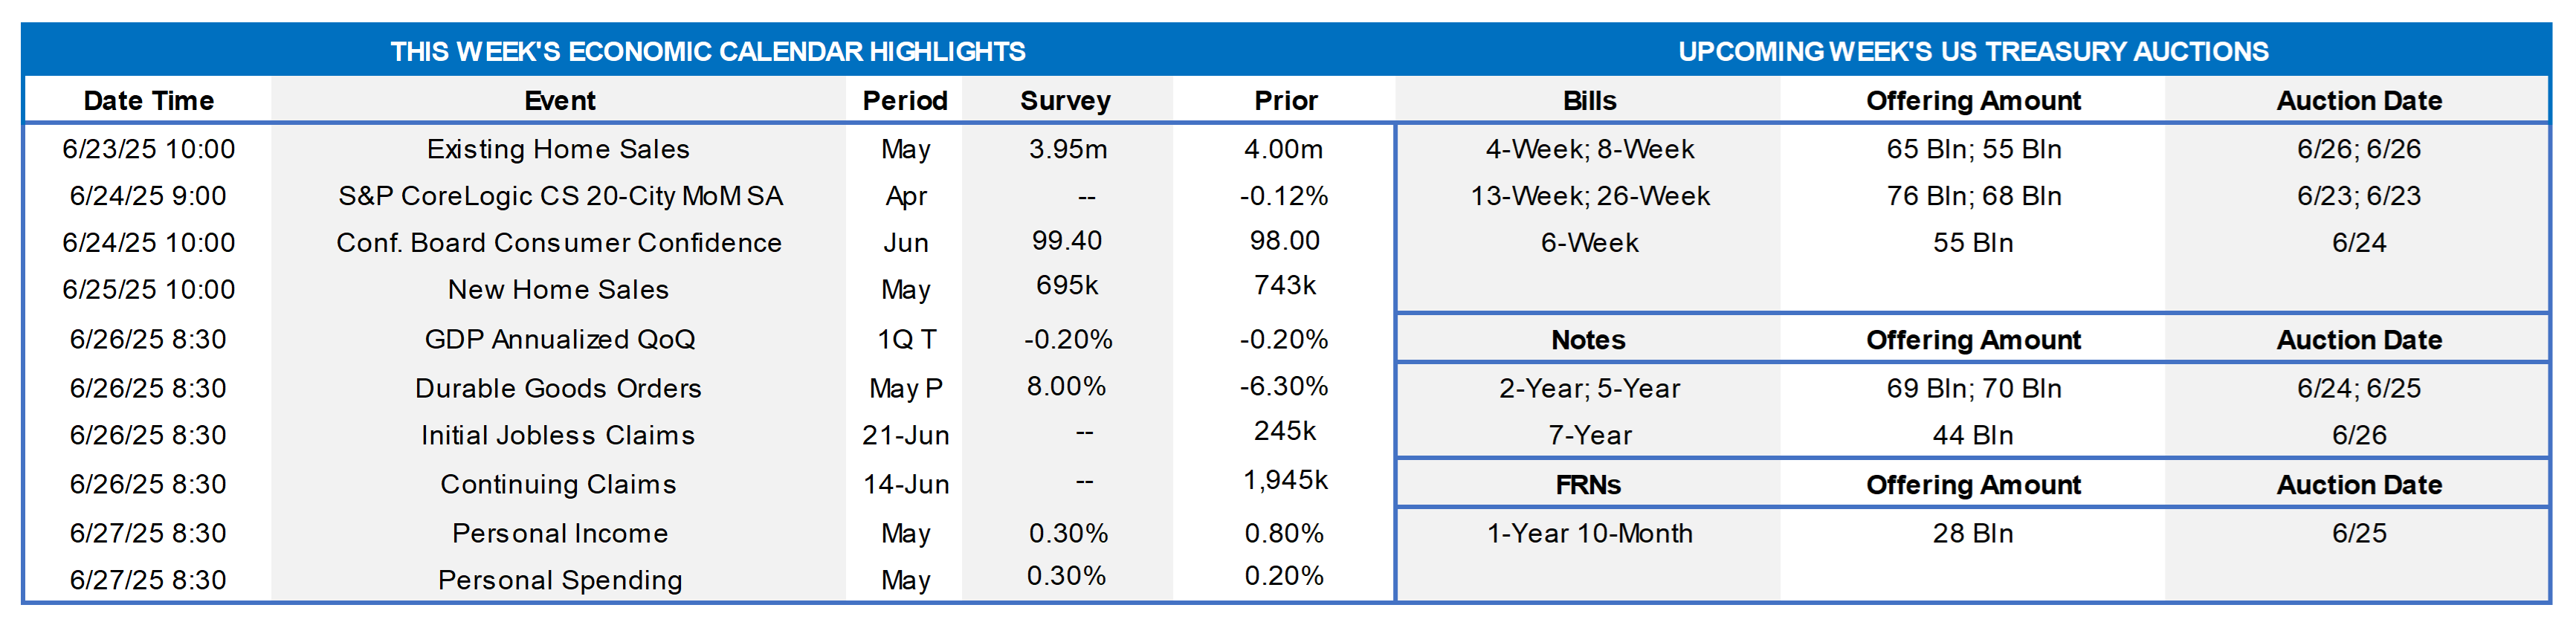
Having weathered the outcome of the latest FOMC meeting, market participants will contend with a crowded data calendar in the upcoming week. Both new and existing home sales likely retreated in May, while home-purchase prices ticked higher in April. Responding to perceived progress on the tariff front, closely followed by consumer sentiment gauges, probably jumped in June. Consumer inflation soundings in the upcoming report on personal income and spending in May are expected to be benign. A steady stream of Federal Reserve officials will speak this week. Thursday’s trade data is expected to reveal the deficit to have risen to $90.5bn in May from the $87bn shortfall posted in April.
Existing Home Sales: The pullback in home-purchase contract signings over the March-April span suggests that existing home sales slipped by 1.5% to a SAAR of 3.94mn in May. With the number of available homes on the market likely to jump by 6.9% to a five-year high of 1.55mn in the period, the supply at the estimated sales pace would edge three ticks higher to 4.7 months.
S&P CoreLogic Case-Shiller (SPCLCS) 20-City Home Price Index: Home prices probably rose modestly in April across the major metro areas, edging just .1% higher and reversing the .1% dip witnessed in March. If that projection is true, the barometer rose by 3.9% over the latest 12 months, eclipsing by a wide margin the reported 1.4% rise in consumer prices excluding shelter costs over that span.
Conference Board Consumer Confidence: Soundings from the University of Michigan suggest that this gauge rose sharply once again in June, leaping by 18.5 points to a nearly four-year high of 116.5. As always, pay attention to the labor differential – the percentage of respondents believing that jobs are plentiful, less than those feeling positions are hard to get – for clues to any potential change in the civilian unemployment rate in the upcoming Bureau of Labor Statistics’ report.
New Home Sales: The weather-related pullback in single-family building permits witnessed in May suggests that this tally fell by 6.5% to a SAAR of 695K, reversing two-thirds of April’s reported gain.
Jobless Claims: Initial claims, which have been moving higher over the previous four weeks, likely topped 250K during the filing period ended June 21 – the first such occurrence since last October. The total number of persons receiving regular state benefits probably registered near 1.95mn again, implying that recent job losers are having a slightly more difficult time finding work.
Real GDP Growth: The Bureau of Economic Analysis’ final stab at Q1 real GDP growth likely will be unaltered from the 0.2% annualized contraction posted in the preliminary report.
Durable Goods Orders: Powered by a commercial jet requisition, orders probably jumped by 11.7% in May – the largest one-month gain in five years. Net of the transport sector, “hard” goods orders likely edged .1% higher, after a .2% prior-month increase. Pay attention to nondefense capital goods shipments and fewer aircraft for clues to the pace of business equipment spending during Q2.
Pending Home Sales: Home purchase mortgage applications suggest that contract signings likely climbed by 1.7% in May, reversing a portion of the surprising 6.3% drop witnessed in April.
Personal Income & Spending: Both expected to have climbed by .3% in May. Echoing the BLS’ CPI report, closely followed PCE inflation gauges likely remained subdued last month.
- Federal Reserve (partial list)
- June 23 Chicago Fed President Goolsbee to speak at the Milwaukee Business Journal Mid-Year Outlook 2025.
- June 24 Fed Chair Powell to deliver the Semi-Annual Monetary Policy Report to the House Financial Services Committee.
- June 24 New York Fed President Williams to give keynote remarks at the Center for Economic Growth and NY CREATES.
- June 26 Cleveland Fed President Hammack to give opening remarks at a conference focused on housing.
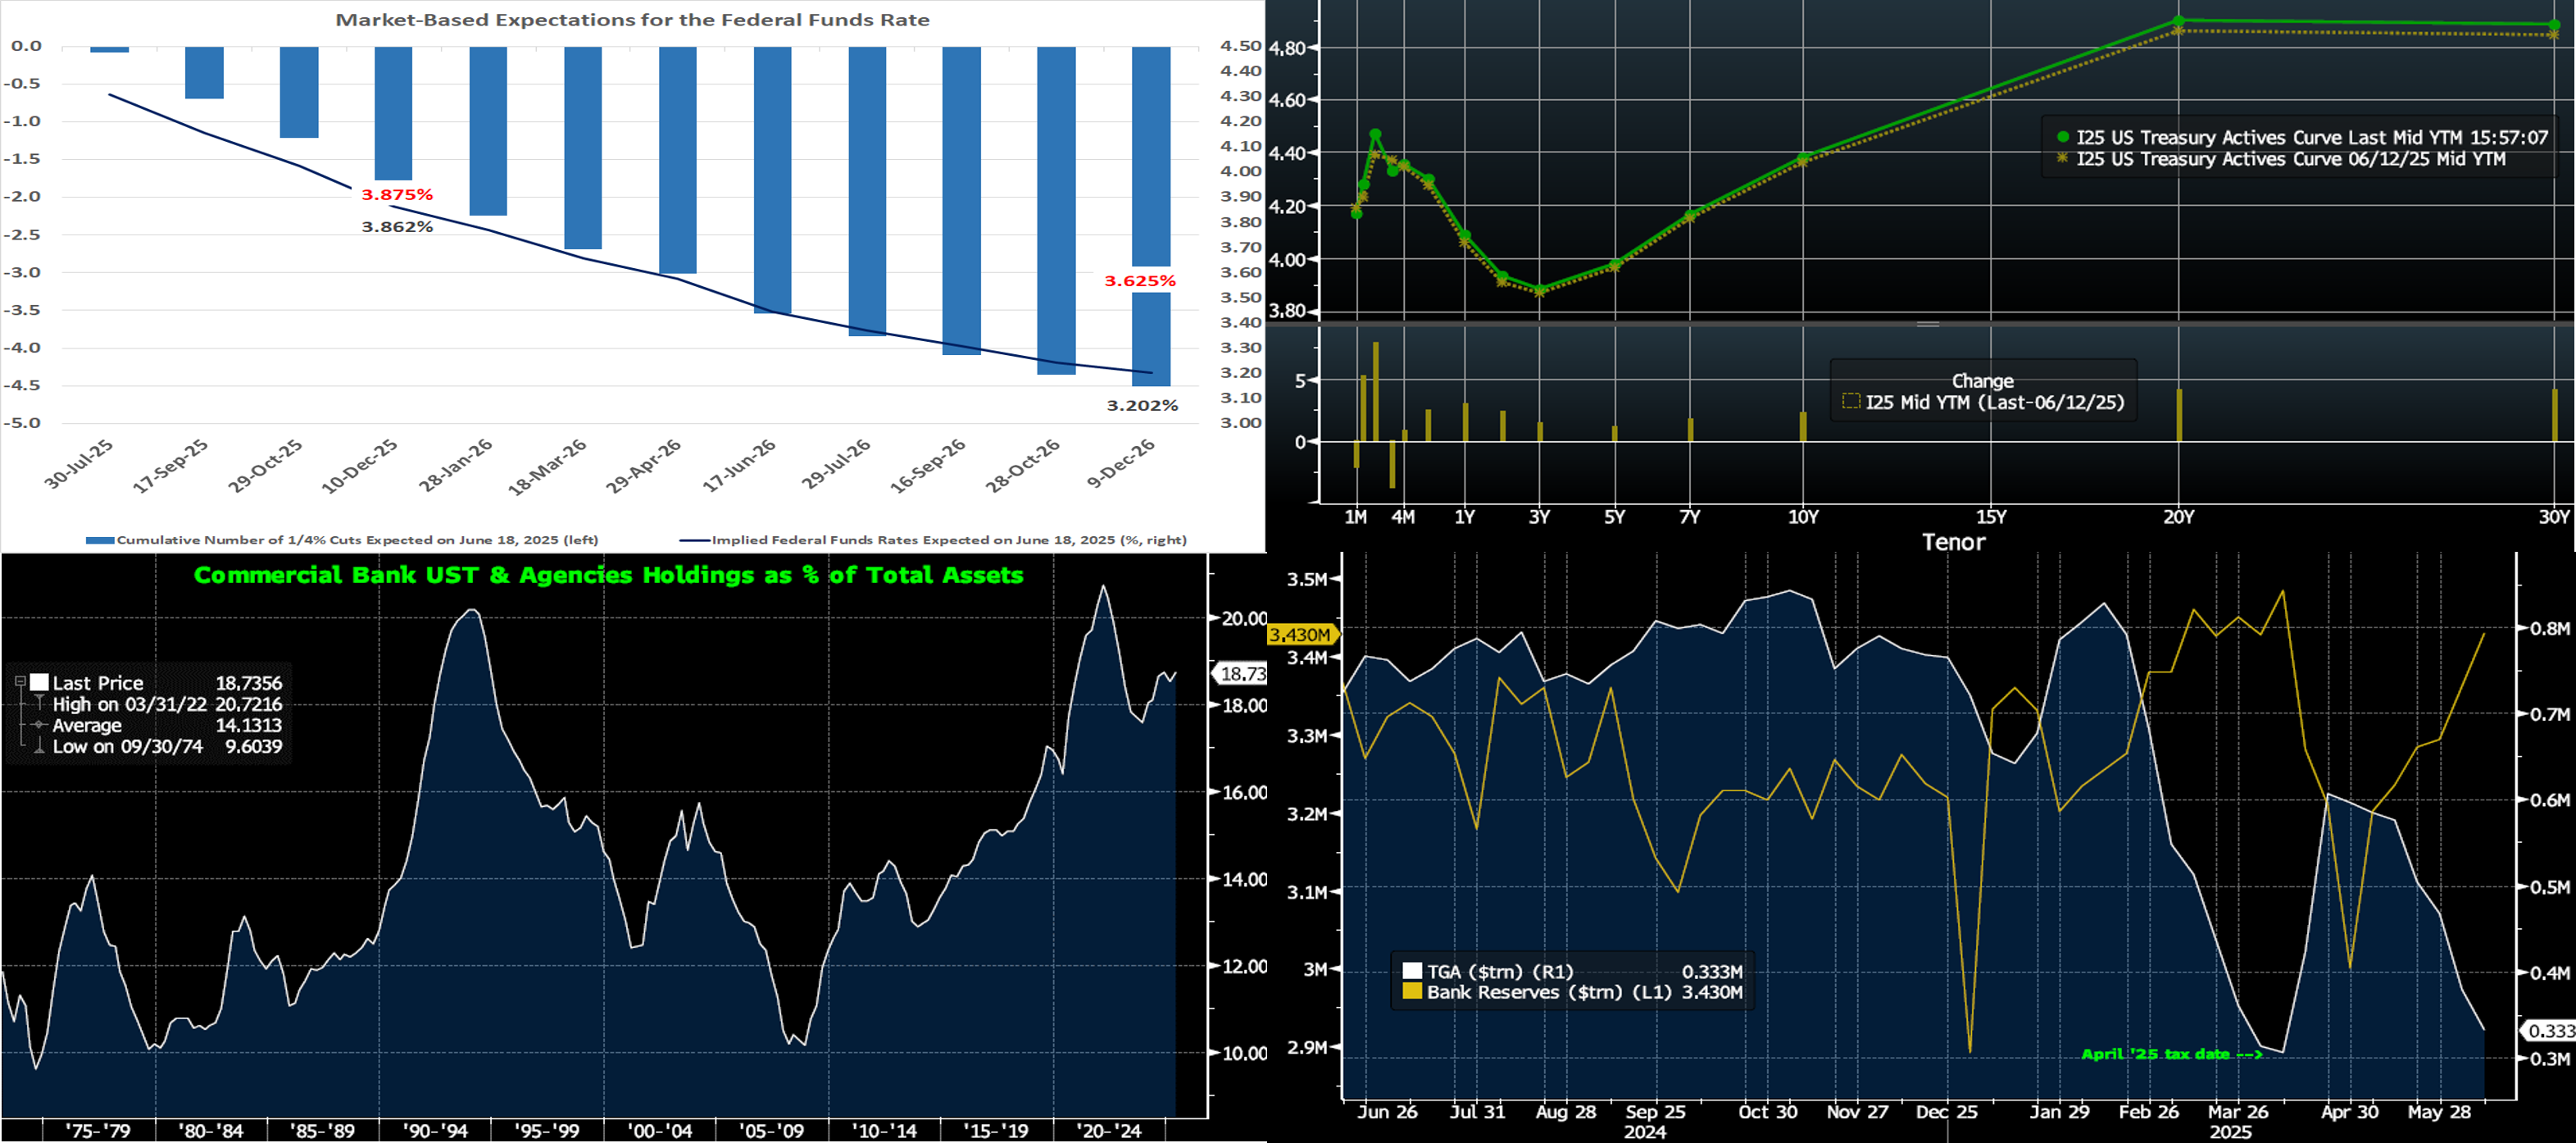
CHART 1 UPPER LEFT Sources: Board of Governors Federal Reserve Board; Bloomberg; FHLB-NY. Per convention following this past week’s FOMC, the Fed issued an updated Summary of Economic Projections (SEP) containing projections for key economic variables and the fed funds rate out to 2027 and over the longer run. The so-called “dot plot” of policymakers’ fed funds rate projections through 2027 contained several changes. Officials continue to expect that 50 bps of cuts likely will be appropriate this year, leaving the year-end target range at 3¾% to 4%. However, seven officials now see no changes over the remainder of this year, up from four in the March SEP. The updated SEP for yearend 2026 now calls for just one 25-bps reduction to 3½% to 3¾% as opposed to two in the March dot plot. Fed officials anticipate a final quarter-point cut in 2027, thereby leaving the target range at 3¼% to 3½%. The longer-run rate projection was unchanged at 3%. As seen here, as of late Wednesday, market pricing for this year aligns with policymakers’ dots (in red font), but the market is much more aggressive in their pricing for 2026, anticipating two to three 25 bps cuts.
CHART 2 UPPER RIGHT Sources: Bloomberg. Top pane is yield (LHS, %); bottom pane is change (LHS, bps). At Wednesday’s close in the holiday-shortened week, the UST term curve was modestly changed from last Thursday’s close, with most tenors a few bps higher. The “no change as expected” FOMC communique reiterated that while swings in net exports have impacted recent data, activity has continued to expand at a solid pace. It again noted that the unemployment rate remains low and labor market conditions solid, although inflation remains somewhat elevated. The FOMC highlighted that uncertainty about the economic outlook has diminished but remains elevated. The Fed, meanwhile, will continue to reduce its holdings of USTs and agency debt and agency MBS. To date, runoffs of maturing securities have pared the System Open Market Account to $6.4trn from the $8.5trn peak reached in April 2022. As of late Wednesday afternoon, the market prices end-2025 fed funds at 3.86%, or ~4 bps higher than a week ago. The market’s end-2026 forward is ~3.20%, or 1 bps lower than a week ago.
CHART 3 LOWER LEFT Sources: Bloomberg. News hit the tape this week that top US bank regulators plan to reduce a key capital buffer, namely the Enhanced Supplemental Leverage Ratio (ESLR), by 1.5 percentage points in an effort ease potential trading and ownership constraints in the UST market. The Fed plans to meet on June 25th to review the plan, and there may be a public comment period before any concrete action. While this development is more “big bank”-oriented, it could have broader implications for the UST and rates markets. Having said that, however, markets have been anticipating an easing of capital constraints, and so the reaction thus far has been muted. Also, as seen here, US commercial bank ownership of UST and Agency securities (RHS, %) is already relatively high on a historical basis. Its prior peak in 2022 was during the pandemic and its backdrop of high liquidity and lower loan levels. In this light, the impact on markets and rate levels may prove marginal, all else equal.
CHART 4 LOWER RIGHT Sources: Bloomberg. A topic to place on the radar for the upcoming months is that of the debt ceiling, the Treasury General Account (TGA), T-bill issuance, and US bank reserves. Shown here is the TGA (white, RHS, $trn) and bank reserves (gold, LHS, $trn). Owing to debt ceiling constraints and consequent negative net T-bill issuance, the TGA has been drawn down thus far in 2025, although it spiked briefly after the mid-April tax date. In turn, bank reserves have risen, as this TGA drawdown instills funds to the financial system. But market strategists expect these dynamics to change as the year progresses, as T-bill issuance is expected to turn net positive later in the summer especially in the event of a debt ceiling resolution. In turn, T-bill rates and our paper too could experience some relative upward pressure. Meanwhile, bank reserves and deposit levels could experience downward pressure as the transition plays out.
FHLBNY Advance Rates Observations
Front-End Rates
- As of Wednesday midday, short-end rates were unchanged to higher vs. last Thursday. The 2-week-and-in sector was higher by 2 to 6 bps, with Overnight leading the move, as some tightness in the shorter end of the money markets curve exerted upward pressure. The 1- to 3-month zone was unchanged to a bp higher, while the 4- to 6-month sector rose by 2 bps. Money Market Fund AUM levels have continued to underpin demand for short-end paper, thereby generally benefiting our funding spreads. Also helpful is that net T-bill supply is expected to remain modestly negative in the next few weeks, owing to debt ceiling dynamics, although this net supply dynamic is expected to change as summer rolls on (see previous section for context).
- Along with geopolitical and trade policy developments, the market’s focus will steer towards a heavier slate of economic data in the week ahead.
Term Rates
- The longer-term curve, as of Wednesday close and generally mirroring the modest moves in USTs and swaps, was 1 to 4 bps higher from last Thursday’s close. Kindly refer to the previous section for color on market dynamics and changes.
- On the UST term supply front, the upcoming week serves a slate of 2/5/7-year auctions. Note that UST auctions usually occur at 1pm and can occasionally spur volatility around that time. Please contact the Member Services Desk for further information on market dynamics, rate levels, or products.
Reminder: FHLBNY’s 0% Development Advance (ZDA) program is open and running – This program provides members with subsidized funding in the form of interest-rate credits to assist in originating fixed-rate loans or purchasing loans/investments that meet one of the eligibility criteria under the Business Development Advance, Climate Development Advance, Infrastructure Development Advance, Tribal Development Advance, or the new Housing Development Advance. Members can apply for interest rate credits up to $250,000. Please contact Member Services Desk to learn more and check out our ZDA page.
Price Incentives for Advances Executed Before Noon: In effect as of Tuesday, September 5, 2023, the FHLBNY is pleased to now offer price incentives for advances executed before Noon each business day. These pricing incentives offer an opportunity to provide economic value to our members, while improving cash and liquidity management for the FHLBNY. For further details, kindly refer to the Bulletin.
Looking for more information on the above topics? We’d love to speak with you!
Archives
Questions?
If you wish to receive the MSD Weekly Market Update in .pdf format (includes FHLBNY rate charts) or to discuss this content further, please email the MSD Team.