Member Services Desk
Weekly Market Update
This MSD Weekly Market Update reflects information for the week of February 16, 2021
Economist Views
Click to expand the below image.
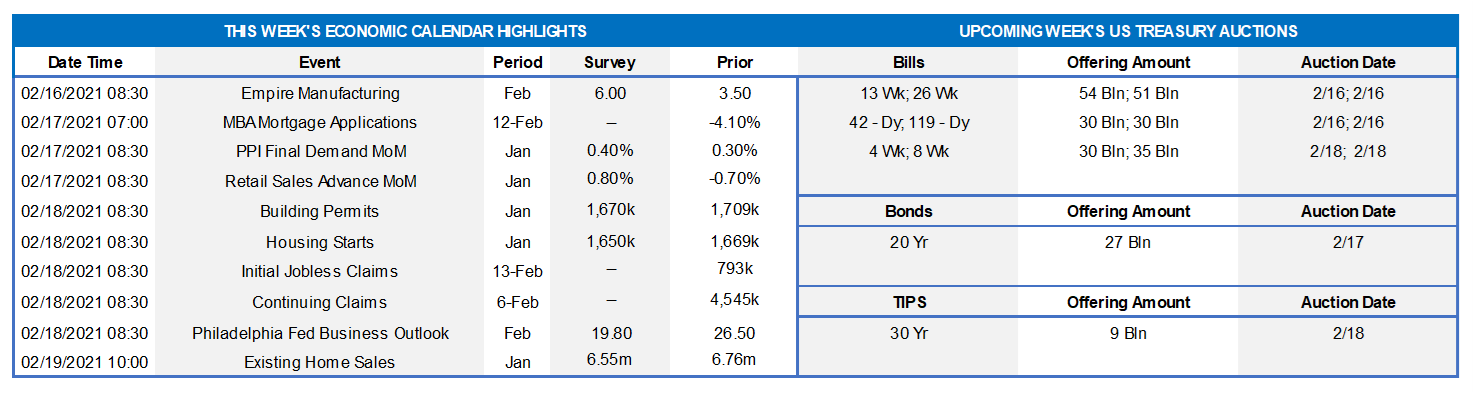
The attention of market participants will undoubtedly be focused on efforts to get the American Rescue Plan – the Biden administration’s $1.9trn fiscal stimulus package – through Congress in the upcoming holiday-shortened week. The economic release calendar will be crowded, due to the Presidents’ Day holiday. Retail sales are expected to have snapped back in January, reversing a portion of the fall-quarter decline. Soundings from the housing sector in January and February likely will remain solid, supporting the view that homebuilding will provide another boost to current-quarter real GDP growth. A trio of Federal Reserve officials will make public appearances on a variety of topics.
Empire State Manufacturing Survey: The expansion in manufacturing activity in New York State probably entered its eighth month in February, with the net percentage of firms experiencing an improvement in general business conditions likely to improve on January’s 3.5% reading.
Retail & Food Services Sales: Retail sales likely started the New Year on a high note. The consensus anticipates a 1.0% jump in revenues in January, following a cumulative 2.1% decline over the final three months of 2020. Pay attention to control sales excluding auto, building materials, and gasoline purchases in the upcoming report for clues to the strength of current-quarter consumer spending. Barring any prior-month revisions, the .9% gain expected by the Street leave January’s core purchases 3.4% annualized below their October-December average.
Industrial Production: Output at the nation’s factories, mines, and utilities probably edged .4% higher in January, boosting the cumulative gain since September to 3.5%. That projection, if realized, would place industrial production within three percentage points of its pre-pandemic level. With output expected to eclipse additions to productive capacity at the beginning of the New Year, the capacity utilization rate likely moved three ticks higher to 74.8% – the highest reading since February.
NAHB Housing Market Index: Homebuilders’ appraisals of market conditions likely remained at a very lofty level this month, following the 83% reading recorded in January. February would mark the ninth straight month above the barometer’s 50% breakeven level.
Housing Starts & Building Permits: The mild weather conditions experienced across the country last month hint that groundbreakings and permit applications may have risen, in contrast to Street calls for modest declines. Residential investment remains a bright spot in the economic outlook and likely will produce another positive contribution to real GDP growth in the current quarter.
Existing Home Sales: Recent pullbacks in home-purchase contract signings suggest that existing home sales dipped by 1.3% to a four-month low seasonally adjusted annual rate of 6.67mn in January, yet remained a whopping 23% above the 5.42mn closings witnessed at the beginning of 2020. With the number of dwellings available for sale expected to be little changed from December’s 1.07mn, the months’ supply inventory gauge probably remained at a record low 1.9 months.
Federal Reserve:
Feb 17: Boston Fed President Rosengren to take part in a virtual panel discussion hosted by the Concord Coalition.
Feb 17: Minutes of January 26-27 FOMC meeting to be released.
Feb 18: Federal Reserve Governor Brainard to speak at a climate finance conference hosted by the IIF.
Feb 18: Atlanta Fed Bostic to take part in a virtual discussion on educational inequality.
Feb 19: Boston Fed President Rosengren to give a virtual speech to the Yale Economics Development Symposium.
Click to expand the below images.
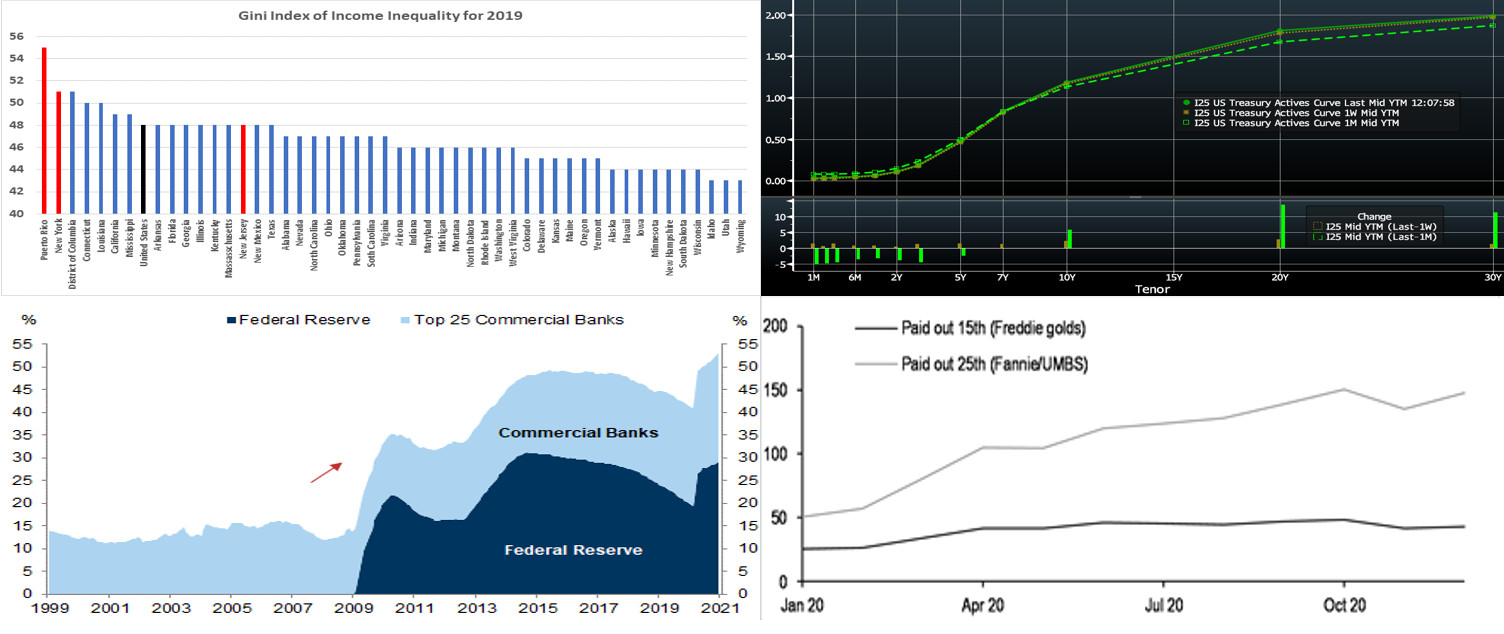
Source: U.S. Census Bureau, FHLB-NY. Income inequality varies across the U.S. and FHLB-NY district. The Gini Index is a measure of the distribution of income across a population, developed by the Italian statistician Corrado Gini in 1912. A value of 0 indicates perfect equality, while a value of 100 indicates perfect inequality. It is often used as a gauge of economic inequality, measuring income distribution or, less commonly, wealth distribution among a population. The latest data available for 2019 reveal that income inequality was widest in Puerto Rico, followed by New York State. New Jersey’s reading was in line with the nationwide average. The pandemic of this past year has certainly spurred greater inequality, and the Fed has invoked this condition as a source of concern/focus and a reason to “stay the course” on rates and asset purchases.
CHART 2 – UPPER RIGHT
Source: Bloomberg. In a range-trade type of week, the UST curve mildly steepened week-over-week, with shorter maturities essentially unchanged but maturities 5-year and out higher in progressive fashion by 1 to 3 bps. The 2-year/10-year slope remains at its highest since April 2017. The Fed’s guidance and programs continue to pin shorter-end yields. The Covid-19 pandemic has improved further from the dire status of a month ago, and bolstered vaccination programs are proceeding apace. A further round of relief legislation remains “in the works”; the past week’s economic data is unlikely to derail the Administration’s push for a faster and larger package along with the attendant UST supply to finance it. These dynamics continue to support a steeper curve.
CHART 3 – LOWER LEFT
Source: eMBS, Fed, Goldman Sachs. Here is perspective on the sheer and massive scale of Fed and bank ownership of the MBS market. The Fed and the top-25 (asset size) U.S. commercial banks own over 50% of outstanding agency MBS. If not for the “hot” housing and mortgage market spurring increased production, this ownership share would surely be even larger. The Fed currently owns ~$2.06trn of agency MBS, and Fed Chairman Powell has termed a taper of its purchase program as premature at this juncture. Banks’ increasing ownership of MBS appears likely to continue but may moderate from its heady pace if loan growth begins to turn/increase from prevailing low levels. This large buying continues to provide a counter-force to the curve steepening pressures cited above.
CHART 4 – LOWER RIGHT
Source: Fannie Mae, Freddie Mac; JP Morgan. A technical change to cashflows in the MBS market has become more prominent. Depicted here is total Fannie Mae/Freddie Mac MBS monthly paydowns by payment date (in $bn). Historically, Freddie Mac (FHLMC) MBS paid on the 15th of the month and Fannie Mae (FNMA) on the 25th. UMBS (Uniform MBS), launched ~20-months ago, pay on the 25th. As the UMBS segment grows with new Freddie Mac production becoming UMBS, an increasing proportion of the MBS market’s P&I will occur on the 25th. This evolution can spur notable changes in cashflows, especially with high mortgage prepayment levels. And FNMA/FHLMC will generally have more funds invested in money markets in the days prior to the 25th.
FHLBNY Advance Rates Observations
Front-End Rates
Short-end Advance rates finished a bp higher through 2-month but otherwise unchanged, week-over-week. T-bill issuance was its usual market feature, but net supply has slowed and thereby allowed for easier market absorption. Money market funds’ AUM increased by ~$7.2bn this past week, thereby adding demand for short paper. From a bigger-picture vantage point, an overall moderation in market supply of short paper, in tandem with high cash levels in the market, is expected to keep short-end rates relatively steady and under downward pressure in the year’s first half.
Heavy T-Bill issuance will remain a theme; UST issuance overall is now net positive supply in that more is being issued than what the Fed is buying in its programs. However, with short UST rates at rock-bottom levels and the Fed on hold for a long period, rates are likely to persist in a near-term sideways to softer pattern. Importantly, weekly net T-bill issuance has been lower since last summer and even negative in recent months, and Treasury has announced plans to shift issuance out the curve. Even with a new relief package and related borrowing, these supply/demand and Treasury issuance dynamics should keep short rates in check on the upside. Indeed, short bills are approaching 0%.
Term Rates
On the week, medium and longer-term Advance rates were unchanged in the shorter tenors but 1-3 bps higher in progressive fashion past 4-year. Please refer to the previous section for further color on relevant market dynamics.
On the UST supply front, next week brings just a 20-year in nominal UST auctions. Focus this holiday-shortened week will revolve around Covid-19 and fiscal legislation developments.
New Product Alert: In order to satisfy member needs and provide greater product flexibility to match bond and derivative market conventions, FHLB-NY now offers SOFR-linked advances based on SOFR-index compounding. Note that this product is in addition to SOFR-linked advances based on SOFR-index averaging which have been offered since November 2018.
The Symmetrical Prepayment Advance Feature
With rates at or near multi-year lows, it is a compelling juncture to use the SPA feature on term advances. This feature allows member to capture, at prepayment, changes in the Fair Value of the advance which are favorable to the member. Contact us to discuss.
Looking for more information on the above topics? We’d love to speak with you!
Questions?
If you wish to receive the MSD Weekly Market Update in .pdf format (includes FHLBNY rate charts) or to discuss this content further, please email the
MSD Team.
Special Member Alert
The FHLBNY recently announced a newly expanded and flexible Disaster Relief Funding (DRF) advance program which offers discounted rate advances with maturities 1-mo and greater. Additionally, we have announced that PPP loans will be accepted as eligible collateral. Please contact us with any questions.