Member Services Desk
Weekly Market Update
This MSD Weekly Market Update reflects information for the week ending February 16, 2024.
Economist Views
Click to expand the below image.
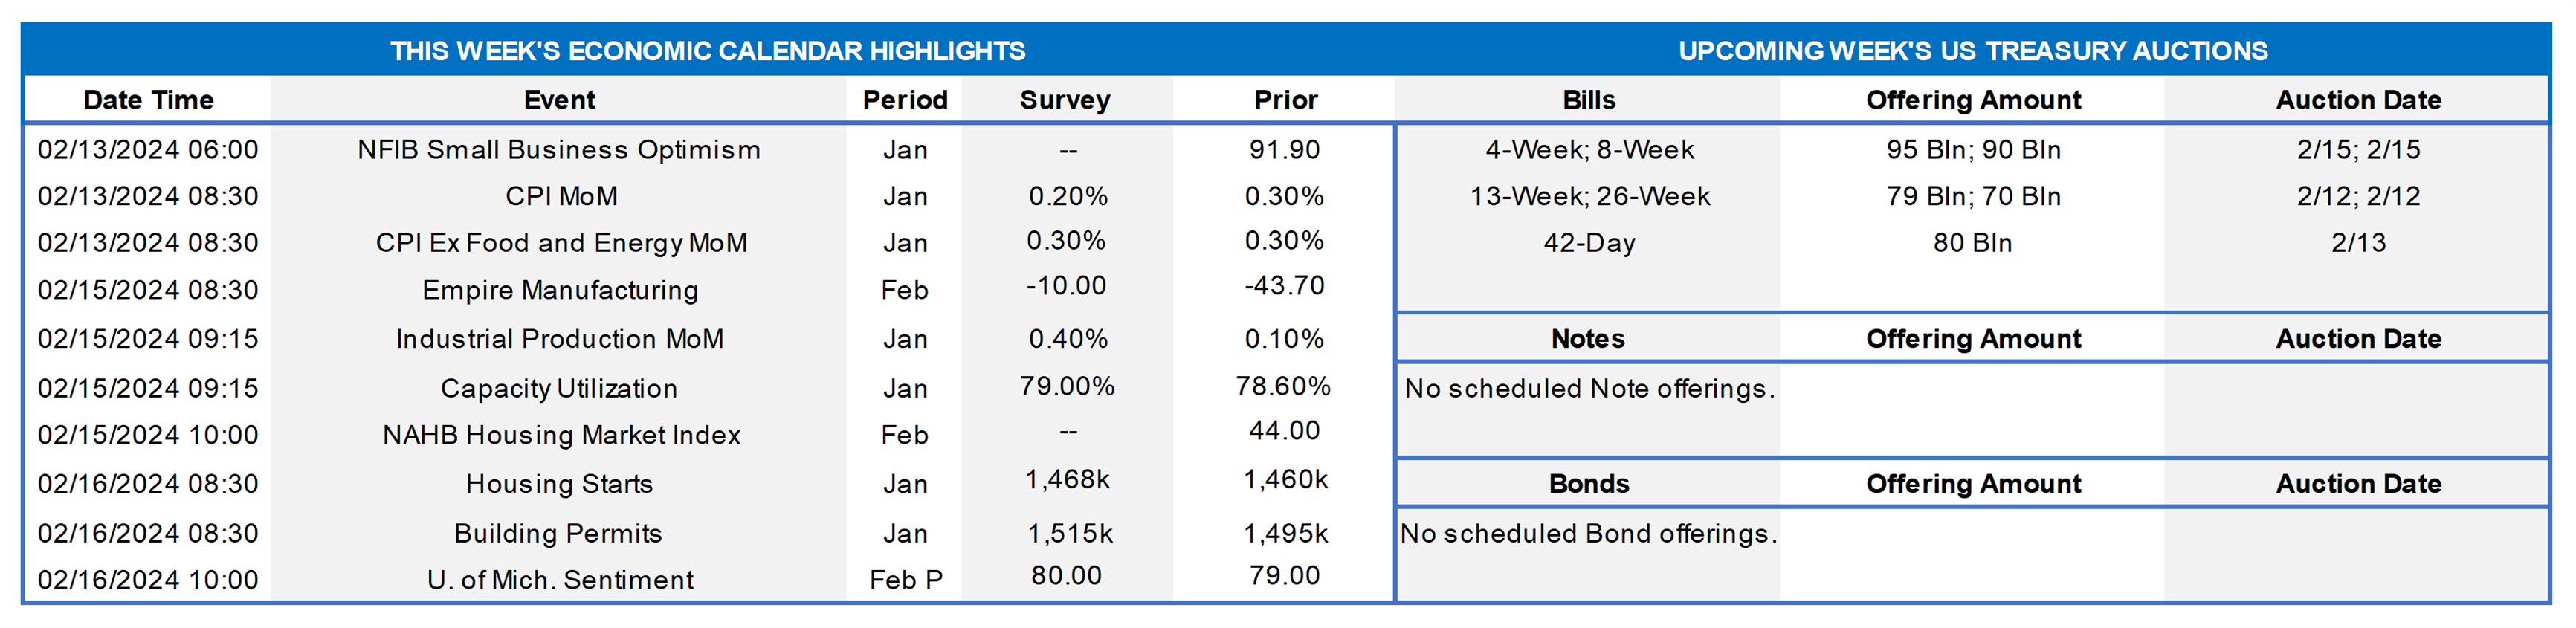
Returning from the Presidents Day holiday, market participants will face an extremely quiet economic release calendar. The continuing decline in the Conference Board’s Index of Leading Economic Indicators is expected to have moved one month closer to its two-year anniversary in January. Initial claims for unemployment insurance probably remained historically low during the reference period for the February employment situation report. Existing home sales likely rebounded at the beginning of the New Year. A quartet of Federal Reserve officials, including three current FOMC voters, are slated to give their thoughts on a variety of topics. The minutes from monetary policymakers’ late-January meeting may shed some light on interest-rate prospects beyond the so-called “dot plot” from the December FOMC meeting.
Index of Leading Economic Indicators: The Conference Board’s augur of prospective economic activity is expected to have fallen by .3% in January. While that result would mark the 22nd consecutive decline in the LEI, the economy has shown few signs of faltering. Indeed, the Federal Reserve Bank of St. Louis’ smoothed recession probabilities model placed the probability that the economy was contracting in December at a negligible .7%.
Jobless Claims: Initial claims for unemployment insurance benefits likely remained in a 210K-230K range during the filing period ended February 17. Keep an eye on continuing claims filed during the week ended February 10 for any signs that recently furloughed employees are having a more challenging time finding work.
Existing Home Sales: A surge in home-purchase contract signings in December suggests that closings nationwide jumped by 4.5% to a four-month high seasonally adjusted annual rate of 3.95mn in January. With the number of available homes on the market likely to climb by 2% to 1.02mn on a not seasonally adjusted basis during the reference period, the supply at the estimated sales pace would decline to 3.1 months – the lowest level since June.
Federal Reserve Appearances:
- Feb. 21 Atlanta Fed President Bostic to give welcoming remarks at the Airports Council International CFO Summit in Atlanta.
- Feb. 21 Federal Reserve to release minutes from January 30-31 FOMC meeting.
- Feb. 21 Federal Reserve Vice Chair Jefferson to give remarks at a Peterson Institute for International Economics event.
- Feb. 22 Fed Governor Cook to deliver keynote address at a Princeton conference on “Macrofinance in the Long Run.”
- Feb. 22 Minneapolis Fed Pres Kashkari to participate in a panel discussion focused on economic trends and the outlook.
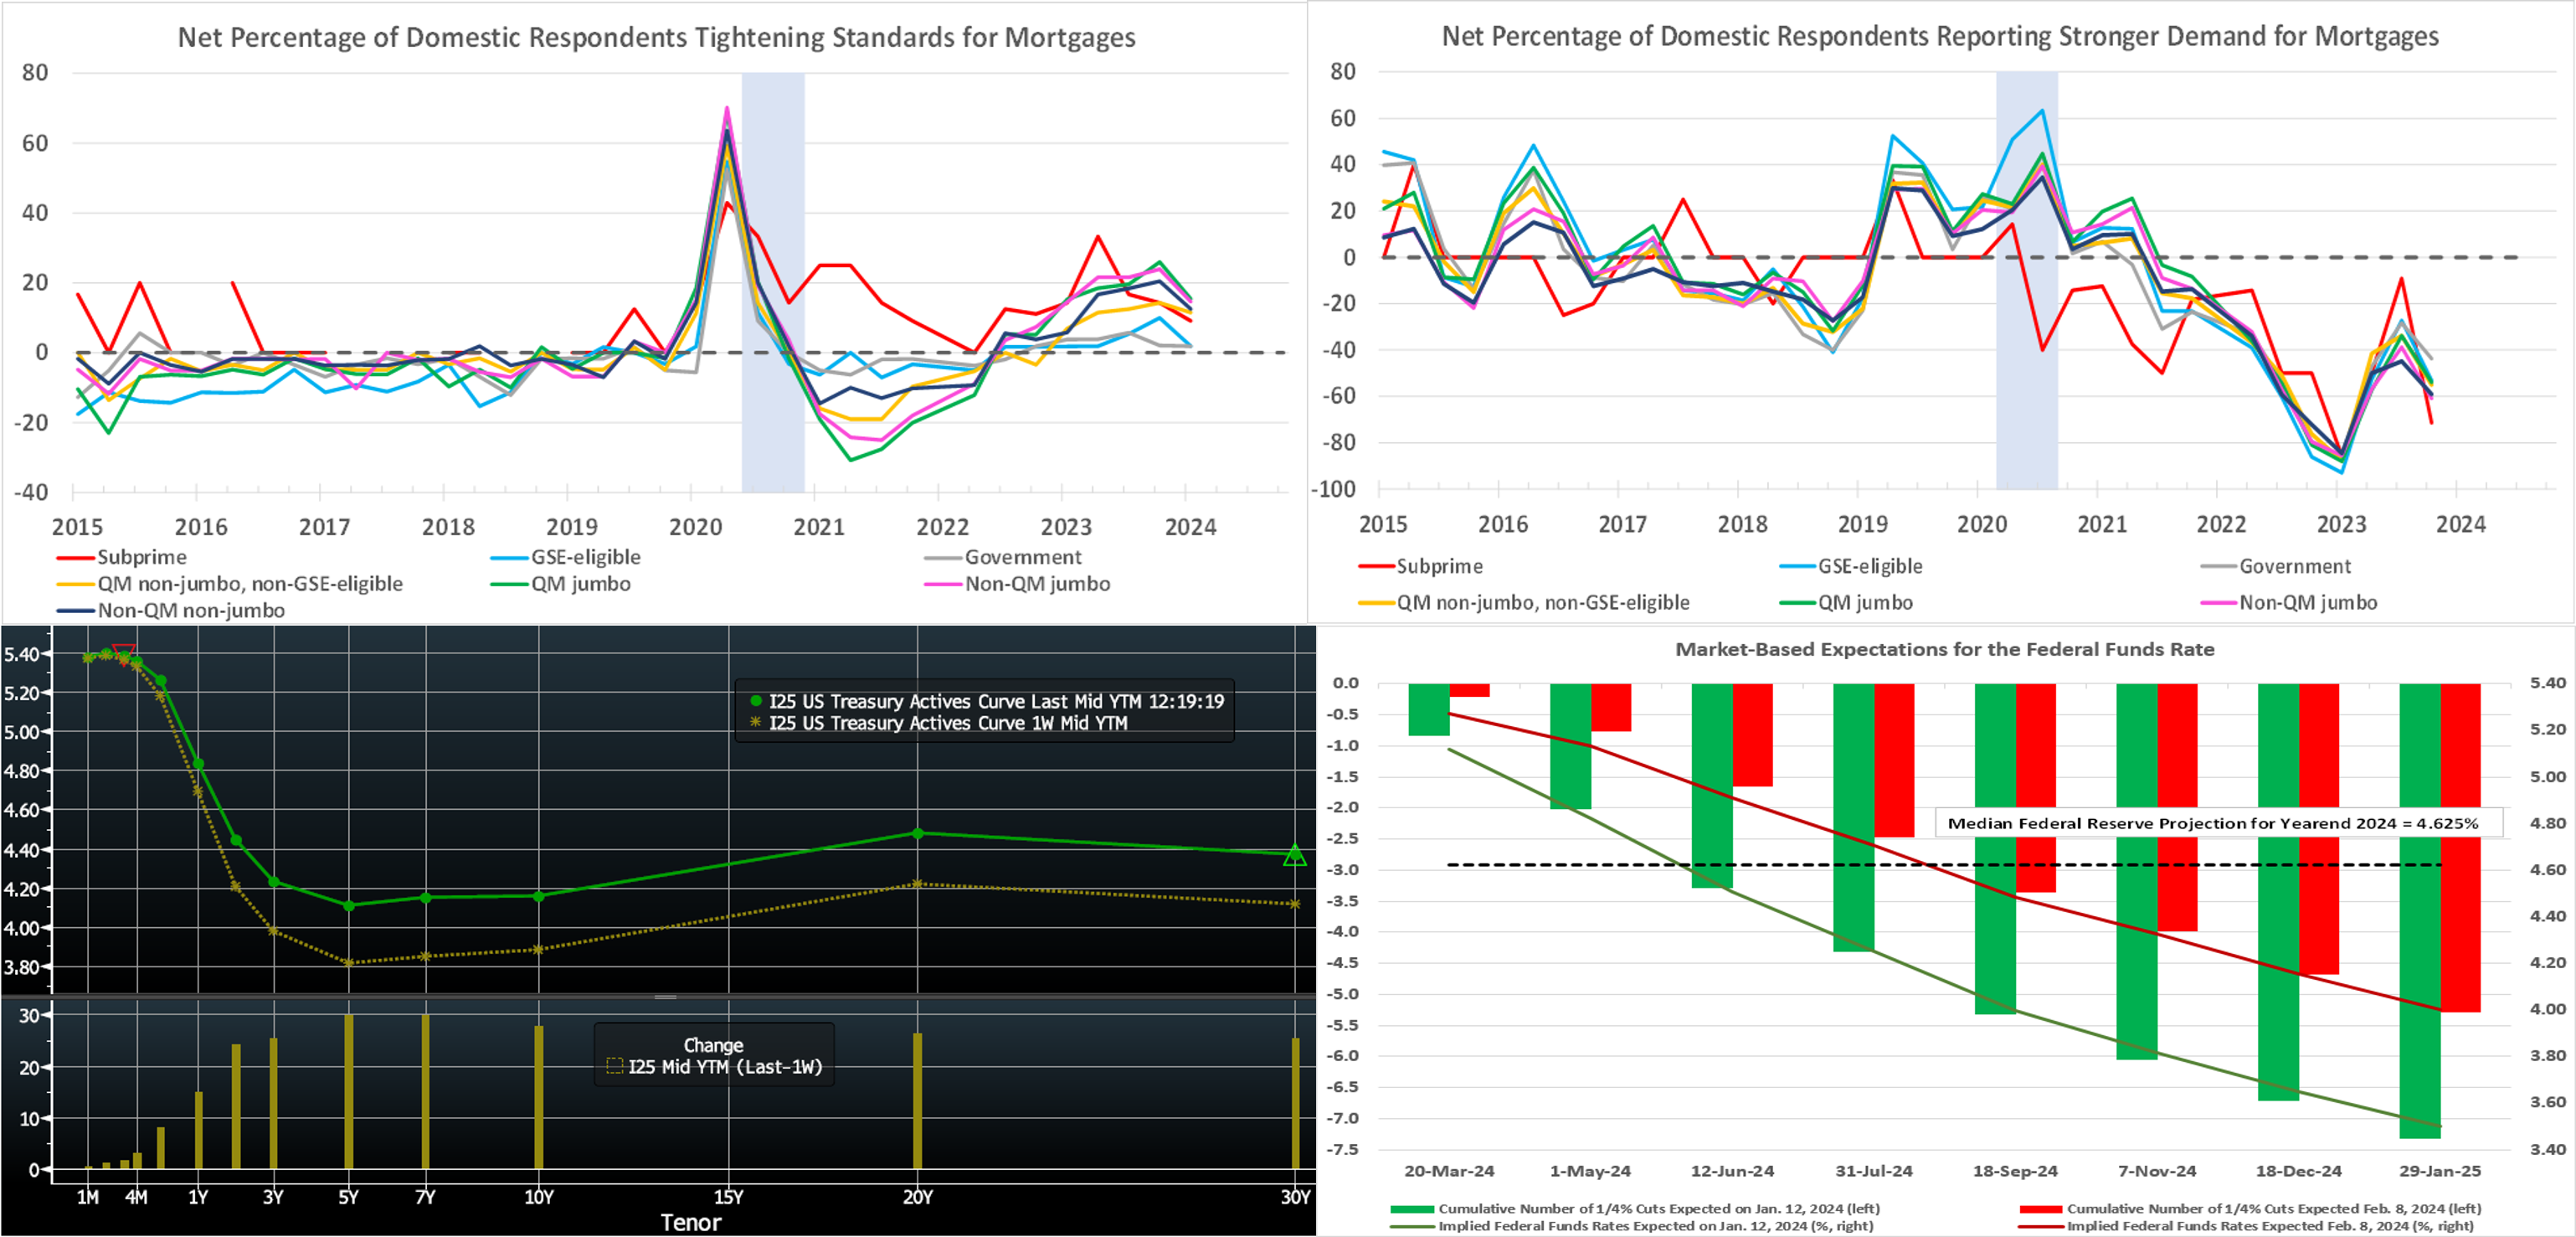
CHART 1 UPPER LEFT
Source: Bureau of Labor Statistics; FHLB-NY. The BLS update on consumer prices in January was disappointing. Accelerations in nonenergy services costs and retail food prices propelled the overall and core CPIs .3% and .4%, respectively, higher last month, both exceeding economists’ median forecasts. All but a fraction of the 3.1% rise in consumer prices since the beginning of last year has been attributable to increased nonenergy services costs, primarily those for shelter and motor vehicle insurance. By contrast, energy product and core commodities costs have been modest drags on consumer inflation since January 2022.
CHART 2 UPPER RIGHT
Source: Bloomberg. Top pane is yield (LHS, %), bottom pane is change (LHS, bps). From last Thursday afternoon to this one, the UST curve rose ~7 to 12 bps, with the 2- to 5-year sector leading the way. The main protagonist for the move was Tuesday’s higher-than-anticipated CPI report (details above) which instantly propelled yields higher. Subsequently, yields recovered from the highest levels of the week. Thursday’s weaker-than-expected retail sales report helped in this regard. In terms of market-implied pricing of the Fed, the chance of a 25 bps cut in March is ~7%, down from ~17% a week ago. The year-end 2024 forward is ~4.36%, roughly 21 bps higher than last Thursday. The market prices for a cumulative total of ~98 bps of cuts by the end of 2024, compared to ~118 bps a week ago. The upcoming holiday-shortened week is bereft of high-profile data, but the market will focus on the limited releases and any Fedspeak of note.
CHART 3 LOWER LEFT
Source: Bloomberg; FHLB-NY. Given the market’s further recalibration of Fed policy, we revisit this chart of forward rates. Shown here is current pricing (Red, LHS is number of 25 bps cuts, RHS %) vs. that of just over a month ago (Green) when the market was at its most exuberant in pricing near-term rate cuts. Stronger-than-expected data and “we’re in no rush to ease” Fedspeak have pushed the market to notably dial back its expectations of rate cuts. The chance of a cut in March is now minimal at ~7%. For the year 2024, the market prices ~98 bps of cumulative cuts, which is ~70bps less than a month ago. As can be seen here, the market’s year-end projection has approached, at now ~27 bps below, the Fed’s year-end 2024 projection from its December “dot plot.”
CHART 4 LOWER RIGHT
Source: Bloomberg. Shown here is the Citibank Economic Surprise Index (White, RHS), a measure of data surprises relative to market consensus expectations vs. the UST 5-year yield (Green, LHS, %). As is evident in the downward trending line, data releases in the last few months of 2023 were weaker than expectations. The UST yield declined in response as the market priced in more aggressive projections for Fed easing. But this trend has clearly reversed in the past month, as data has been stronger than consensus; the latest jobs and CPI reports stand out as prime examples. In turn, yields have moved higher, and the market has recalibrated its Fed-easing expectations, as detailed above. The market and Fed are surely in a data-dependent mode at this stage.
FHLBNY Advance Rates Observations
Front-End Rates
- Short-end rates were mixed week-over-week, with shorter tenors mostly unchanged but the 4- to 6-month sector 2 to 4 bps higher. The longer maturities rose in tandem with the market’s repricing higher Fed policy on rates. Net T-bill supply remains positive, given announcements from the Treasury regarding upsized auctions and issuance needs. But the supply continues to be absorbed well as Money Market Funds (MMFs) switch from the Fed’s RRP to T-bills with competitive yields. Moreover, MMFs continue to grow and currently stand at or near all-time high AUM levels.
- In a holiday-shortened week devoid of high-profile data, the markets will continue to monitor Fedspeak as well as the FOMC Minutes release.
Term Rates
- The longer-term curve, generally mirroring moves in USTs and swaps, moved ~7 to 12 bps higher week-on-week. The 2- to 5-year sector led the move. Please refer to the previous section for color.
- On the UST term supply front, the upcoming week serves a 20-year nominal and a 30-year TIPS auction. Note that UST auctions usually occur at 1pm and can occasionally cause volatility around that time. Please contact the Member Services Desk for further information on market dynamics, rate levels, or products.
Grant funding under the FHLBNY 2023 Small Business Recovery Grant (SBRG) Program has begun and some funds are still available. The SBRG Program provides grant funds to benefit FHLB-NY members’ small business and non-profit customers. Please visit the SBRG webpage.
Price Incentives for Advances Executed Before Noon: In effect as of Tuesday, September 5, 2023, the FHLBNY is pleased to now offer price incentives for advances executed before Noon each business day. These pricing incentives offer an opportunity to provide economic value to our members, while improving cash and liquidity management for the FHLBNY. For further details, kindly refer to the Bulletin.
The Symmetrical Prepayment Advance Feature
For those anticipating term funding needs, and with rates on an uptrend, it can be an appropriate juncture to consider our SPA feature. This feature allows the member to capture, at prepayment, changes in the fair value of the advance which are favorable to the member. Contact Member Services Desk to discuss.
Looking for more information on the above topics? We’d love to speak with you!
Questions?
If you wish to receive the MSD Weekly Market Update in .pdf format (includes FHLBNY rate charts) or to discuss this content further, please email the MSD Team.