Member Services Desk
Weekly Market Update
This MSD Weekly Market Update reflects information for the week ending June 13, 2025.
Economist Views
Click to expand the below image.
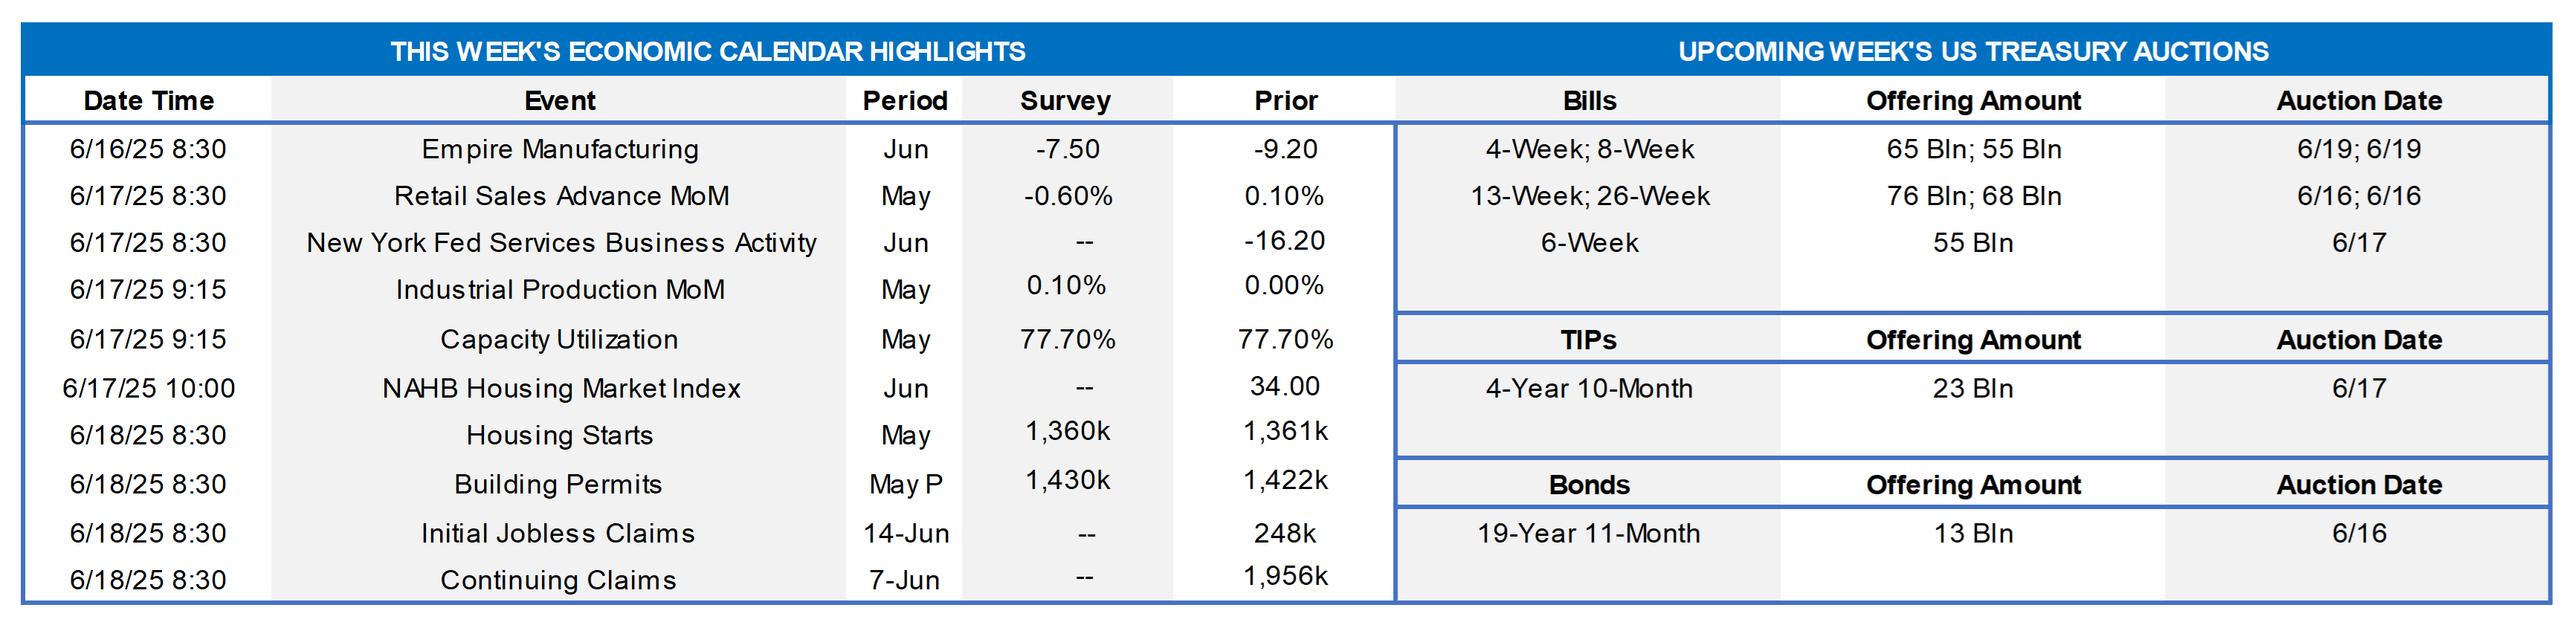
The June 18th Federal Open Market Committee (FOMC) meeting outcome will be the marquee event this coming week. The FOMC is universally expected to leave the federal funds rate target range unaltered at 4¼% to 4½%. The post-meeting communiqué likely will reiterate that while swings in net exports have impacted recent data, economic activity has continued to expand at a solid pace. Policymakers probably will note once again that the unemployment rate has stabilized at a low level in recent months, labor market conditions remain solid, but inflation remains somewhat elevated. The FOMC may repeat that uncertainty about the economic outlook remains high and that the risks of higher unemployment and higher inflation, or stagflation, are elevated. The FOMC will continue to its holdings of UST and agency debt and agency MBS. To date, runoffs of maturing securities have pared the System Open Market Account to $6.4trn from the $8.5trn peak reached in April 2022.
The Fed will issue an updated Summary of Economic Projections, or SEP, aka “dot plot”, containing projections for key economic variables and the federal funds rate out to 2027 and over the longer run. In March, Fed officials expected that 50 bps of cuts might be appropriate over the course of 2025, followed by another 50 bps of easing in 2026. A single 25-bps cut was expected during 2027. The market is now pricing for slightly more than two 25-bps cuts in 2025. Data released since the March FOMC meeting suggest that policymakers’ median projections for real GDP growth and the overall PCE chain price index in 2025 are both too high and could be moved closer to 1% and 2%, respectively, in the upcoming report.
Empire State Manufacturing Survey: Manufacturing in NYS likely contracted for a fourth straight month in June, although the business conditions diffusion index – the percentage of respondents witnessing an increase in activity less those experiencing a decline – likely improved to -2.5% from -9.2% in the preceding month.
Retail & Food Services Sales: Pared by a dip in auto-dealer revenues, sales probably fell by .6% in May, reversing ~25% of the 1.8% gain of the prior three months. Excluding autos, sales probably edged .2% higher, eclipsing the .1% uptick of April. So-called “control” sales, excluding auto, building materials, and gas purchases, will provide clues to the pace of Q2 consumer spending. Barring any prior-month revisions, the .5% gain anticipated by the Street would place core purchases over the April-May span 2.7% annualized above their Q1 average, following a 3.7% annualized Q4 gain.
NY Fed Services Business Activity: The contraction in service-producing activity across New York State, northern New Jersey, and southwestern Connecticut probably entered its ninth month in June, although the gap between respondents experiencing growth and those witnessing a falloff improved to -14.5% from -16.2% in May.
Industrial Production & Capacity Utilization: Output at factories, mines, and utilities likely edged .2% higher in May, after no change in the previous month. With output expected to marginally eclipse additions to productive capacity during the reference period, the overall operating rate probably edged one tick higher to 77.8%.
NAHB Housing Market Index: Homebuilders’ appraisals of current purchases, future sales, and prospective buyer traffic probably remained downbeat in early June, with the index improving marginally to 35 from the 18-month low of 34 recorded in May. Remember that any sounding below the 50-point mark represents a deterioration in activity during the reference period.
Jobless Claims: Initial claims for unemployment insurance benefits, which have trended higher over the previous three weeks, likely topped 250K during the filing period ended June 14 – the first such occurrence since last October. The total number of persons receiving regular state benefits probably registered above 1.9mn again during the week of June 7, implying that recent job losers are having a slightly harder time finding work.
Housing Starts & Building Permits: Hampered by unusually wet weather conditions across the country in May, both starts and permits likely will register well below the respective seasonally adjusted annual rates of 1.36mn and 1.43mn anticipated by the Street.
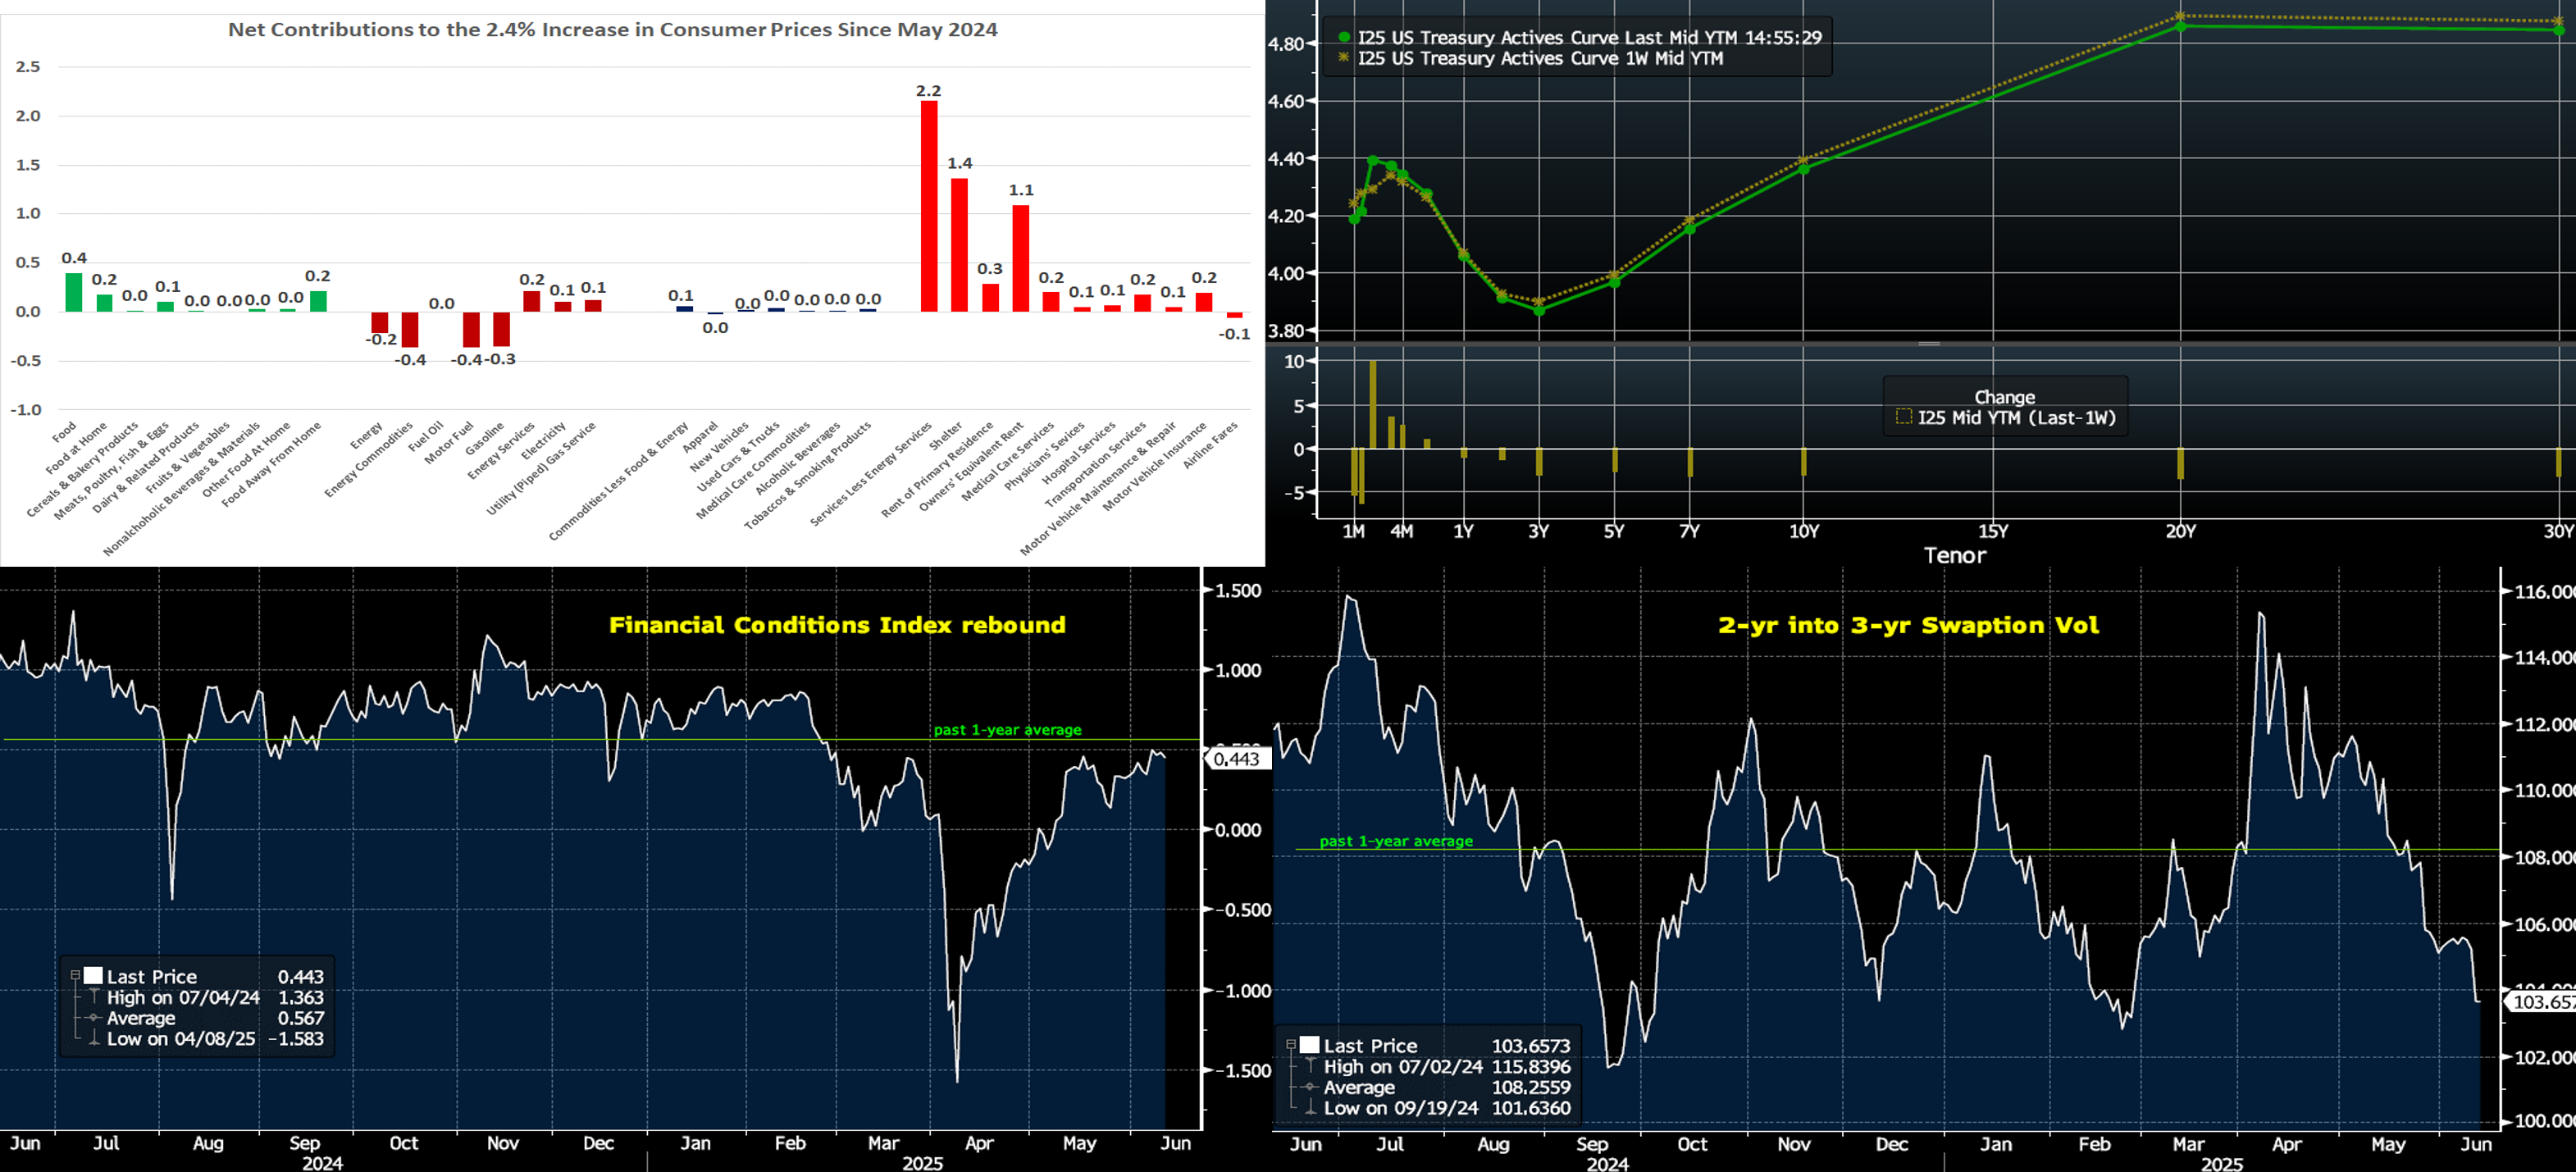
CHART 1 UPPER LEFT Sources: Bureau of Labor Statistics; FHLBNY. With this past week’s May consumer price (CPI) report reflecting better-than-expected data, it is instructive to look at the factors driving consumer prices higher over the last 12 months. Three-quarters of the 2.4% increase in the headline CPI index witnessed over the latest 12 months has been attributable to higher food and shelter costs. Retail energy costs, which were a major focus of voters in the 2024 Election, have been a modest restraint on consumer price inflation. Looking ahead, more progress in stemming non-energy services costs will be necessary to achieve success in returning consumer price inflation to the Fed’s desired 2% target. Meanwhile, in terms of tariff policy impact on prices, it appears still too early to note discernible trends in the monthly data. While a few categories (toys, appliances) revealed higher price pressures, they were offset by other categories (hotels, airfare, clothing) that may be experiencing softer demand. Meanwhile, some tariffs are in an “on hold” status. Moreover, companies “front-ran” tariffs via inventory buildups in early spring and so, for the moment, may be more willing to absorb margin pressures and wait/hope for an end to higher tariffs. The economic data through the summer months should, therefore, shed more light on these cross-currents.
CHART 2 UPPER RIGHT Sources: Bloomberg. Top pane is yield (LHS, %); bottom pane is change (LHS, bps). As of Thursday afternoon, the UST term curve was modestly lower week-on-week, with most tenors declining by only a few bps. The inflation data released this past week, namely the CPI cited above as well as PPI (Producer Price Index), were milder than expectations, yet uncertainties remain because of tariff policy and potentially delayed impacts. On the employment side of the Fed’s dual mandate, meanwhile, last Friday’s job report was decent overall, but this week’s jobless claims data again revealed a sneakily increasing trend. In sum, the Fed is expected to remain on hold at the upcoming week’s meeting. As of late Thursday afternoon, the market prices end-2025 fed funds at 3.817%, or essentially the same as a week ago, which equates to a tad over two 25-bps Fed cuts. The market’s end-2026 forward is ~3.21%, or 3 bps lower than a week ago.
CHART 3 LOWER LEFT Sources: Bloomberg. The Bloomberg Financial Conditions Index (White, RHS) has staged a rebound in the past few months, in no small part due to an apparent course-correction from the most extreme path on tariff policy. This index tracks the overall level of stress in money, bond, and equity markets to help assess the availability and cost of credit. A positive value indicates accommodative conditions, whereas a negative value indicates tighter conditions. For the moment, markets have mostly recovered from the turmoil of April. Stocks have rebounded, credit spreads have tightened back from wider levels, and option volatility measures have declined from a prior spike. Bond yields are generally higher than two months ago but are down from higher levels; the 10-year UST, for instance, was ~4.60% on May 21st but is now ~4.36%. From the vantage point of financial conditions, the Fed would appear to have reason to remain on hold this week regarding official rates.
CHART 4 LOWER RIGHT Sources: Having contributed to the rebound in financial conditions cited above, here is a view of the decline in option implied volatility (“vol”, RHS, annual bps) levels from April’s spike. Selected here is the implied volatility of a 2-year into 3-year swaption (option on a swap). It has markedly dropped since early April and is now below its past 1-year average. Note that implied vol is a major component in pricing advance products such as putables and those with caps/floors. In last week’s edition, we provided information on cap prices and our Fixed and/or ARC with Cap product. The decline in vol, all else equal, will reduce the cost of a cap. For instance, a 10 bps decline in vol on a 5-year 5% cap will shave ~19 upfront bps off the price.
FHLBNY Advance Rates Observations
Front-End Rates
- As of Thursday afternoon, short-end rates were mostly unchanged vs. a week ago, with 5- and 6-month tenors rising by a bp. Money Market Fund AUM levels have continued to underpin demand for short-end paper, thereby benefiting our funding spreads. Also helpful is that net T-bill supply is expected to remain modestly negative in the next few weeks, owing to debt ceiling dynamics.
- The market’s focus will steer towards Wednesday’s FOMC outcome.
Term Rates
- The longer-term curve, generally mirroring moves in USTs and swaps, was modestly lower by 2 to 3 bps from the week prior, with the 1-year finishing unchanged. Kindly refer to the previous section for color on market dynamics and changes.
- On the UST term supply front, the upcoming week serves a 5-year TIPS and a 20-year nominal auction. Note that UST auctions usually occur at 1pm and can occasionally spur volatility around that time. Please contact the Member Services Desk for further information on market dynamics, rate levels, or products.
Reminder: FHLBNY’s 0% Development Advance (ZDA) program is open and running – This program provides members with subsidized funding in the form of interest-rate credits to assist in originating fixed-rate loans or purchasing loans/investments that meet one of the eligibility criteria under the Business Development Advance, Climate Development Advance, Infrastructure Development Advance, Tribal Development Advance, or the new Housing Development Advance. Members can apply for interest rate credits up to $250,000. Please contact Member Services Desk to learn more and check out our ZDA page.
Price Incentives for Advances Executed Before Noon: In effect as of Tuesday, September 5, 2023, the FHLBNY is pleased to now offer price incentives for advances executed before Noon each business day. These pricing incentives offer an opportunity to provide economic value to our members, while improving cash and liquidity management for the FHLBNY. For further details, kindly refer to the Bulletin.
Looking for more information on the above topics? We’d love to speak with you!
Archives
Questions?
If you wish to receive the MSD Weekly Market Update in .pdf format (includes FHLBNY rate charts) or to discuss this content further, please email the MSD Team.