Member Services Desk
Weekly Market Update
This MSD Weekly Market Update reflects information for the week ending August 04, 2023.
Economist Views
Click to expand the below image.
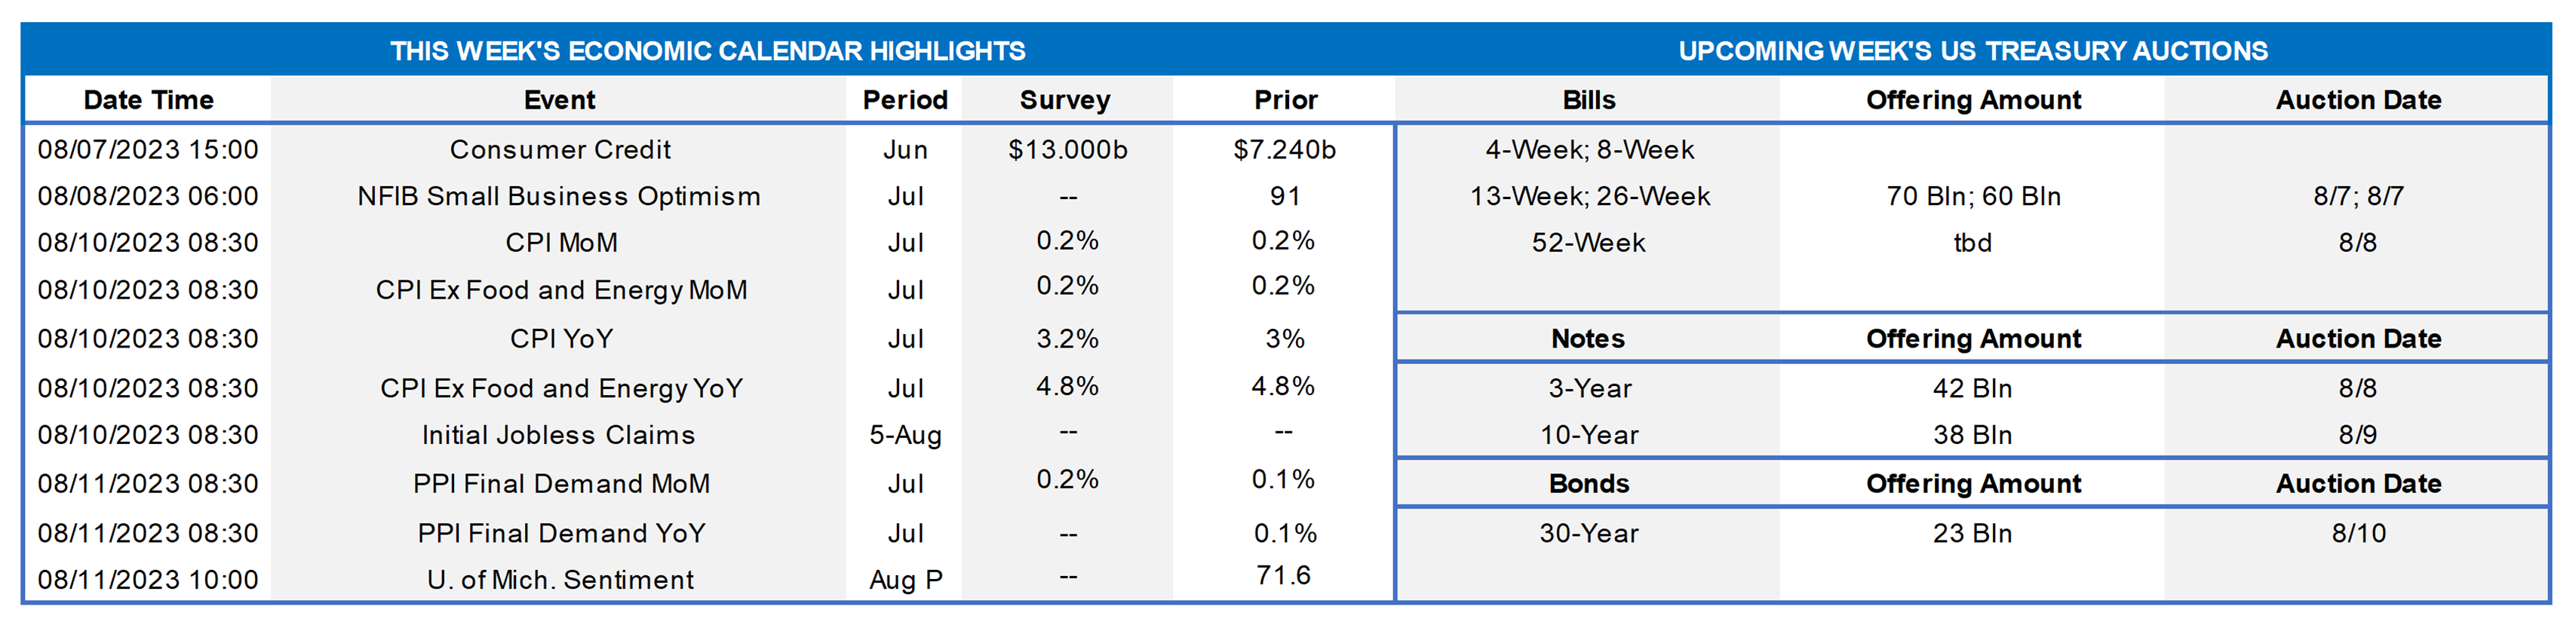
Having digested key labor-market readings for July, the market will turn its focus to the inflation side of the Federal Reserve’s dual mandate. Available data on important retail goods and services costs hint that yet another positive surprise could be in store in the July consumer price report, dampening market expectations of any additional hikes in the federal funds rate target range over the balance of this year. Echoing purchasing manager reports, small business sentiment probably improved in July. Consumers’ spirits likely brightened as well in early August. The foreign trade gap probably closed at the end of the spring quarter. A trio of Federal Reserve officials – two of whom are FOMC voters – will make public appearances to discuss a variety of topics.
Consumer Credit: Consumer installment credit is expected to have risen by $13bn in June, following the 2½-year-low $7.2bn takedown witnessed in May.
NFIB Small Business Optimism: Echoing the marked improvement in consumer sentiment measures recorded last month, the National Federation of Independent Business’ confidence gauge probably jumped by four points to 95 – the rosiest reading since the 95.7 posted in February 2022.
International Trade Balance: To be released August 8 – An anticipated increase of the surfeit on services, combined with the already reported narrowing of the goods gap, suggests that the international trade deficit closed to $64.1bn in June – the smallest monthly shortfall since last November.
Consumer Prices: Lower motor vehicle prices, combined with smaller shelter cost increases and stable energy quotes, probably left the Consumer Price Index (CPI) unchanged in July, ending a string of monthly increases going back to last August. Excluding volatile food and energy costs, the core CPI likely edged .1% higher during the reference period – the smallest monthly rise since February 2021. The projections, if realized, would place the overall and core CPIs 3.1% and 4.6% above their year-ago levels, still well above the Federal Reserve’s 2% target.
Jobless Claims: Initial claims for unemployment benefits likely remained in the recent 220K-240K range over the filing period ended August 5. Keep an eye on continuing claims, which have been trending lower, for any indication that furloughed employees may be having a more challenging time finding work.
Producer Prices: The Producer Price Index for final demand is expected to have edged .2% higher during July, after a .1% prior-month uptick. That projection, if realized, would place the year-to-year growth of the wholesale inflation measure at just .7%.
University of Michigan Sentiment Index: Rosier appraisals of current and prospective economic conditions probably propelled the consumer confidence gauge to 73 in early August – the highest reading since the 81.2 posted in July 2021.
Federal Reserve Appearances:
Aug. 7 Atlanta Fed President Bostic to deliver welcoming and closing remarks at his bank’s virtual Fed Listens event.
Aug. 7 Fed Governor Michelle Bowman to moderate a panel discussion at an Atlanta FRB Fed Listens virtual event.
Aug. 8 Philadelphia Fed President Harker to speak on the economic outlook at a Philadelphia Business Journal event.
Aug. 10 Atlanta Fed President Bostic to give pre-recorded welcoming remarks to a Fed webinar on Connecting Communities.
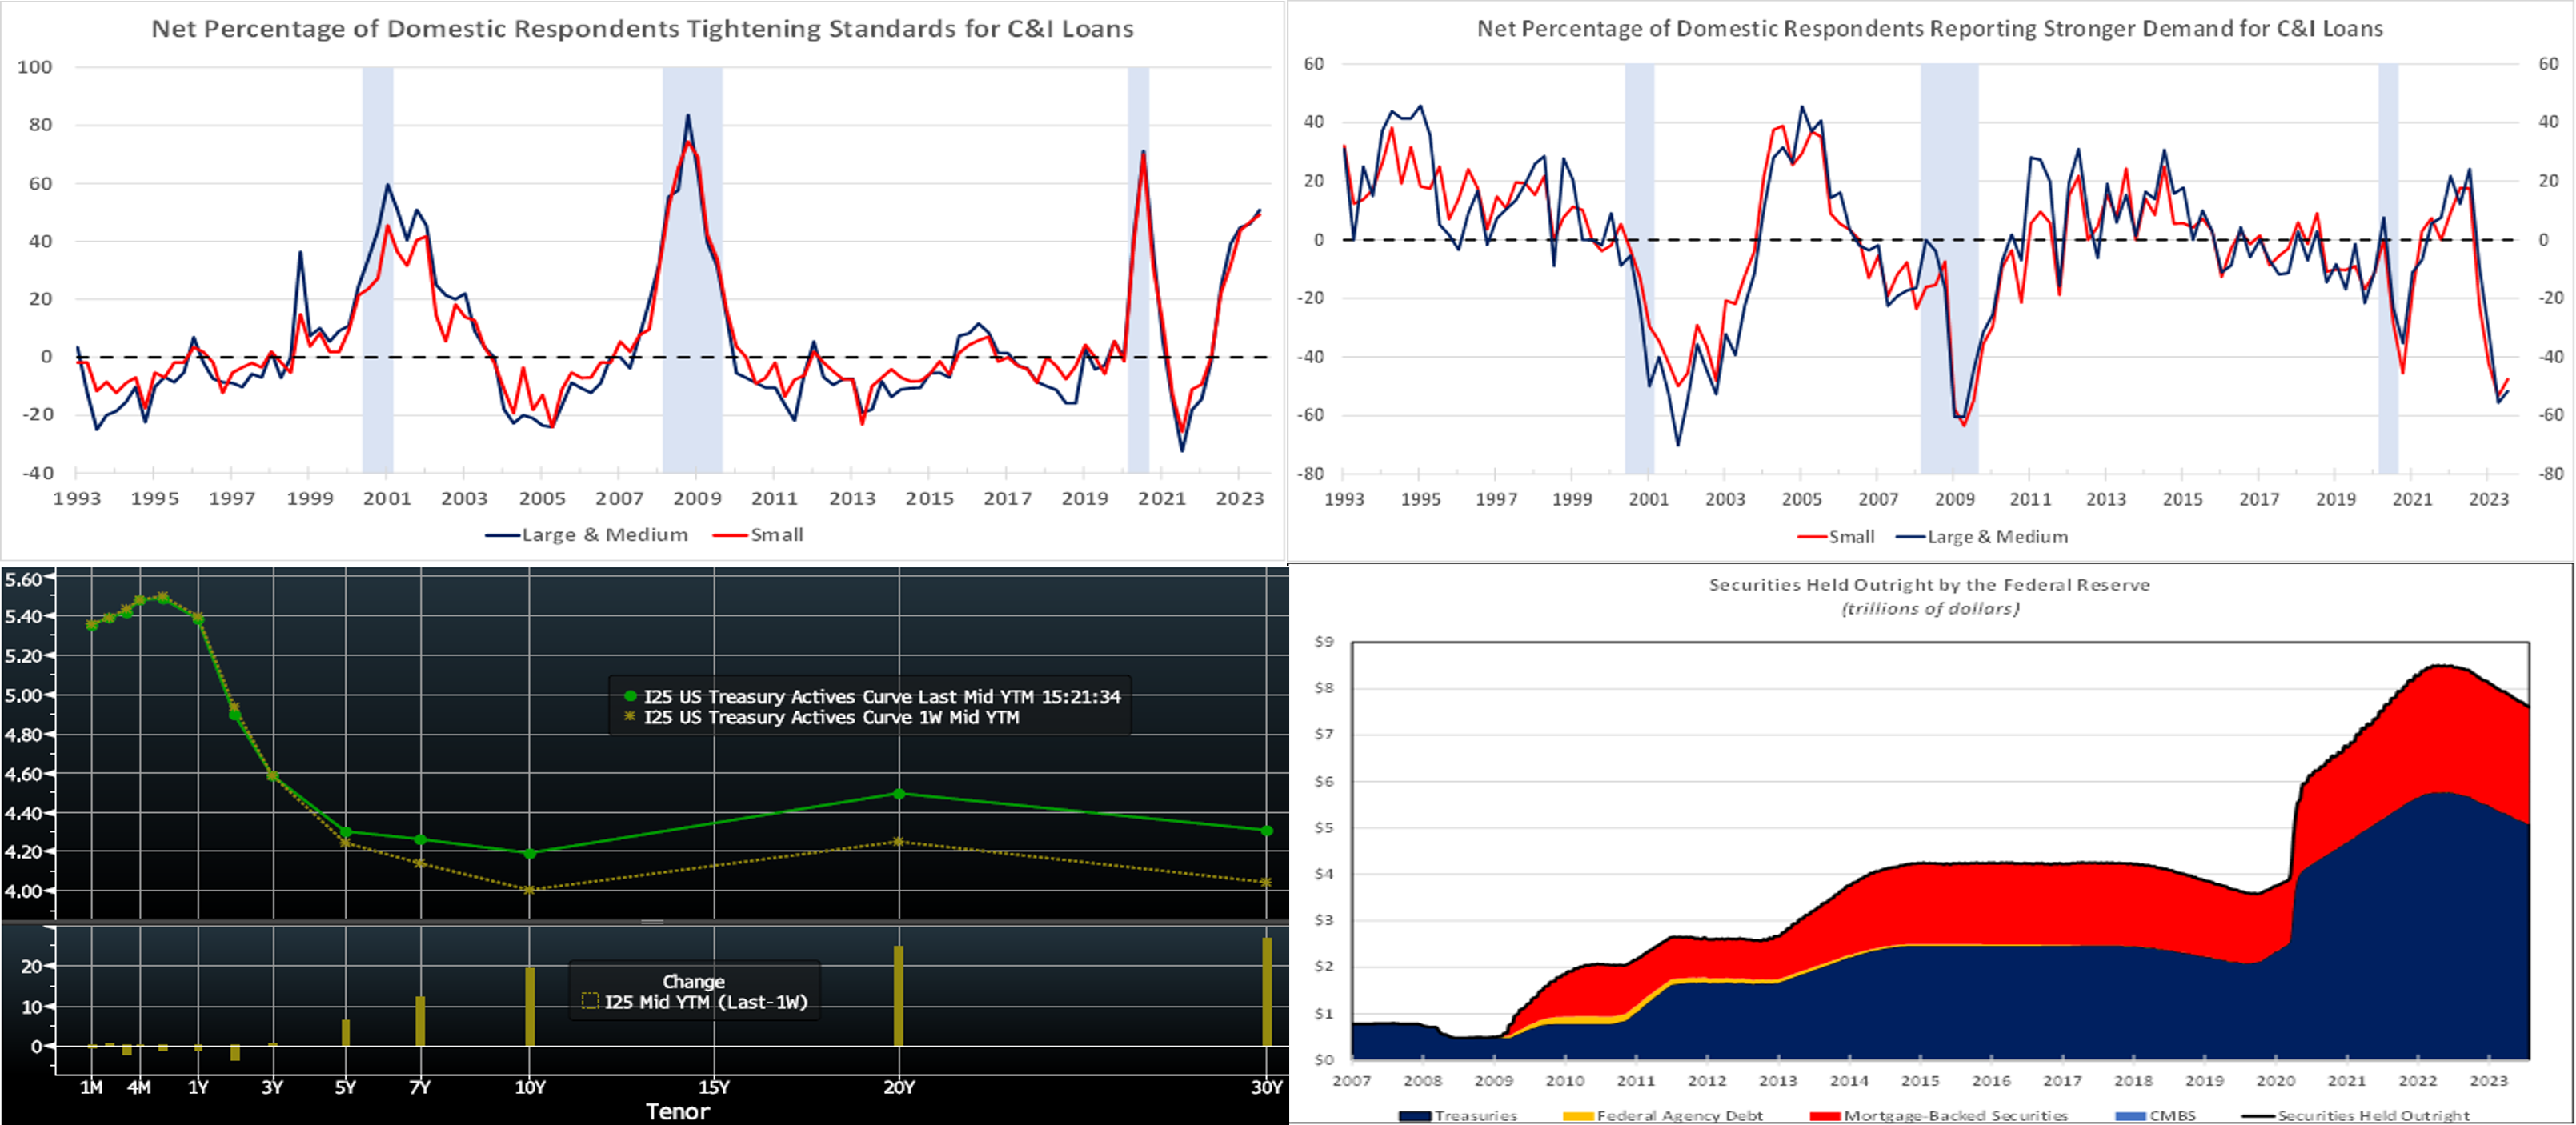
CHART 1 UPPER LEFT AND CHART 2 UPPER RIGHT
Source: Federal Reserve Board, National Bureau of Economic Research; FHLB-NY. Note: Shaded areas denote recessions. The Federal Reserve Board’s July 2023 Senior Loan Officer Opinion Survey on Bank Lending Practices, or “SLOOS,” revealed a further tightening of standards across all loan categories during the spring quarter. The net percentages of commercial bank loan officers reporting tighter lending standards for C&I loans to large & medium companies and small firms registered at 50.8% and 49.2%, respectively, during the reference period, thereby marking the broadest firming in practices since the spring of 2020 (see left-side chart, LHS, %). The breadth of demand for loans from large and medium companies remained soft in the latest canvass, narrowing to -51.6% from -55.6% in April but still near the weakest level recorded since the winter of 2009. Demand for loans from smaller firms also worsened but at a slower pace during Q2 2023, with the relevant diffusion gauge closing from -53.3% to -47.5%, still amongst the softest results in 14 years (see right-side chart, LHS, %). These results ordinarily would not look propitious for a soft-landing economic scenario, but the economy has continued to move forward, despite gloomy results from recent SLOOS surveys.
CHART 3 LOWER LEFT
Source: Bloomberg. Top pane is yield (LHS, %), bottom pane is change (LHS, bps). From last Thursday afternoon to this one, the curve moved higher and steeper. While 3-year-and-in was modestly changed, the 5-year-and-out sector was higher by 7 to 25 bps. There were two main causal factors for the curve’s bear steepening. One was Fitch’s downgrade of the US credit rating which, while not being a major game-changer, did exert some selling pressure on longer tenor USTs. The second factor was Treasury’s announcement of rising UST issuance and bigger auction sizes ahead, with a major slug of 10 and 30-year paper this upcoming week. In terms of market-implied pricing of the Fed, the 2023 peak Fed Funds rate in November now stands at ~5.43%, steady from last week. Essentially, the market is pricing a ~40% chance of one more 25 bp hike this year. The year-end forward is at ~5.40%, also steady from last week. The years 2024 and 2025 changed modestly from a week ago, with the year-end 2024 forward ~6 bps lower, at 4.15%, from a week ago. The upward move in yields was concentrated past 5-year. Please call the Member Services Desk for further information on market dynamics and/or products.
CHART 4 LOWER RIGHT
Source: Board of Governors of Federal Reserve System; FHLB-NY. While market participants continue to focus on the prospective path of the federal funds rate, it is useful to take a closer look at the other element of the current tightening of monetary policy, namely the contraction of the Fed’s System Open Market Account (SOMA), a process variously referred to as “Quantitative tightening” or “balance sheet normalization.” Essentially, in this way, the Fed is removing cash from the financial system after the expansion in the post-Great Financial Crisis decade. Since reaching a peak of ~$8.5trn in June 2022, roll-offs of maturing securities have pared the Fed’s securities portfolio by $894bn to just over $7.6trn. Yet, despite the significant reduction, the SOMA remains twice as large as the $3.8trn recorded before the COVID-19 crisis. Most of the decline has been in USTs, especially given the slow pace of prepays in MBS. In last week’s FOMC press conference, Chair Powell declared balance sheet runoff and rate moves as independent and that the former could continue even if the Fed pauses and/or subsequently cuts rates. The Fed maintained the current per-month runoff caps of $60bn for USTs and $35bn for Agency MBS. In this light, this dynamic can be expected to persist for some time.
FHLBNY Advance Rates Observations
Front-End Rates
- Short-end rates were mixed week-over-week, with the 4 to 6-month zone flat to down a few bps but shorter tenors a few bps higher. The shorter tenors moved a tad higher on Thursday, likely owing to the additional and increased T-bill supply announced in the morning. Net T-bill supply remains robust and is expected to experience further upticks, given the recent announcements from Treasury regarding upsized auctions and issuance needs. But the supply has been absorbed well thus far as Money Market Funds (MMFs) switch from the Fed’s RRP to T-bills with competitive yields. Moreover, FHLB supply has subsided from peak levels of spring, further assisting T-bill interest from investors and thereby containing any severe upward pressure on rates from T-bill supply.
- Economic data, particularly the inflation data releases, should drive direction this upcoming week.
Term Rates
- The longer-term curve, generally mirroring the moves in USTs and swaps, pushed higher and steeper week-on-week. While the shorter tenors were modestly changed, the 3-year-and-out was up, in progressive fashion, by ~6 to 21 bps. The advance curve remains inverted out to 5-year, thereby offering opportunities to extend in advance duration at lower coupon cost. Kindly refer to the previous section for relevant market color.
- On the UST term supply front, the upcoming week is heavy, as there are 3/10/30-year auctions. Please contact the Member Services Desk for further information on market dynamics, rate levels, or products.
ZDA reminder: FHLB-NY recently launched the new 0% Development Advance (ZDA) Program providing members with subsidized funding in the form of interest rate credits to assist in originating loans or purchasing loans/investments that meet one of the eligibility criteria under the Business Development Advance, Climate Development Advance, Infrastructure Development Advance, or Tribal Development Advance. This program is intended to support economic development by incentivizing members to provide below-market-rate loans or invest in qualified initiatives. Reservation requests for the program have exceeded the currently available program amount; new requests will be added to the waitlist and filled if previously reserved funds become available. Please contact the Member Services Desk to learn more and/or visit the ZDA Overview page.
Forward Start Advance (FSA): For members with upcoming borrowing or refunding plans, consider the FSA as a method to opportunistically “lock in” rates before advance settlement date. Please contact the Member Services Desk at (212) 441-6600 for more information.
The Symmetrical Prepayment Advance Feature
For those anticipating term funding needs, and with rates on an uptrend, it can be an appropriate juncture to consider our SPA feature. This feature allows the member to capture, at prepayment, changes in the fair value of the advance which are favorable to the member. Contact Member Services Desk to discuss.
Looking for more information on the above topics? We’d love to speak with you!
Questions?
If you wish to receive the MSD Weekly Market Update in .pdf format (includes FHLBNY rate charts) or to discuss this content further, please email the MSD Team.
