Member Services Desk
Weekly Market Update
Economist Views
Click to expand the below image.
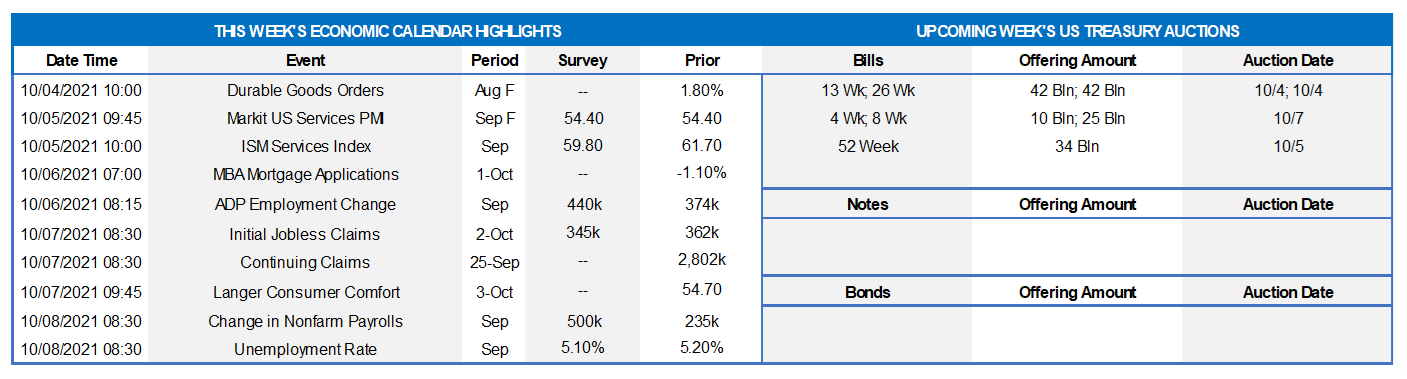
As the calendar turns to October, Congress looms as the largest market participant. Will either of President Biden’s spending plans, namely the bipartisan infrastructure plan and the “Build Back Better” plan, reach full approval and in what size/form for the latter? Will the debt ceiling issue get resolved? While the debt ceiling issue has been resolved in the past, conditions nonetheless appear concerning at this stage. These outcomes will weigh over the market for the coming days and weeks. In terms of economic market data, this week contains the release of the final Durable Goods reading for August, September PMI, and, most importantly, the Employment Report for September.
Durable Goods Orders: Durable goods orders are expected to have risen by 1.8% in August, with a small uptick of only .2% when excluding transportation orders.
ISM Services Index: District Federal Reserve Bank surveys imply that the ISM’s service-producing activity gauge retreated to a bit below 60% in September, still lower than the record high 64.1% recorded in July.
ADP Employment Change: ADP Employer Service’s update on private sector hiring in September could color expectations heading into the official government report on Friday. The Street expects 440K net new jobs to be created, about a 70K increase from that of August.
Initial and Continuing Claims: New jobless claims are expected to remain elevated, though this week’s initial claims are expected to decline a bit below last week’s 362K. In a notably positive sign, Continuing Claims have declined in the past few weeks.
Employment Situation Report/Nonfarm Payrolls: The September report is expected to portray a much stronger report on jobs created (500K) compared to the weaker August reading which was negatively impacted by the Delta variant and elevated COVID case-counts. September is usually a strong month for employment, and, with schools returning to in-school instruction, an uptick could be in the offing.
Unemployment Rate: The unemployment rate for September is expected drop by .1% to 5.1%, and workweek hours to remain unchanged at 34.7.
Federal Reserve:
- Oct 1: Philadelphia Fed President Harker discusses economic outlook at virtual event hosted by New Castle County Chamber of Commerce.
- Oct 1: Chicago Fed President Mester discusses inflation and employment at virtual event hosted by Shadow Open Market Committee.
- Oct 4: St. Louis Fed President Bullard participates in virtual discussion on Mastering the Economic Recovery.
- Oct 5: Fed Vice Chair of Supervision Quarles discusses Libor transition at Structured Finance Association conference in Las Vegas.
Click to expand the below images.
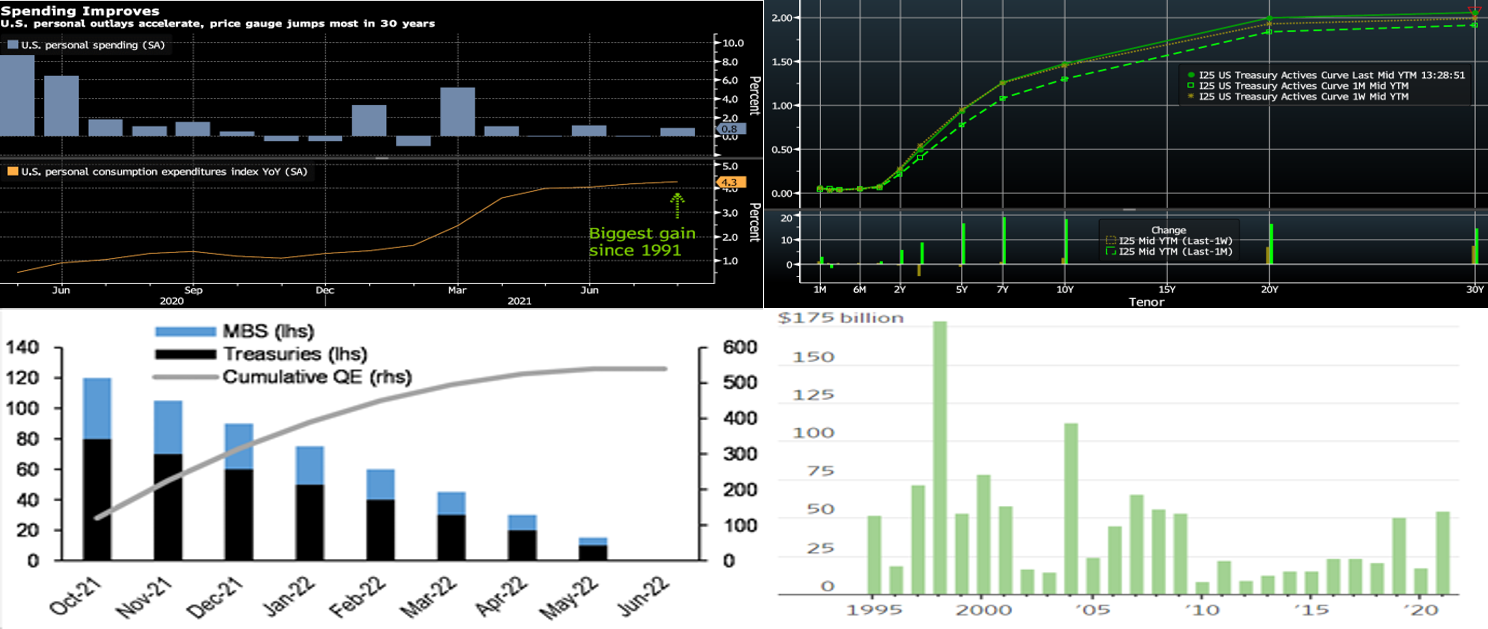
CHART 1 UPPER LEFT
Bloomberg, Bureau of Economic Analysis. Much of the recent economic data has reflected an improving yet challenged trend. For instance, this past Friday’s release on personal spending for August (top pane within chart) was higher than expectations. However, the Personal Consumption Expenditure (PCE) Deflator index (bottom pane within chart) also trended higher to its biggest year-over-year gain since 1991. The monthly personal consumption gain for August was .8%, while the monthly PCE Deflator gain was .4%, thereby making the “real” personal consumption gain .4%. Meanwhile, prior month reported gains for personal spending were revised lower, and this news has spurred some economists to, in turn, revisit and revise a tad lower than their Q3 GDP forecasts. Lastly, as for the PCE Core Deflator measure, the Fed’s preferred data point for inflation, increased .3% for August and 3.6% year-over-year, both slightly above market expectations. The Delta variant certainly contributed some negative impact to spending in the past few months. And while the Fed considers the inflation forces to be transitory, the data will likely reinforce the Fed’s desire to soon commence with tapering securities purchases in the first move of removing accommodation.
CHART 2 UPPER RIGHT
Source: Bloomberg. Note: Top pane is yield (%), bottom pane is change (bps). As of midday Friday, the UST curve finished modestly steeper week-over-week, led by higher yields in the very long end. Yields were little changed out to 5-year, except for the 3-year being a few bps lower. The 7 to 10-year sector ended 1-2 bps higher, while the 20 to 30-year sector closed ~6-7 bps higher. Yields, however, hit fresh highs since March 2020 on Thursday before subsequently retreating again. For instance, the 5-year traded at 1.022% compared to its .94% level of midday Friday. Higher yields have attracted interest from buyers, and those sitting on funds should monitor these opportunities to capture better yield and margin. The market will monitor legislative developments, the debt ceiling issue, and employment data in the week ahead.
CHART 3 LOWER LEFT
Source: JP Morgan. This chart of estimated future Fed QE purchases (in $bn) provides helpful context on the looming Fed taper announcement/operation. Assuming a tapering process that begins in November and ends in mid-2022 at a reduction of $15bn/month (composed of $10bn USTs and $5bn MBS), the Fed would still be net-purchasing and adding about $420bn of liquidity to the markets and financial system over this timeline. Given this likely gradual process, the Fed will remain a consistent source of demand in the months ahead. Meanwhile, many market strategists expect UST supply to moderate in the months ahead which should offset some of the supply/demand impact of the taper.
CHART 4 LOWER RIGHT
Source: Dealogic, WSJ. Depicted here is the value (in $bn) of announced bank merger & acquisition deals through September 27th of each year. The onset of the pandemic applied the brakes to deals in 2020. This year, however, has experienced a notable recovery and increase in deals/values, with the tally at $54bn thus far in 2021.
FHLBNY Advance Rates Observations
Front-End Rates
Short-end Advance rates finished unchanged to a bp higher on the week. Money Market Funds’ AUM increased by a sizable ~$30bn this past week. Demand for short paper and the Fed’s RRP, which hit a record $1.6trn Thursday and stands last ~$1.3trn, remains strong, and this increase in MMF AUM will only add to the demand. The Fed acknowledged this dynamic at the last FOMC, as they raised the RRP counterparty limit to $160bn from $80bn. The overall supply/demand paradigm persists in suppressing rate levels, as the GSEs continue to invest large sums into money markets, the TGA continues its decline, Fed purchases instill funds to the banking system, and short-maturity paper is in low supply. While the debt ceiling issue has stirred some unusual dynamics in the short-term Bills market, such as notably higher yields on late-October maturities, the issue has not impacted our issuance or advance levels.
UST issuance overall is now net positive supply in that more is being issued than what the Fed is buying in its programs. However, with short UST rates at rock-bottom levels and the Fed on hold, rates are likely to persist in a near-term sideways pattern. Importantly, weekly net T-bill issuance has been lower since 2020 and negative for months, and Treasury intends to shift issuance out the curve. Moreover, the looming federal debt ceiling may further constrain issuance. Further legislative packages and related borrowing may lead to an eventual increase of T-bill auction sizes and positive net supply, but for now overall market supply/demand dynamics should keep short rates in check from large moves to the upside.
Term Rates
The Advance rate curve finished steeper on the week, led by longer maturities. While the 1 to 5-year sector was a few bps lower to unchanged in progressive fashion, the 6 to 10-year sector was ~1 to 3 bps higher in progressive fashion out the curve. Kindly refer to the previous section for further color on relevant market dynamics.
On the UST supply front, this week brings a reprieve in auctions. The market will closely monitor legislative developments and economic data, particularly the jobs report on Friday. As usual, the state of the pandemic will be followed, and, in a distressingly recurring issue of recent years, the debt ceiling topic will also be in the market’s focus.
Product Enhancement Alert: FHLBNY announced an enhancement to the Callable Adjustable Rate Credit Advance (“Callable ARC”). The product features a 1-time call/cancel option (member’s option) to extinguish funding early at no cost via two distinct option structures, thereby giving members flexibility in meeting the demands of a fluctuating balance sheet. Given the shorter-term nature of the current borrowing environment, the minimum term for the Callable ARC has been lowered to 4-month (from the previous 7-month) for our 1-month-left-to-maturity call option (SOFR or 1-month Libor index available) to better meet our members’ needs. Meanwhile, the 3-year Non-Call 2-year product for SOFR continues to be offered to members for their longer-term needs.
New Product Alert: In order to satisfy member needs and provide greater product flexibility to match bond and derivative market conventions, FHLB-NY now offers SOFR-linked advances based on SOFR-index compounding. Note that this product is in addition to SOFR-linked advances based on SOFR-index averaging which have been offered since November 2018.
The Symmetrical Prepayment Advance Feature
With rates at or near multi-year lows, it is a compelling juncture to use the SPA feature on term advances. This feature allows member to capture, at prepayment, changes in the Fair Value of the advance which are favorable to the member. Contact us to discuss.
Looking for more information on the above topics? We’d love to speak with you!
Questions?
If you wish to receive the MSD Weekly Market Update in .pdf format (includes FHLBNY rate charts) or to discuss this content further, please email the MSD Team.