Member Services Desk
Weekly Market Update
This MSD Weekly Market Update reflects information for the week of November 15, 2021.
Economist Views
Click to expand the below image.
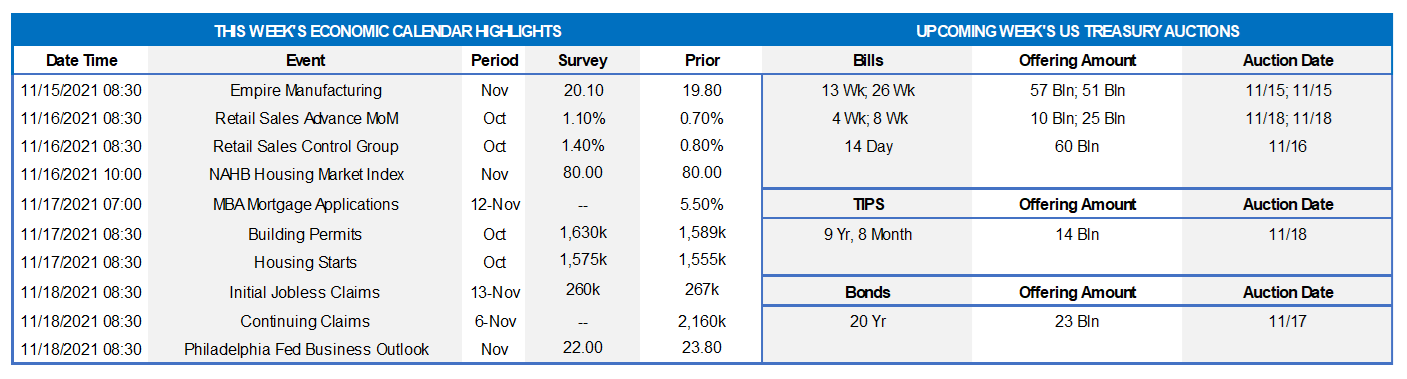
This week’s economic calendar will allow market participants to update their expectations for current-quarter real GDP growth. Hinting at an autumn revival in consumer spending, retail and food services sales likely posted another solid gain in October, with virtually all segments contributing to the anticipated rise. Industrial production and residential building activity probably rebounded last month, erasing portions of their reported September declines. With open positions eclipsing those jobless by a wide margin, unemployment insurance claims likely headed lower. The median Street forecast is for a reacceleration in real GDP growth to almost 5% in Q3, but some tracking estimates run as high as 8.5% such as that of the Federal Reserve Bank of Atlanta. The Federal Reserve speech calendar will be crowded with policymakers discussing a variety of timely topics in public.
Empire State Manufacturing Survey: Manufacturers in New York State are expected to report that general business activity expanded for a 17th consecutive month in November, with the anticipated pace of activity essentially matching that of October. The general business conditions diffusion index – the percentage of respondents experiencing a pickup in activity less than those witnessing a decline – likely climbed to 20.2% from 19.8% in the previous month.
Retail & Food Services Sales: The Census Bureau’s update on retail activity in October will provide important information on consumer spending growth at the beginning of the fall quarter. Stepped-up purchases across a wide variety of segments are expected to boost the headline tally by .8%, marginally eclipsing September’s .7% gain. As always, market participants will be paying particular attention to so-called control sales excluding auto, building materials and gasoline purchases in this week’s report. Barring any prior-month revisions, the 1.6% jump anticipated by the Street would leave core purchases a healthy 12.8% annualized above their July-September average, following a comparatively modest 3.6% Q3 gain.
Industrial Production & Capacity Utilization: Production at the Nation’s factories, mines and utilities probably rebounded in October, rising by .8% and reversing almost two-thirds of September’s surprising 1.3% decline. With output likely eclipsing additions to productive capacity during the reference period, the overall operating rate probably climbed by a .7 percentage point to 75.9%.
NAHB Housing Market Index: Home-builders’ appraisals of conditions likely remained upbeat in early November. If unchanged at 80, the index would remain well above the neutral 50-point mark.
Housing Starts & Building Permits: The number of new housing units started likely climbed by 1.6% to a SAAR of 1.58mn in October, completely erasing September’s reported decline. The number of new building permits issued – a closely followed leading indicator of prospective residential construction – probably rose by 2.8% to 1.63mn, recouping a portion of the prior month’s 7.8% dive.
Jobless Claims: Initial and continuing claims under regular state unemployment insurance programs likely edged lower over their latest respective reporting periods. The termination of pandemic-related jobless benefits suggests that the total number of persons receiving assistance will also decline further during the week ended October 30 from the 2.57mn, or 1.7% of the civilian labor force, recorded in the prior week.
Federal Reserve:
- Nov. 16 Fed District Bank Presidents Barkin, George and Bostic to take part in a discussion about racism and the economy.
- Nov. 17 San Francisco Fed President Daly to speak at New York Fed’s Treasury Market Conference.
- Nov. 17 Atlanta Fed President Bostic to make closing remarks at a virtual conference on community development.
- Nov. 18 Chicago Fed President Evans to take part in a moderated Q&A hosted by the BKD Financial Services Symposium.
- Nov. 18 San Francisco Fed President Daly to take part in a Fed Listens event about pandemic recovery and care work.
Click to expand the below images.
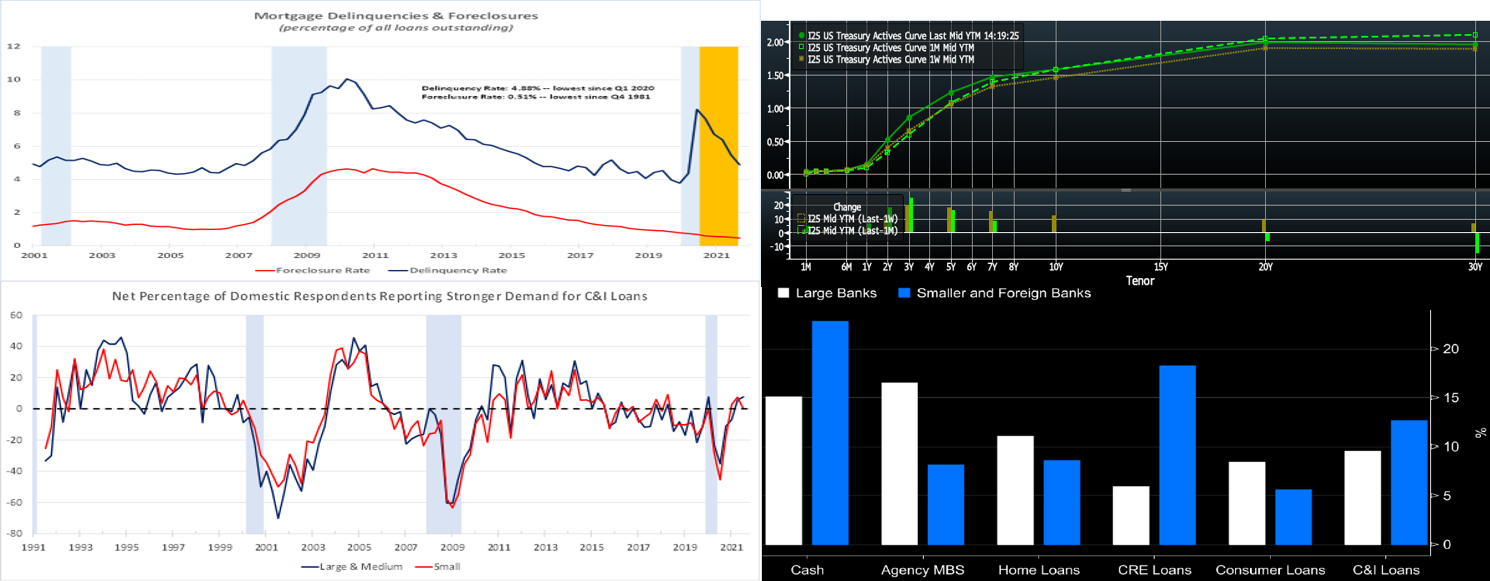
CHART 1 UPPER LEFT
Source: MBA; NBER; FHLBNY. Blue-shaded areas denote recessions; orange-shaded area highlights current economic expansion. Mortgage performance metrics continue to improve. Consistent with economic and labor market recovery, homeowners’ ability to make mortgage payments progressed during the summer. The delinquency rate for loans on 1-to-4-unit residential properties retreated to 4.88% at the end of Q3 from 5.47% during the spring – the lowest level since the 4.36% recorded in winter 2020. The decline in the national delinquency rate was driven entirely by a drop in later-stage delinquent loans – those loans that are 90 days or past due, but not in foreclosure. According to the Mortgage Bankers Association, by the end of Q3, many borrowers had approached the 18-month expiration point of their forbearance terms and were placed in permanent home retention solutions, such as modifications and loan deferrals. Once these borrowers entered permanent post-forbearance workouts and resumed payments, they moved from delinquent to current status. The nationwide foreclosure rate dipped by 5 bps to .46% – the lowest reading since the end of 1981.
CHART 2 UPPER RIGHT
Source: Bloomberg. Note: Top pane is yield (%), bottom pane is change (bps). As of midday Friday, yields are up fairly notably across the board since last Friday. Most up in 3 to 7yr belly. 3yr the most, up ~17bps. Biggest driver was the higher-than-consensus CPI data which has driven the curve higher/flatter and the market has priced higher the extent/probability on Fed hikes. Breakevens on TIPS notably rose, as might be expected on the data. So after late last week and early this week moderating the degree of tightening priced into the curve, today it basically priced it back in again and more so.
CHART 3 LOWER LEFT
Source: Federal Reserve; FHLBNY. The recently released October 2021 Senior Loan Officer Survey on Bank Lending Practices provided insights on the Q3 environment. Regarding loans to businesses, respondents reported easier standards and stronger demand for commercial and industrial (C&I) loans to large and middle-market firms over Q3. Banks reported easier standards for C&I loans to small firms, while demand from small firms remained basically unchanged. Charted here is the demand side of the C&I sector. For commercial real estate (CRE), banks reported easier standards. Banks reported stronger demand for multifamily loans and nonfarm nonresidential properties, while demand for construction and land development remained basically unchanged. For loans to households, banks eased standards across most categories of residential real estate (RRE) loans, on net, and reported weaker demand for most types of RRE loans over Q3. Banks also eased standards across consumer loan categories, while reports on demand for consumer loans were mixed. A full report can be found at https://www.federalreserve.gov/data/sloos/sloos-202110.htm.
CHART 4 LOWER RIGHT
Source: Bloomberg; Federal Reserve. Gleaned from a recent Fed report, here is a snapshot of various bank asset groups and their respective proportions to total assets. Relatively, large banks maintain a notable proportion of Agency MBS in their asset portfolios, while smaller banks clearly maintain higher allocations in commercial real estate (CRE). Meanwhile, smaller banks, compared to larger ones, hold a notably larger proportion of cash to total assets. With the rise in yields of recent months (note that the UST 3-year now trades at pre-pandemic levels of February 2020), it would be sensible for smaller banks to fully analyze their deposits and consider deploying cash into securities.
FHLBNY Advance Rates Observations
Front-End Rates
- Short-end Advance rates finished unchanged on the week. The debt ceiling issue has essentially been pushed off to December, but this issue, and the T-bill curve kinks it has caused, have not materially impacted our rates. Demand for short paper and the Fed’s RRP, which hit a record $1.6trn a month ago and stands last ~$1.42trn remains strong. The Fed acknowledged this dynamic at the last FOMC, as they raised the RRP counterparty limit to $160bn from $80bn. The overall supply/demand paradigm persists in suppressing rate levels, as the GSEs continue to invest large sums into money markets, the TGA has declined, Fed purchases instill funds to the banking system, and short-maturity paper is in low supply.
- UST issuance overall is now net positive supply in that more is being issued than what the Fed is buying in its programs. However, with short UST rates at rock-bottom levels and the Fed on hold, rates are likely to persist in a near-term sideways pattern. Importantly, weekly net T-bill issuance has been lower and often negative since 2020, and Treasury intends to shift issuance out the curve. T-bills are experiencing a near-term issuance uptick on some “catch-up” issuance from the debt ceiling issue slowdown, but this uptick should not alter the overall money markets picture. Further legislative packages and related borrowing may lead to an eventual increase of T-bill auction sizes and positive net supply, but for now, overall market supply/demand dynamics should keep short rates in check from large moves to the upside.
Term Rates
- The Advance rate curve was higher midday week-over-week. The 1-year was 5 bps higher; note that this maturity point now encompasses the potential “Fed-tightening time zone”, and so it has and could creep higher as time ensues. The 2-year and further points, meanwhile, saw rates rise from 13 to 18 bps. This week’s very strong CPI print has pushed term rates higher.
- On the UST supply front, this week will bring 20yr Bonds and 10yr TIPs. As always, the market will closely monitor this week’s legislative developments and economic data.
New Product Alert: FHLBNY is pleased to announce the launch of the Business Development Advance (BDA) on Thursday, November 4, 2021. The BDA is a 0% advance to help our members provide funding to qualifying small businesses to promote community & economic growth. The BDA is subsidized funding in the form of interest-rate credits. There is a total of $3 million of interest-rate credits available in 2021. Members can request to reserve their interest-rate credits up to $50,000 on a first-come/first-served basis. For further details, please view our BDA overview page and watch this past Thursday’s BDA webinar, and/or contact the Member Service Desk at 1-800-546-5101 option 1.
The Symmetrical Prepayment Advance Feature
With rates at or near multi-year lows, it is a compelling juncture to use the SPA feature on term advances. This feature allows member to capture, at prepayment, changes in the Fair Value of the advance which are favorable to the member. Contact us to discuss.
Looking for more information on the above topics? We’d love to speak with you!
Questions?
If you wish to receive the MSD Weekly Market Update in .pdf format (includes FHLBNY rate charts) or to discuss this content further, please email the MSD Team.