Member Services Desk
Weekly Market Update
This MSD Weekly Market Update reflects information for the week ending June 6, 2025.
Economist Views
Click to expand the below image.
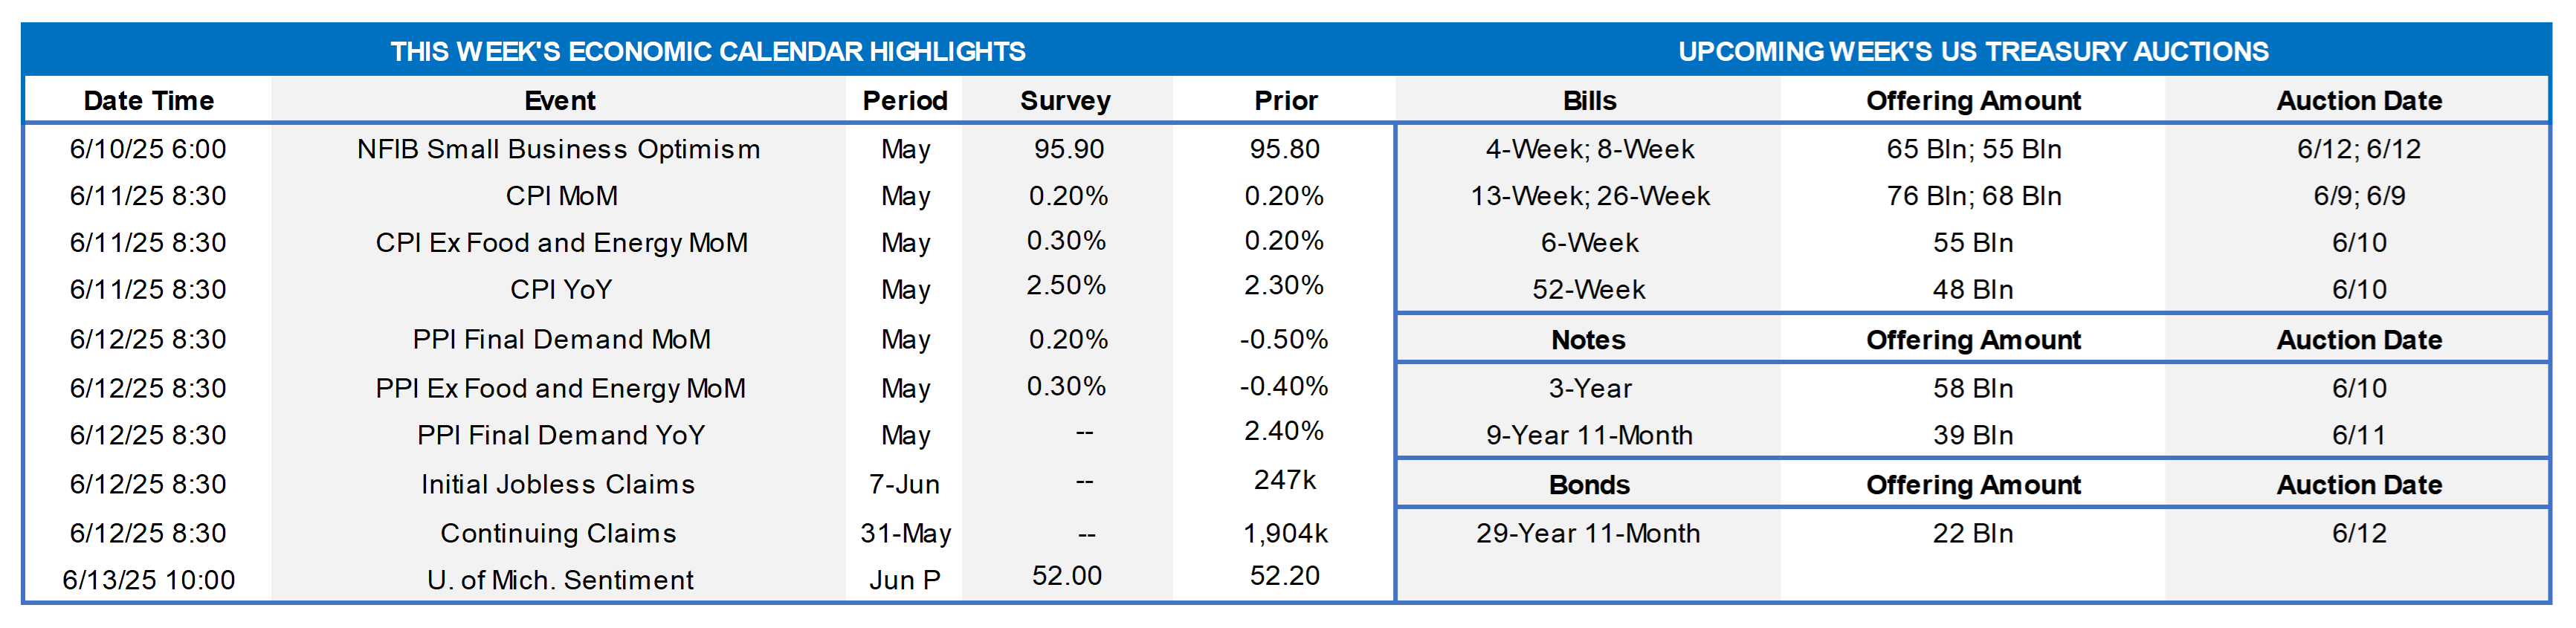
Market participants likely will face a quiet week, at least on the data front. With the May employment report in the rearview mirror, the market’s focus will shift to reports on the inflation side of the Federal Reserve’s dual mandate. Meanwhile, hopes for positive developments on the international trade front probably lifted the spirits of consumers and small businesses in upcoming reports. Monetary policymakers will be silent during the traditional blackout period ahead of the June 17-18 Federal Open Market Committee meeting.
NFIB Small Business Optimism Index: Hopes for progress on the tariff front probably lifted the National Federation of Independent Business’ sentiment barometer from 95.8 in April to 97 in May, reversing three-quarters of the reported prior-month decline.
Consumer Prices: Capped by a seasonally adjusted decline in gasoline pump prices, the Consumer Price Index (CPI) likely edged just .1% higher in May, following the .2% uptick posted in the prior month. Meanwhile, the so-called core CPI excluding volatile food and energy costs probably continued apace, rising by .2% for the fourth time in the past six months. Those projections, if realized, would place the year-to-year growth rates of the two closely followed inflation gauges at 2.4% and 2.8%, respectively, still above the Federal Reserve’s desired 2% target.
Producer Prices: The Producer Price Index (PPI) for final demand is expected to have rebounded in May, rising by .2% after the surprising .5% decline recorded in April. If accurate, that forecast would place the headline PPI 2.5% above its prior-year level.
Jobless Claims: Initial claims for unemployment insurance benefits likely remained in the recent 225K-240K range during the week ended May 31, while continuing claims were little changed from the 1.9mn witnessed during the filing period ended May 17.
Michigan Sentiment Index: The improvement in consumer confidence witnessed during the latter part of May likely continued in June, thereby lifting the University of Michigan’s sentiment gauge to a three-month high of 54.5.
Federal Reserve Appearances: Federal Reserve officials will observe the blackout period on public appearances ahead of the June 17-18 FOMC meeting.
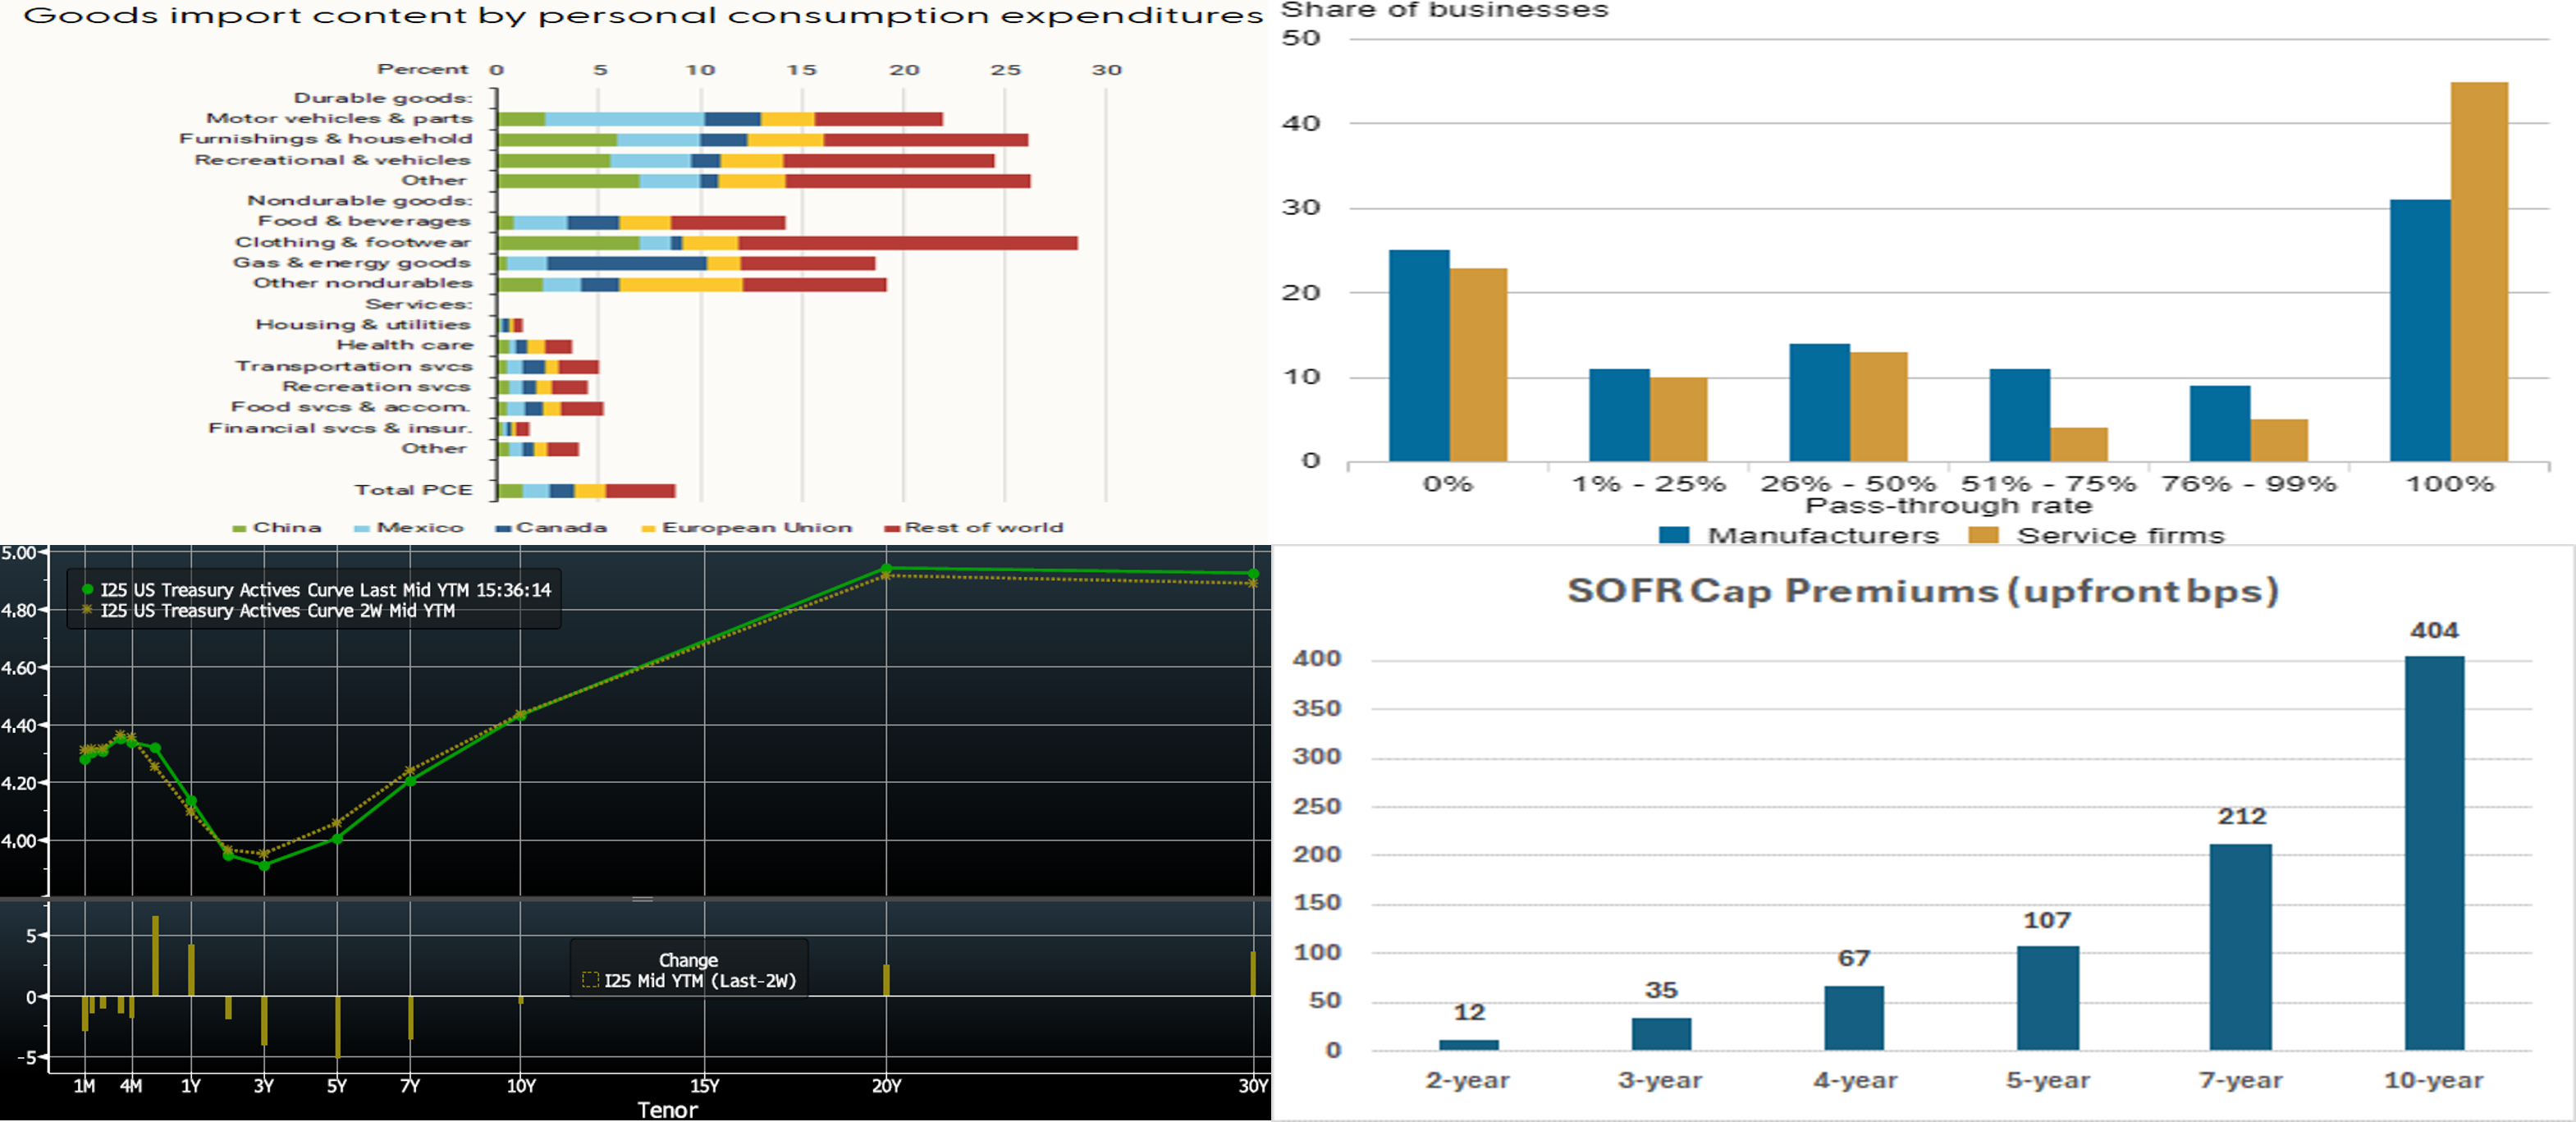
CHART 1 UPPER LEFT Sources: Bureau Economic Analysis; Census Bureau; FRB-San Francisco. To decipher the potential impact of tariffs on consumer prices, we must first determine the import content of individual spending categories. The sections of each bar here show the share of domestic goods consumption that can be traced back to imports from each region. For example, on motor vehicles and parts, nearly 8% of spending can be traced back to imports from Mexico. Overall, about 22% of spending in this category is attributable to imports. Similarly, about 7% of household spending on clothing & footwear can be traced back to imports from China. Note that even in categories with high shares of import content, such as this one, the import content is about 30%, meaning that about 70% of spending is retained domestically. This split is because the bulk of the costs associated with these items reflect domestic costs such as transport and markups. Once the import content of spending categories is weighed by their share and the results are added, about 9% of consumer outlays can be traced back to goods imports. According to San Fran Fed economists, an across-the-board 25% increase in tariffs would, if fully passed on to consumers, boost PCE inflation by 2.2%.
CHART 2 UPPER RIGHT Sources: FRB-NY. According to a freshly released study by the NY Fed, businesses have hiked prices quickly in response to tariffs. The survey of businesses in the NY-Northern NJ region, conducted May 2-9, asked firms whether they were passing on tariff-induced costs to customers. The results indicated that the bulk of businesses passed on at least some of the cost, with ~31% of manufacturers and ~45% of services companies fully passing along all tariff-induced costs via higher prices to customers. A minority, or close to a quarter, of businesses thus far passed along none of the costs, while a sizable portion of businesses fell in between the “full or none” extremes. Perhaps the upcoming week’s inflation data will begin to show some upward pressures on prices, although it is still early, and various countervailing forces are at play in the economic data. The full report can be viewed here.
CHART 3 LOWER LEFT Sources: Bloomberg. Top pane is yield (LHS, %); bottom pane is change (LHS, bps). As of Thursday afternoon, the UST term curve was modestly lower week-on-week, led by longer tenors, which declined by 2 to 4 bps. Yields had been lower but retraced Thursday afternoon, likely on position-squaring before the next day’s jobs report. Economic data, particularly the ISM manufacturing and services reports, was generally weaker-than-expected this past week. As of late Thursday afternoon, the market prices end-2025 fed funds at 3.815%, or 2.5 bps lower than a week ago and which equates to a tad over two 25-bps Fed cuts. The market’s end-2026 forward is ~3.24%, or 2 bps higher than a week ago.
CHART 4 LOWER RIGHT Sources: FHLBNY. Shown here are indicative prices for 5% strike interest rate caps by tenor. Naturally, the longer tenors have higher prices owing to more options and greater time value. Also, the swaps yield curve past 4-year turns positively sloped, thereby making a cap more expensive all else equal. While there may have been slightly more optimal timing opportunities to purchase caps in recent months, the yield curve is still inverted-to-flat out to 5-year, and implied volatility, a major component of cap pricing, is generally at or below its past year averages. The 5-year cap premium equates to ~24 bps per annum. For those in a liability sensitive position, purchasing a cap as insurance protection to higher rates can be sensible and can also improve regulatory net economic value stress tests. Note that we offer advance products, both floating (ARC with Cap) and fixed (Fixed with Cap) with embedded caps (and floors too) that can provide this insurance while also obviating the need for separate derivatives documents or operational requirements. Please call the Member Services Desk for further information and/or pricing updates.
FHLBNY Advance Rates Observations
Front-End Rates
- As of Thursday afternoon, short-end rates were mostly unchanged vs. a week ago, except for the 5 and 6-month tenors which dipped by 3 and 6 bps, respectively, owing to market repricing of Fed expectations for 2025. The usual month-end upward pressure in repo markets lingered this week; for instance, SOFR rose from 4.26% two weeks ago to 4.35% in the past week. This pressure appears to now be easing, with June 4th SOFR back down to 4.28%. Money Market Fund AUM levels have continued to underpin demand for short-end paper, thereby benefiting our funding spreads. Also helpful is that net T-bill supply is expected to remain modestly negative in the next few weeks, owing to debt ceiling dynamics.
- The market will focus on the inflation data and any trade policy developments in the upcoming week.
Term Rates
- The longer-term curve, generally mirroring moves in USTs and swaps, was 1 to 4 bps lower from the week prior, with longer tenors leading the modest move. Kindly refer to the previous section for color on market dynamics and changes.
- On the UST term supply front, the upcoming week serves a slate of 3/10/30-year auctions. Note that UST auctions usually occur at 1pm and can occasionally spur volatility around that time. Please contact the Member Services Desk for further information on market dynamics, rate levels, or products.
Price Incentives for Advances Executed Before Noon: In effect as of Tuesday, September 5, 2023, the FHLBNY is pleased to now offer price incentives for advances executed before Noon each business day. These pricing incentives offer an opportunity to provide economic value to our members, while improving cash and liquidity management for the FHLBNY. For further details, kindly refer to the Bulletin.
Looking for more information on the above topics? We’d love to speak with you!
Archives
Questions?
If you wish to receive the MSD Weekly Market Update in .pdf format (includes FHLBNY rate charts) or to discuss this content further, please email the MSD Team.