Member Services Desk
Weekly Market Update
This MSD Weekly Market Update reflects information for the week of August 2, 2021.
Economist Views
Click to expand the below image.
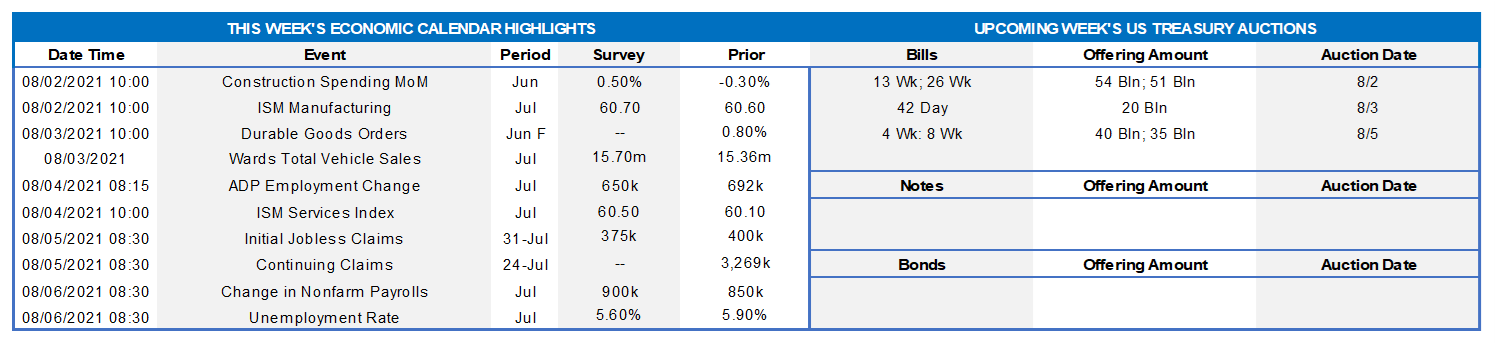
Ripping another page from their calendars, market participants will contend with a crowded release calendar this week. Surveys of manufacturers and service-producing firms are expected to show that the business expansion continued at a rapid clip at the beginning of the summer quarter. Labor market barometers probably improved last month, but further significant progress is required to return most metrics to their pre-pandemic levels. Reflecting industry-specific issues, motor vehicle sales likely slipped to their lowest level since last July, however. Economists’ projections for summer-quarter real GDP growth are currently centered at 7.25% annualized, up from 6.5% in Q2. Three members of the Fed Board of Governors are scheduled to make public appearances to discuss a variety of timely topics.
Construction Spending: The nominal value of new construction put-in-place is expected to have rebounded by .5% in June, erasing the .3% dip posted in May. If the median Street projection is on the mark, construction spending climbed by 1.4% annualized during Q2, following a 16% winter-quarter leap.
ISM Manufacturing Index: Manufacturing activity likely expanded for a 14th consecutive month in July. Federal Reserve district bank canvasses suggest that the Institute for Supply Management’s Purchasing Managers Index climbed to 62% from 60.6% in the previous month.
Motor Vehicle Sales: Constrained by low inventories and ongoing component supply shortages, sales of light trucks and passenger cars probably slipped to a 12-month low seasonally adjusted annual rate of 14.9mn in July, down from 15.4mn in the prior month.
ADP National Employment Report: ADP Employer Service’s update on private sector hiring in July could color expectations leading into the official government report on Friday. The Street expects 675K net new jobs to be created, down slightly from 692K positions added in June.
ISM Services Index: District Federal Reserve Bank surveys imply that the ISM’s service-producing activity gauge retreated to 59.5% in July from 60.1% in June but remained deep in expansionary territory.
Employment Situation Report: The 1.5mn drop in the number of persons collecting unemployment insurance benefits under all administered programs since the Bureau of Labor Statistics’ June canvassing period suggests that nonfarm payroll may have expanded by over 1mn in July, eclipsing the prior month’s hefty 850K-job gain. Meanwhile, the dramatic improvement in consumers’ appraisals of labor market conditions over the past three months, hints at a sizable decline in the civilian jobless rate to perhaps 5.5%. Given market participants’ heightened sensitivity to inflation soundings, average hourly earnings will undoubtedly receive considerable scrutiny in the upcoming report.
Federal Reserve Appearances:
- Aug. 3 Fed Governor Bowman to give welcoming remarks at a Fed conference on low-income and marginalized workers.
- Aug. 4 Fed Vice Chair Clarida to deliver a speech entitled Outlooks, Outcomes, and Prospects for U.S. Monetary Policy.
- Aug. 5 Fed Governor Waller to give a talk on central bank digital currencies at an American Enterprise Institute conference.
Click to expand the below images.
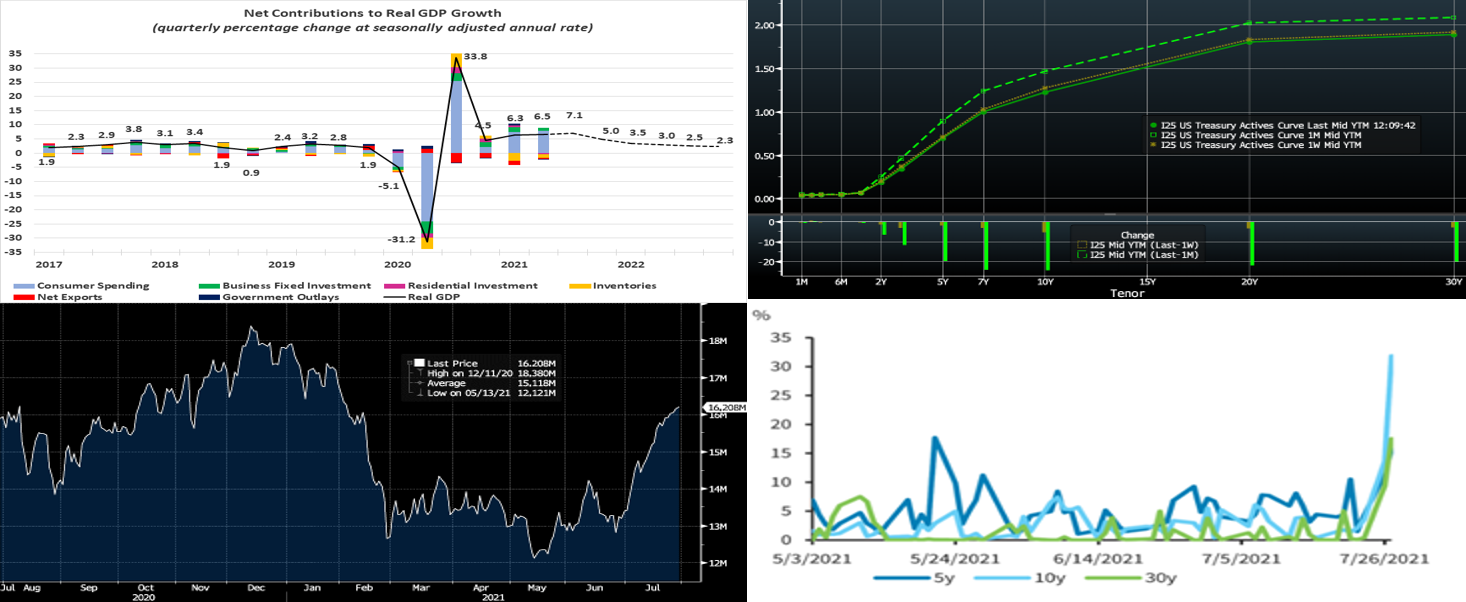
CHART 1 UPPER LEFT
Source: BEA; Bloomberg; FHLBNY. Note: Dotted line represents median forecasts. Real GDP expanded at an annual rate of 6.5% during the spring quarter, little changed from the revised 6.3% clip set in Q1. Two factors accounted for most of the shortfall from the 8.5% jump anticipated by the Street: sharper-than-anticipated inventory drawdowns and a wider foreign trade gap. Consumer spending and business fixed investment were once again the drivers of growth. Key demand metrics remained solid. Excluding the decline in inventories, real final sales climbed by 7.7%. Further reversing the signs on exports and imports, real domestic demand rose by 7.9%. Reflecting already reported data, inflation measures tracked by Federal Reserve policymakers accelerated sharply in Q2. Early projections call for a further pickup in the pace of real business activity during the summer.
CHART 2 UPPER RIGHT
Source: Bloomberg. Note: top pane is yield (%), bottom pane is change (bps). The curve mildly “bull flattened” week-on-week and remains notably lower and flatter from last month. As of midday Friday, UST yields week-over-week were 1 to 3 bps lower out to 5-year, led by the 4 to 5-year sector, and then ~5 bps lower in the 10-year. The very long end was also a few bps lower. The main event of the week was Wednesday’s FOMC release and press conference. The Fed essentially relayed that notable economic progress has been made, but it would like to see further progress toward the goal of maximum employment. While no changes were announced, the Fed has engaged in discussions on the timeline of tapering its securities purchases. Rates slightly bounced higher on this news but later subsided, as the market has, at this stage, taken the taper topic in stride and expects an announcement in Fall with a late-year commencement of actual and gradual tapering. As mentioned in previous editions, members with term borrowing interest/potential can take advantage of intraday/intra-week dips in rates to lock in more attractive rates; please engage the desk for color and guidance and note that live Advance rates are available well before the Daily Rate Sheet hits your inbox each morning.
CHART 3 LOWER LEFT
Source: Bloomberg. Portrayed here is the Bloomberg-Barclays Global Aggregate Market Value (in $USD) of Negative Yielding Debt. It has risen notably since late-winter/spring to ~$16.2trn. A contributing factor to the recent decline in US yields is that persistently low and/or negative levels of global yields continue to support foreign investor demand for US fixed income instruments.
CHART 4 LOWER RIGHT
Source: DTCC; Barclays Research. The transition away from Libor in derivatives is accelerating. This past week the derivatives market adopted a “SOFR First” initiative for inter-dealer trades. SOFR First is part of a series of recent developments in the transition to SOFR in derivatives and has been welcomed/endorsed by relevant regulatory and Reference Rate working groups. The chart here reflects that the share of SOFR-swaps volumes relative to that of Libor-swaps spiked on Tuesday. There was also an increase in longer-dated SOFR-swaps volumes relative to previously prevailing levels. An increased SOFR-swaps trading trend was sustained through the week. Meanwhile, on Thursday the Alternative Reference Rates Committee, a Fed-backed body overseeing the transition away from Libor, said it will formally recommend CME Group’s forward-looking term structure tied to SOFR, a development that should increase usage and trading of SOFR. We encourage members to keep abreast of SOFR news and to explore our SOFR product offerings.
FHLBNY Advance Rates Observations
Front-End Rates
- Short-end Advance rates finished mostly unchanged to a bp lower on the week. Money Market Funds’ AUM increased by ~$15bn this past week, thereby adding demand for paper. The overall supply/demand paradigm persists in suppressing rate levels, as the GSEs continue to invest larger sums into money markets, the TGA continues its decline, and short-maturity paper is in short supply. The Fed’s RRP facility continues to experience strong demand. In a more recent development, state and local governments have received federal disbursements from the most recent relief bill and are parking funds in short-term investment “placeholders”. For any members experiencing such municipal deposit inflows, consider our Refundable Municipal Letter of Credit product; please call the Member Services Desk to discuss.
- UST issuance overall is now net positive supply in that more is being issued than what the Fed is buying in its programs. However, with short UST rates at rock-bottom levels and the Fed on hold for a long period, rates are likely to persist in a near-term sideways pattern. Importantly, weekly net T-bill issuance has been lower since 2020 and negative in recent months, and Treasury intends to shift issuance out the curve. Moreover, the looming federal debt ceiling may further constrain issuance. More legislative packages and related borrowing may lead to an eventual increase of T-bill auction sizes and positive net supply, but for now overall market supply/demand dynamics should keep short rates in check from large moves to the upside.
Term Rates
- The Advance rate curve bull flattened from a week prior. Rates out to 5-year were unchanged to ~2 bps lower, led by the 4/5-year area; rates 6-year and longer were 5 to 7 bps lower, led by the longer maturities. Kindly refer to the previous section for further color on relevant market dynamics.
- On the UST supply front, this week brings a reprieve in auctions. A further uptick in corporate bond issuance is likely post-earnings releases. The week’s main event should be Friday’s jobs report which will provide an update on the space that the Fed is watching most closely prior to any withdrawal of accommodation.
Product Enhancement Alert: FHLBNY this past week announced an enhancement to the Callable Adjustable Rate Credit Advance (“Callable ARC”). The product features a 1-time call/cancel option (member’s option) to extinguish funding early at no cost via two distinct option structures, thereby giving members flexibility in meeting the demands of a fluctuating balance sheet. Given the shorter-term nature of the current borrowing environment, the minimum term for the Callable ARC has been lowered to 4-month (from the previous 7-month) for our 1-month-left-to-maturity call option (SOFR or 1-month Libor index available) to better meet our members’ needs. Meanwhile, the 3-year Non-Call 2-year product for SOFR continues to be offered to members for their longer-term needs.
New Product Alert: In order to satisfy member needs and provide greater product flexibility to match bond and derivative market conventions, FHLB-NY now offers SOFR-linked advances based on SOFR-index compounding. Note that this product is in addition to SOFR-linked advances based on SOFR-index averaging which have been offered since November 2018.
The Symmetrical Prepayment Advance Feature
With rates at or near multi-year lows, it is a compelling juncture to use the SPA feature on term advances. This feature allows member to capture, at prepayment, changes in the Fair Value of the advance which are favorable to the member. Contact us to discuss.
Looking for more information on the above topics? We’d love to speak with you!
Questions?
If you wish to receive the MSD Weekly Market Update in .pdf format (includes FHLBNY rate charts) or to discuss this content further, please email the MSD Team.
Special Member Alert
The FHLBNY recently announced a newly expanded and flexible Disaster Relief Funding (DRF) advance program which offers discounted rate advances with maturities 1-mo and greater. Additionally, we have announced that PPP loans will be accepted as eligible collateral. Please contact us with any questions.