Member Services Desk
Weekly Market Update
This MSD Weekly Market Update reflects information for the week ending October 13, 2023.
Economist Views
Click to expand the below image.
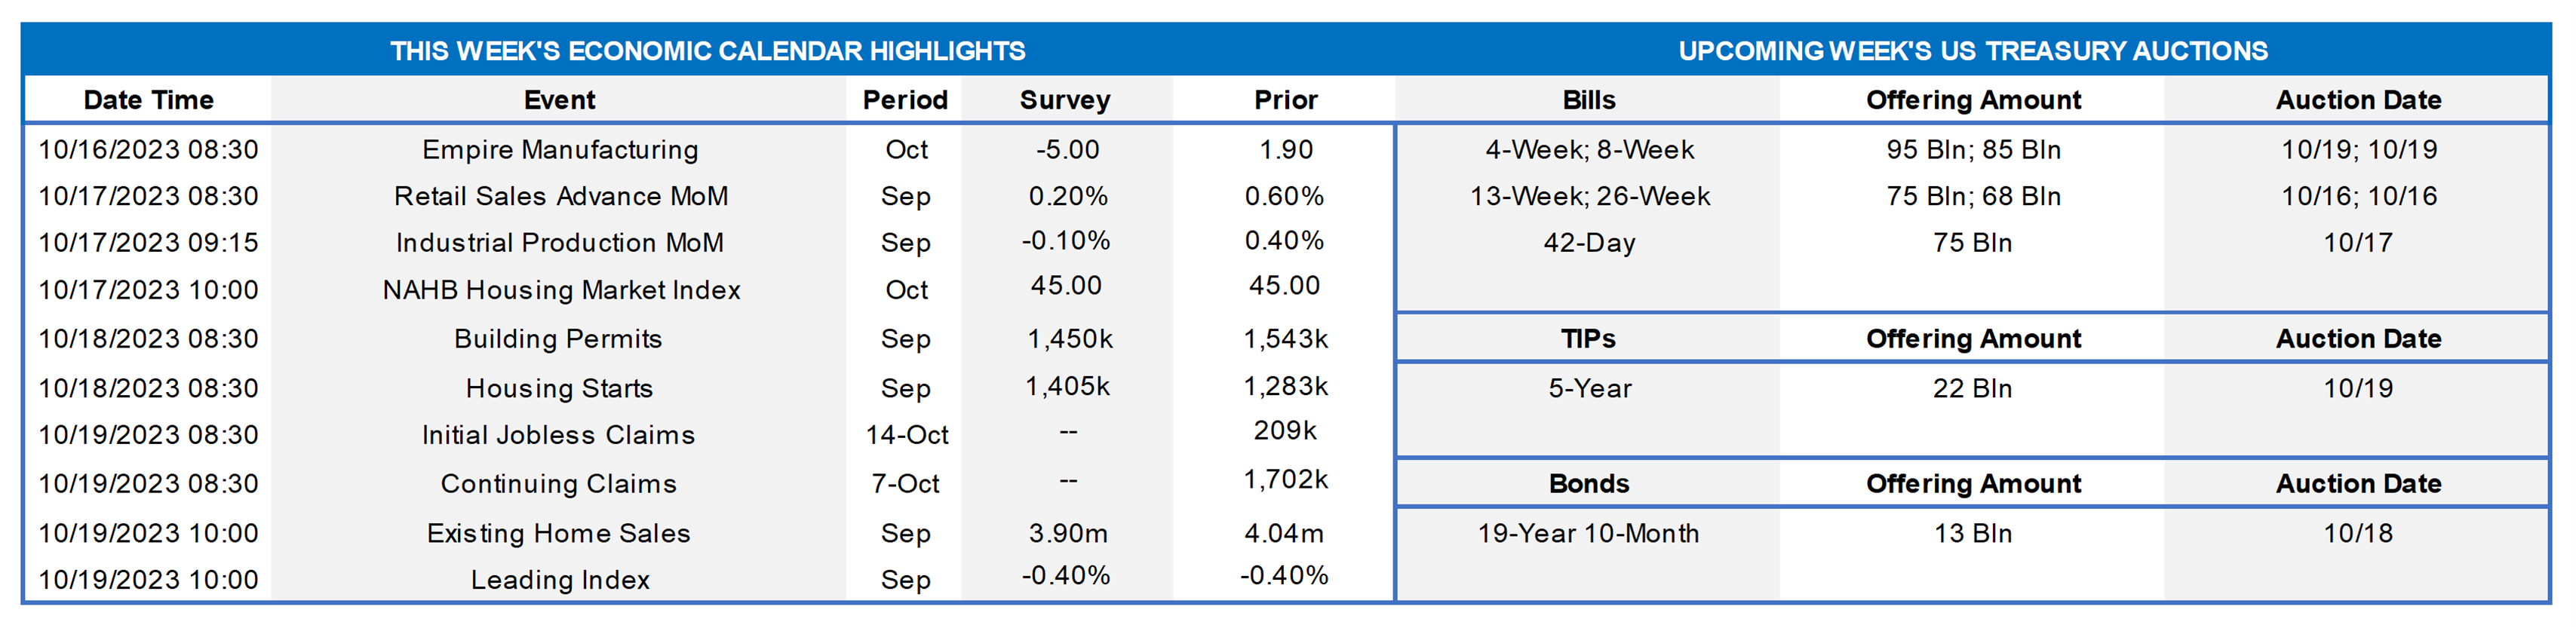
Market participants will contend with a busy economic data calendar and appearances by Fed officials this week. Reports on retail sales, industrial production, and new residential investment will allow economists to finalize their projections for Q3 real GDP growth. The consensus projection currently calls for an acceleration from a 2.1% annualized clip to 3%. Of note, the Atlanta Fed’s tracking estimate, which accurately predicted the Bureau of Economic Analysis’ initial Q1 and Q2 prints, is calling for a steamy 4.9% advance. A dozen talks by monetary policymakers, mostly FOMC voters, will be scrutinized following the September employment and inflation reports. The Beige Book summary of economic conditions will provide useful color on developments in the FHLB-NY District.
Empire State Manufacturing Survey: Activity in NYS probably expanded further in early October, with the net percentage of respondents experiencing a pickup less than those witnessing a decline improving on the prior month’s 1.9% reading.
Retail & Food Services Sales: Sales likely climbed by .5% in September. Excluding an anticipated .9% rise in auto-dealer revenues, retail purchases are expected to have climbed by .4%, following a .6% prior-month rise. Pay attention to so-called “control” sales, excluding auto, building materials, and gas purchases, for clues to the pace of consumer spending during Q3. Barring any prior-month revisions, a .3% increase would leave core purchases over Q3 at 5.3% annualized above their Q2 average, after a comparatively modest 2% annualized Q2 gain.
Industrial Production & Capacity Utilization: Powered by a projected pickup in nationwide factory output, industrial production probably rose by .5% in September, after a .4% increase in August. With output gains expected to outpace additions to capacity during the reference period, the overall operating rate likely moved two ticks higher to 79.9% – the highest reading since last November.
NAHB Housing Market Index: Markedly higher mortgage rates and dwindling supply likely left this sentiment gauge in negative territory, following the 45-point reading recorded in September.
Housing Starts & Building Permits: Buoyed by unusually warm and dry weather conditions in September, the number of building permits issued, and housing units started probably eclipsed the respective 1.45mn and 1.41mn annualized rates anticipated by the Street.
Jobless Claims: Hinting at yet another solid jobs report, initial claims for unemployment benefits probably remained in a historically low 200-210K range during the filing period ended October 14.
Existing Home Sales: A sharp falloff in home-purchase contract signings over the July-August span suggests that closings on existing dwellings dropped by 3.5% to a nearly 20-year low SAAR of 3.9mn in August. With the number of homes on the market expected to contract by 3.6% to 1.06mn on a not seasonally adjusted basis during the period, the months’ supply at the estimated sales pace would remain unchanged at 3.3 months.
Index of Leading Economic Indicators: The Conference Board’s augur of prospective economic activity is expected to have fallen by .4% in September, after a .3% dip in August, continuing a string of uninterrupted declines going back to April 2022. Despite its continuing weakness, the St. Louis Fed placed the probability that the economy was contracting in August at a negligible .2%.
Federal Reserve Appearances:
- Oct. 16 Philadelphia Fed President Harker to speak on the outlook at the MBA’s Annual Convention and Expo.
- Oct. 18 New York Fed President Williams to participate in a moderated discussion at Queens College.
- Oct. 18 Federal Reserve to release Beige Book summary of economic conditions.
- Oct. 19 Fed Chair Jerome Powell to speak at the Economic Club of New York.
- Oct. 19 Dallas Fed President Lorie Logan to speak at a Money Marketeers of New York University event.
- Oct. 20 Philadelphia Fed President Harker to speak on the outlook at a local risk management association meeting.
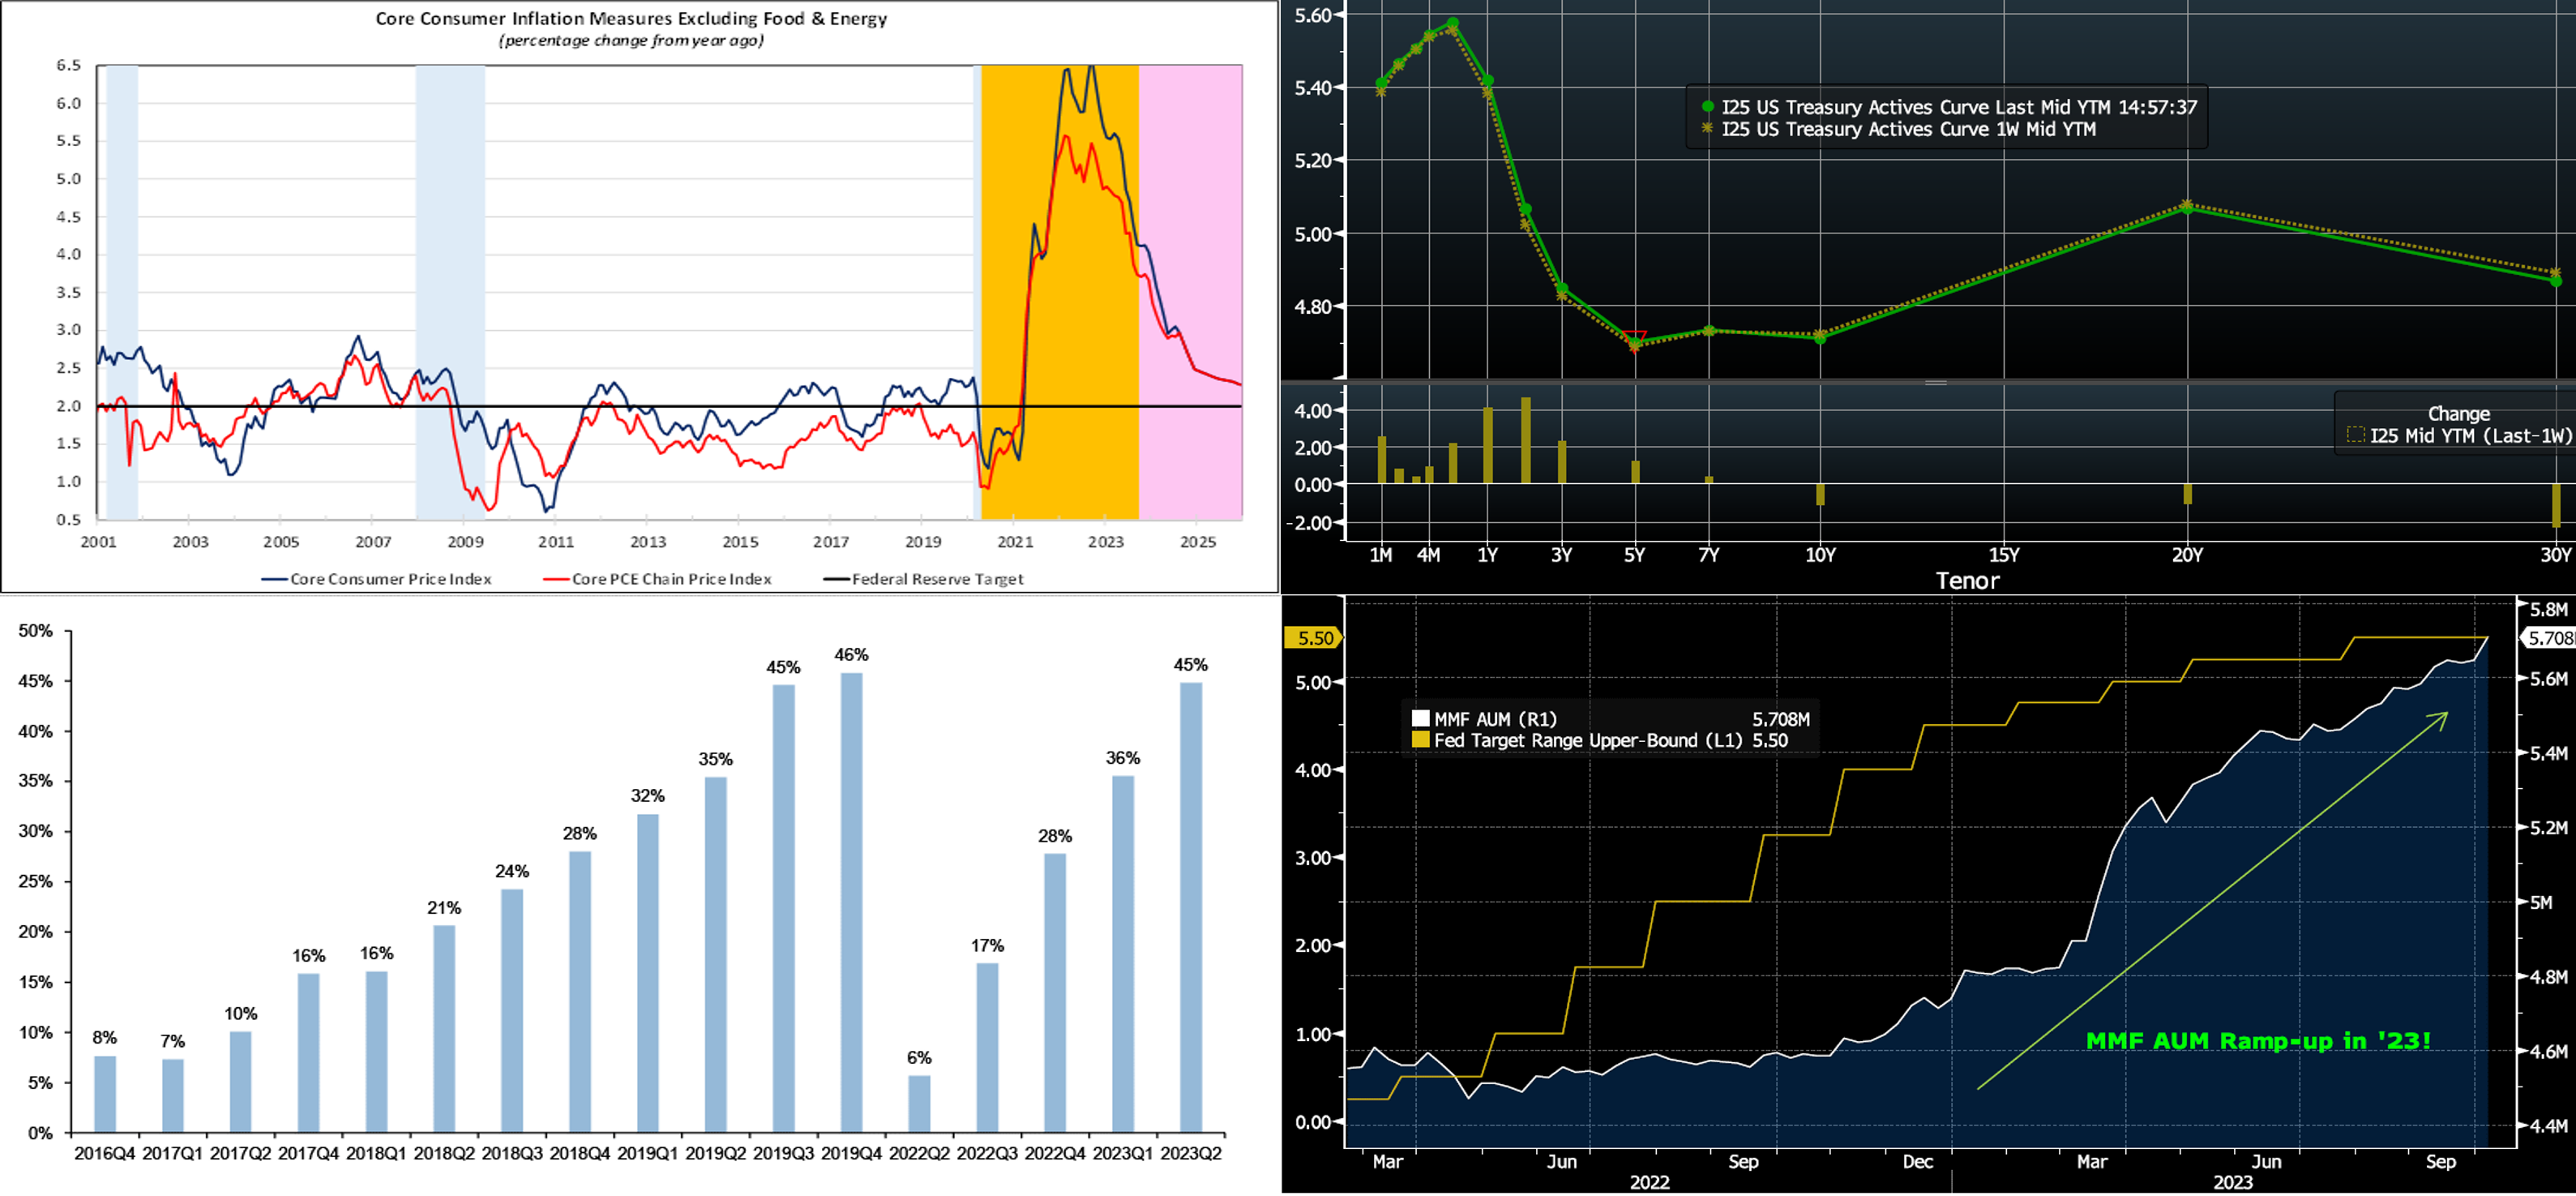
CHART 1 UPPER LEFT
Source: Bureau of Labor Statistics; Bureau of Economic Analysis; Federal Reserve Board; National Bureau of Economic Research; FHLB-NY. Notes: Blue-shaded areas denote recessions, Orange highlights the current economic expansion, Pink contains projections. The year-to-year growth rates of the overall and core Consumer Price Indexes (CPI) were 3.7% and 4.1%, respectively, in September. While well below their respective peaks of 9.1% and 6.6% in 2022, there remains considerable progress to be made to return consumer-price inflation to the Fed’s 2% target. Indeed, the Summary of Economic Projections issued following last month’s FOMC meeting revealed that policymakers anticipate steady future progress over the next two years but will not achieve the desired result until sometime in 2026.
CHART 2 UPPER RIGHT
Source: Bloomberg. Top pane is yield (LHS, %), bottom pane is change (LHS, bps). From last Thursday afternoon to this one, the UST curve was relatively unchanged, with a few bps increase in shorter tenors but a few bps drop in longer maturities. Returning from the long weekend, the market met some flight-to-quality buying owing to the Israel conflict. While Thursday’s slightly higher-than-expected CPI data served to push yields notably higher from the day prior, yields have nonetheless retraced from the decades-high levels of the week prior. In terms of market-implied pricing of the Fed, the 2023 peak Funds rate in December now stands at ~5.434%; essentially, the market is pricing a bit below the Fed’s dot plot with only ~41% chance of another 25 bp hike this year. The years 2024 and 2025 increased somewhat from a week ago, with the year-end 2024 forward ~5 bps higher, at 4.61%.
CHART 3 LOWER LEFT
Source: JP Morgan; S&P Capital IQ. Notes: Data from banks of $30bn or more asset size. Shown here is a historical view of the change in banks’ cumulative deposit beta to Fed hikes. While overall deposit levels have stabilized greatly and broadly since last March, the cost of deposits has not, and so its increases pose ongoing challenges for banks’ NII and NIM figures. Given competitive market conditions and a Fed considering further hikes and/or a higher-for-longer posture, it would not be surprising for betas to surge up and through 50% for Q3. As always, we remind members to always factor in the FHLB-NY dividend to their funding alternatives decisions; kindly contact us at the Member Services Desk to obtain our “All-in Rate Borrowing Tool” which calculates and illuminates the dividend’s impact.
CHART 4 LOWER RIGHT
Source: Bloomberg. Here is an updated look at Money Market Fund (MMF) AUM. In the current cycle, MMFs have and continue to be a major competitor to bank deposits. And AUM (RHS, white, $trn), last ~$5.7trn, has continued to rise and hit ever higher record levels, with a notable surge in 2023 after the Fed’s initial series of hikes (LHS, gold, %). This dynamic appears set to persist, as long as the Fed is either hiking and/or in a higher-for-longer cycle.
FHLBNY Advance Rates Observations
Front-End Rates
- Short-end rates ticked higher by 1 to 5 bps week-over-week, led by the 3-month-and-in tenors. Maturities have crossed further into upcoming FOMC dates and potential hikes. Net T-bill supply remains positive, given announcements from the Treasury regarding upsized auctions and issuance needs. But the supply continues to be absorbed relatively well, as Money Market Funds (MMFs) switch from the Fed’s RRP to T-bills with competitive yields. Moreover, FHLB supply has subsided from peak levels of spring, further assisting T-bill interest from investors and thereby containing any severe upward pressure on rates from T-bill supply. MMFs currently stand at or near all-time high AUM levels.
- The upcoming week’s heavy slate of data and Fedspeak should drive direction near-term.
Term Rates
- The longer-term curve, generally mirroring the moves in USTs and swaps, slightly bear flattened week-over-week, with shorter tenors up a few bps and longer ones minimally changed to unchanged. We continue to experience keen demand for putable advances, with the early-week retreat from the recent yield highs serving to generate an uptick in interest. Kindly refer to the previous section for relevant market color. Please call the Member Services Desk to learn more about this and/or other products.
- On the UST term supply front, the upcoming week serves a 20-year nominal and a 5-year TIPS auction. Note that UST auctions usually occur at 1pm and can cause volatility around that time. Please contact the Member Services Desk for further information on market dynamics, rate levels, or products.
Price Incentives for Advances Executed Before Noon – In effect as of Tuesday, September 5, 2023 – The FHLB-NY is pleased to now offer price incentives for advances executed before Noon each business day. These pricing incentives offer an opportunity to provide economic value to our Members, while improving cash and liquidity management for the FHLBNY. For further details, kindly refer to the bulletin.
Forward Start Advance (FSA): For members with upcoming borrowing or refunding plans, consider the FSA as a method to opportunistically “lock in” rates before advance settlement date. Please contact the Member Services Desk at (212) 441-6600 for more information.
The Symmetrical Prepayment Advance Feature
For those anticipating term funding needs, and with rates on an uptrend, it can be an appropriate juncture to consider our SPA feature. This feature allows the member to capture, at prepayment, changes in the fair value of the advance which are favorable to the member. Contact Member Services Desk to discuss.
Looking for more information on the above topics? We’d love to speak with you!
Questions?
If you wish to receive the MSD Weekly Market Update in .pdf format (includes FHLBNY rate charts) or to discuss this content further, please email the MSD Team.