Member Services Desk
Weekly Market Update
This MSD Weekly Market Update reflects information for the week ending January 20, 2023.
Economist Views
Click to expand the below image.
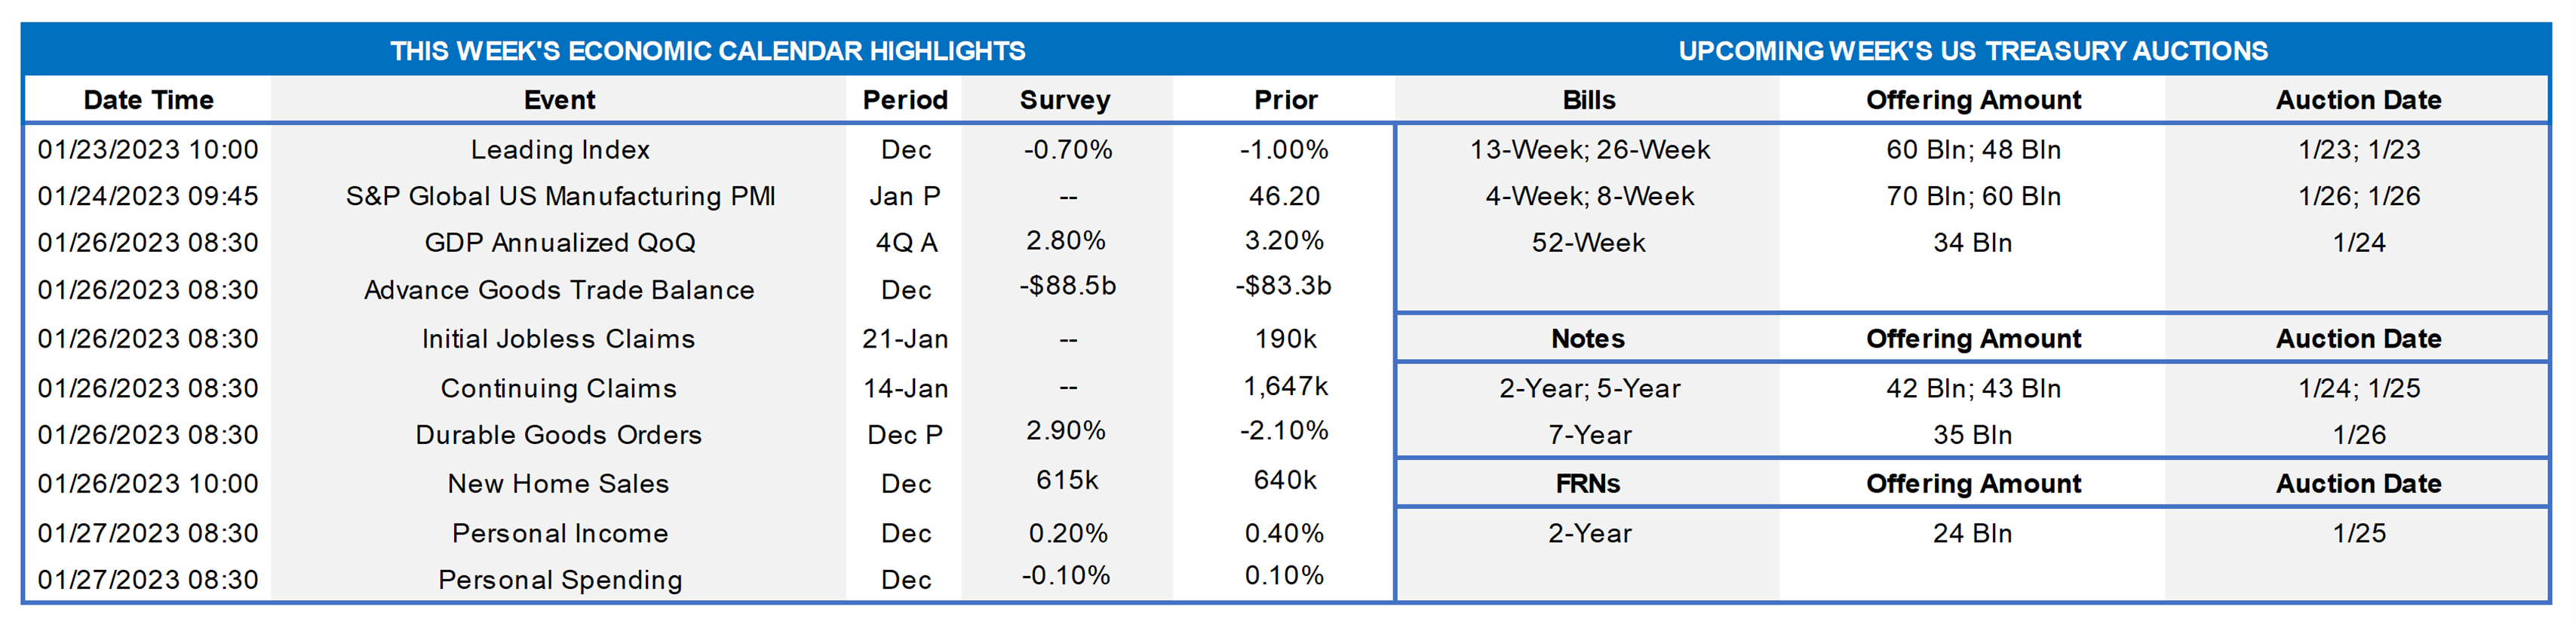
Attentions of market participants will steer squarely on the economic release calendar this week, with monetary policymakers observing the traditional blackout period before the January 31-February 1 Federal Open Market Committee meeting. The marquee report will undoubtedly be the Bureau of Economic Analysis’ first pass at Q4 real GDP growth. The median economist projection calls for a marginal slowdown to an annualized clip of 2.8% during the fall quarter from the 3.2% pace set over the July-September span. The range of estimates is quite wide, however, extending from a 2.0% rise to a solid 3.5% gain. Stepped-up consumer spending, business fixed investment, and inventory building are expected to fuel the anticipated increase. Reflecting recent monthly reports, key inflation gauges probably slowed on an annualized basis from those posted during the summer.
Leading Indicators: Continuing the string of consecutive declines since last March, the Conference Board’s barometer of prospective economic activity is expected to have fallen by .7% in December.
Merchandise Trade Balance: The merchandise trade deficit likely widened to $88.5bn in December, following the $82.9bn shortfall recorded in November. With import costs rising and export prices falling during the reference period, the anticipated drag on Q4 real GDP growth may be quite limited.
Jobless Claims: Initial claims for jobless benefits likely rebounded during the filing period ended January 21, after the prior week’s unexpectedly low 190K tally, but should remain in the recent 205-225K range. Keep an eye on continuing claims, which registered below the 1.7mn mark for a third week during the period ended January 6, for any signs that recently furloughed employees are having a slightly more difficult time finding work.
Durable Goods Orders: Powered by an aircraft-led jump in transportation equipment bookings, durable goods orders likely climbed by 2.9% in December – the largest increase since the 3.1% gain witnessed at the beginning of 2022. Net of the anticipated strength in transport requisitions, “hard goods” bookings likely dipped by .1%, erasing the modest prior-month rise. Pay particular attention to core nondefense capital goods shipments for clues to any momentum in business equipment spending heading into the New Year.
New Home Sales: Last month’s falloff in single-family building permit issuance suggests that new home sales slipped by 4.7% to a seasonally adjusted annual rate of 610K in December, reversing all but a fraction of November’s surprising 5.8% jump.
Pending Home Sales: Recent reductions in mortgage interest rates may have boosted contract signings in December, ending the 18.5% falloff posted over the July-November span.
Federal Reserve Appearances: None, owing to pre-FOMC blackout.
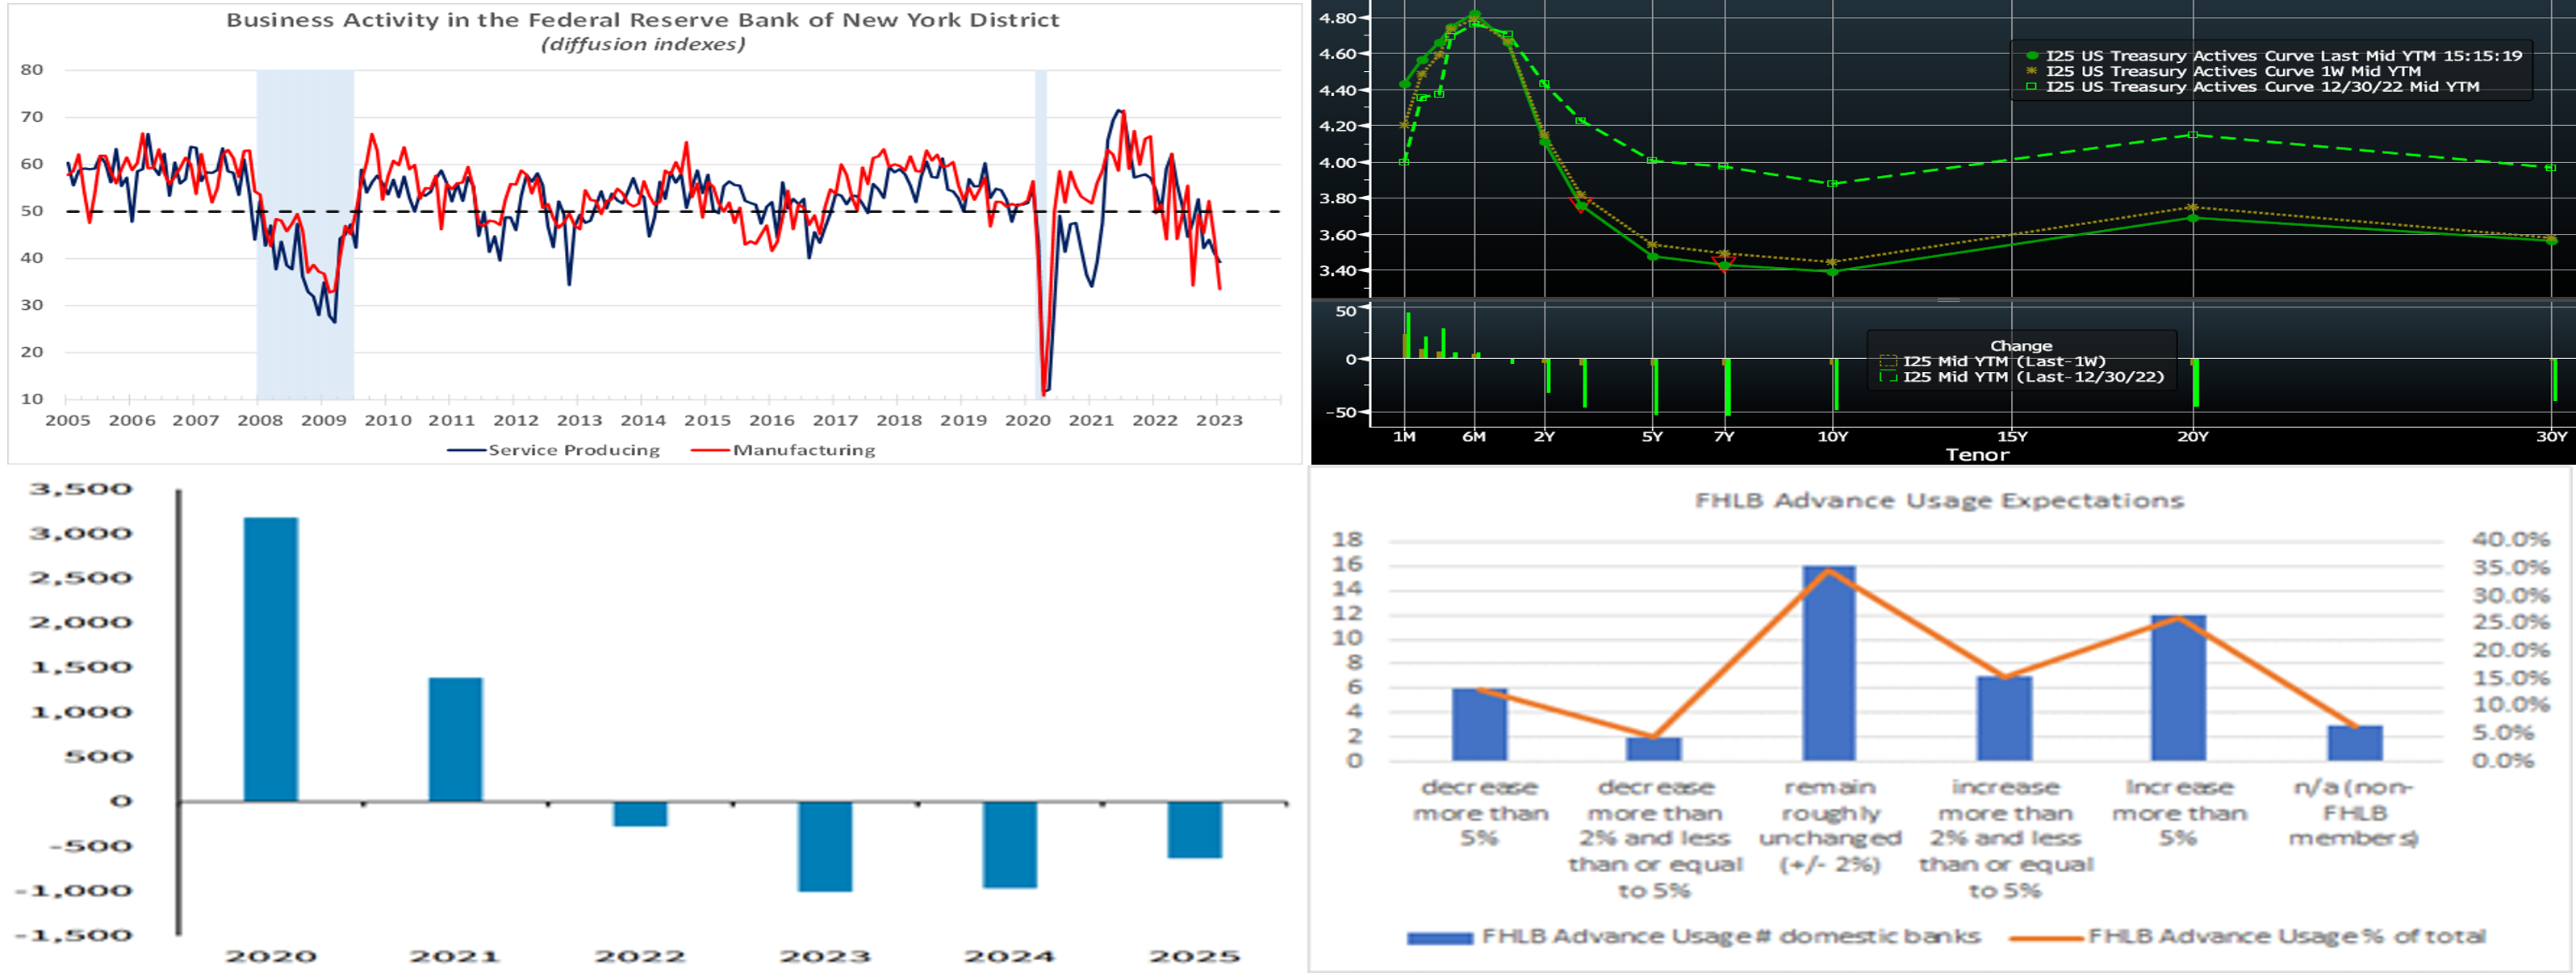
CHART 1 UPPER LEFT
Source: Federal Reserve Bank-New York; National Bureau Economic Research; FHLB-NY. Notes: Shaded areas denote recessions; diffusion indexes equal the percentage of firms experiencing an increase in activity plus one-half of those witnessing no change. The FRB-NY’s Beige Book commentary, prepared in advance of the upcoming FOMC meeting and released the past week, indicated that economic activity in the Second District declined significantly in early January and that most business contacts do not expect it to increase in the coming months. Input prices continued to rise but have slowed noticeably, while selling price hikes have moderated somewhat. Hiring has slowed and wage growth has remained modest, yet businesses reported that they plan to add staff, on balance, in the months ahead. Consumer spending was mixed but somewhat weaker overall, while tourism remained strong. Home-purchase and rental markets showed further signs of cooling, although concerns about housing affordability remain widespread. Commercial real estate markets stabilized, but construction activity has remained sluggish. Financial-sector conditions were generally steady, but regional banks reported widespread declines in loan demand, ongoing tightening in credit, and rising delinquency rates.
CHART 2 UPPER RIGHT
Source: Bloomberg. Top pane is yield (LHS, %), bottom pane is change (bps). UST yields moved lower again week-over-week, with the 5-year leading the way with a ~7 bps decline. The 10-year hit its lowest yield since September. While a few FOMC members again this week advocated for a slower pace, i.e. 25 bps, of hikes at forthcoming meetings, others cited the need to get to 5-5.25% as soon as possible and that it was too soon to end hikes. Meanwhile, the market persists in underpricing that 5 to 5.25% zone, as evidenced in its pricing for the peak (~4.88%) in the Fed Funds effective to be in summer 2023 and then descending ~50bps into the close of the year. For the end of 2024, market pricing reflects a rate of ~2.73%, about 9 bps lower than a week ago. The market apparently signals that it believes inflation is on the downtrend and/or a growth slowdown or mild recession could loom this year. Indeed, except for jobs-related measures that remain on the strong side, data again this week generally reflected that inflationary forces and growth prospects are ebbing. These dynamics and possible concerns over the debt ceiling helped drive the move lower in term yields this week. For the upcoming February 1 FOMC, the market fully prices for a 25 bps hike but for a minimal (~2%) chance of a 50 bps hike.
CHART 3 LOWER LEFT
Source: Federal Reserve Board; Barclays Research. Perhaps forgotten, at least relative to the constant attention paid to Fed hikes, is the ongoing reduction (“Quantitative Tightening”) of the Fed’s balance sheet. At a current program pace of $60bn UST and $35bn MBS runoff of holdings per month, its balance sheet will shrink by nearly $3trn by 2025, as seen here (LHS, annual change $bn). The Fed can adjust this pace by changing the runoff caps, which will be guided by evolving dynamics in funding market pressures and banks’ demand for reserves. This runoff pace is much faster than in 2017-19 when it took nearly 20 months for the Fed’s balance sheet to shrink by $500bn. This balance sheet normalization essentially removes cash/liquidity from the banking system.
CHART 4 LOWER RIGHT
Source: Federal Reserve; FHLB-NY. As a result of the preceding topic and declining deposits, banks’ usage of wholesale/alternative funding sources has increased in the past year. And, according to a recent Fed Senior Financial Officer survey from late November, banks’ expectations of FHLB advance usage in the next six months reflected a likely ongoing and increased usage of this funding source. Out of 43 banks which are FHLB members, 35 (~81%) cited an expectation to remain roughly unchanged or increase usage, with ~54% expecting an increase. For further information on this survey, click here.
FHLBNY Advance Rates Observations
Front-End Rates
- Short-end rates moved lower over the past week, partly owing to an easing of volatile supply/demand technical dynamics in T-bill and discount note markets and partly to the market very slightly reducing pricing of Fed rate hikes. Please see the previous section for more specific Fed-pricing color. Rates were down by 5 to 11 bps, led by shorter tenors.
- Given the Fed’s tightening and data-dependent posture, rates will remain responsive to economic data this upcoming week, especially given the Fed blackout period before the Feb. 1 FOMC.
Term Rates
- The longer-term curve again finished lower from a week ago, with the 3 to 10-year sector ~10 bps lower on average and 2-year ~3 bps lower. Kindly refer to the previous section for relevant market color. The advance curve remains inverted out to 5-year, thereby offering opportunities to extend in advance duration for minimal or lower coupon cost. The flat curve and still relatively high implied volatility environment also can serve to make putable advances more compelling.
- On the UST term supply front, this upcoming week carries 2/5/7-year auctions. Corporate bond issuance is likely to maintain its early-year heady pace. Supply has been easily absorbed this month, owing to strong fixed income demand. Kindly call the Member Services Desk for information on market dynamics, rate levels, or products.
Product Alert: FHLBNY is pleased to announce the reintroduction, after a temporary suspension owing to Libor-cessation, of the Putable Advance, Fixed-Rate with SOFR Cap Advance, and ARC with SOFR Cap/Floor Advance. The Callable Advance continues to be offered. This expansion of the product menu will provide members with more options and flexibility for the management of funding and/or hedging needs.
Forward Start Advance (FSA): For members with upcoming borrowing or refunding plans, consider the FSA as a method to opportunistically “lock in” rates before advance settlement date. Please contact the Member Services Desk at (212) 441-6600 for more information.
The Symmetrical Prepayment Advance Feature
For those anticipating term funding needs, and with rates on an uptrend, it can be an appropriate juncture to consider our SPA feature. This feature allows the member to capture, at prepayment, changes in the fair value of the advance which are favorable to the member. Contact Member Service Desk to discuss.
Looking for more information on the above topics? We’d love to speak with you!
Questions?
If you wish to receive the MSD Weekly Market Update in .pdf format (includes FHLBNY rate charts) or to discuss this content further, please email the MSD Team.