Member Services Desk
Weekly Market Update
This MSD Weekly Market Update reflects information for the week of April 26, 2021.
Economist Views
Click to expand the below image.
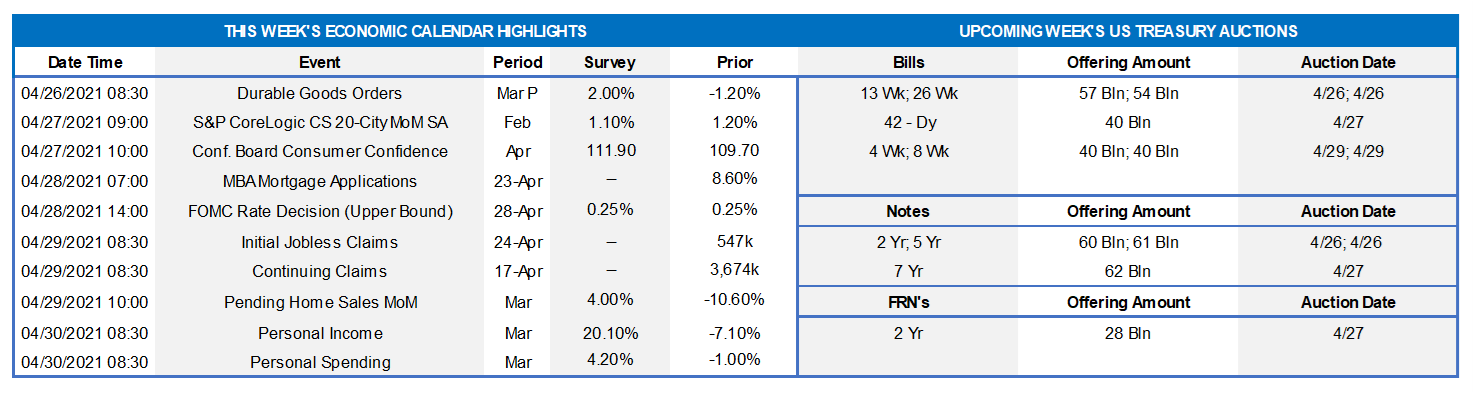
Durable Goods Orders: Durable goods bookings are expected to have risen by 2.3% last month, more than offsetting February’s 1.2% decline. March’s non-defense capital goods shipments excluding commercial jetliner deliveries will allow economists to finalize their forecasts for business equipment spending ahead of the advance report on Q1 real GDP growth.
S&P CoreLogic Case-Shiller (SPCLCS) 20-City Home Price Index: Home prices likely remained on an uptrend in the twenty major metropolitan areas included in the SPCLCS survey. Indeed, the 1.1% increase anticipated by the Street in February, if realized, would place home selling prices a hefty 11.8% above the level prevailing twelve months earlier.
Conference Board Consumer Confidence: Sizable improvements in weekly sentiment soundings suggest that the Conference Board’s Consumer Confident Index probably climbed to 119.5 in April from 109.7 in March. That projection, if realized, would mark the rosiest reading since the 132.6 posted in February 2020 before the pandemic struck. Pay particular attention to the so-called labor differential – the percentage of survey respondents feeling that jobs are plentiful less those believing they are hard to get – for clues to the likely change in the unemployment rate this month.
Jobless Claims: Initial and continuing claims under regular state unemployment insurance programs likely moved lower during their respective reporting periods. Those figures continue to understate the adverse impact of the pandemic and the slow healing of the domestic labor market, however. Indeed, as of April 3, a little over 17.4mn persons were receiving some sort of unemployment assistance, down from the pandemic peak of 32.4mn hit last June but still well above the level prevailing before the healthcare crisis began over a year ago.
Pending Home Sales: The number of homes entering contract nationwide are projected to have climbed by 4.5% in March, reversing a portion of February’s 10.6% weather-induced dive. Despite the anticipated rebound, the prior-month weakness suggests that existing home sales will decline to a nine-month low of 5.9mn in the National Association of Realtors’ April report.
Personal Income & Spending: Powered by federal stimulus payments from the American Rescue Plan Act, personal income probably soared ~22% in March – the largest single-month rise on record. The 3.8% rise in real consumer outlays anticipated by the consensus, if realized, would place inflation-adjusted outlays roughly 8.5% annualized above their Q1 average, pointing to significant spending momentum heading into the spring quarter.
Federal Reserve Appearances:
Apr. 28: FOMC monetary policy statement.
Apr. 28: Federal Reserve Chair Powell press conference.
Apr. 29: Fed Vice Chair for Supervision Quarles to discuss financial regulation at an Options Clearing Corp. conference.
Click to expand the below images.
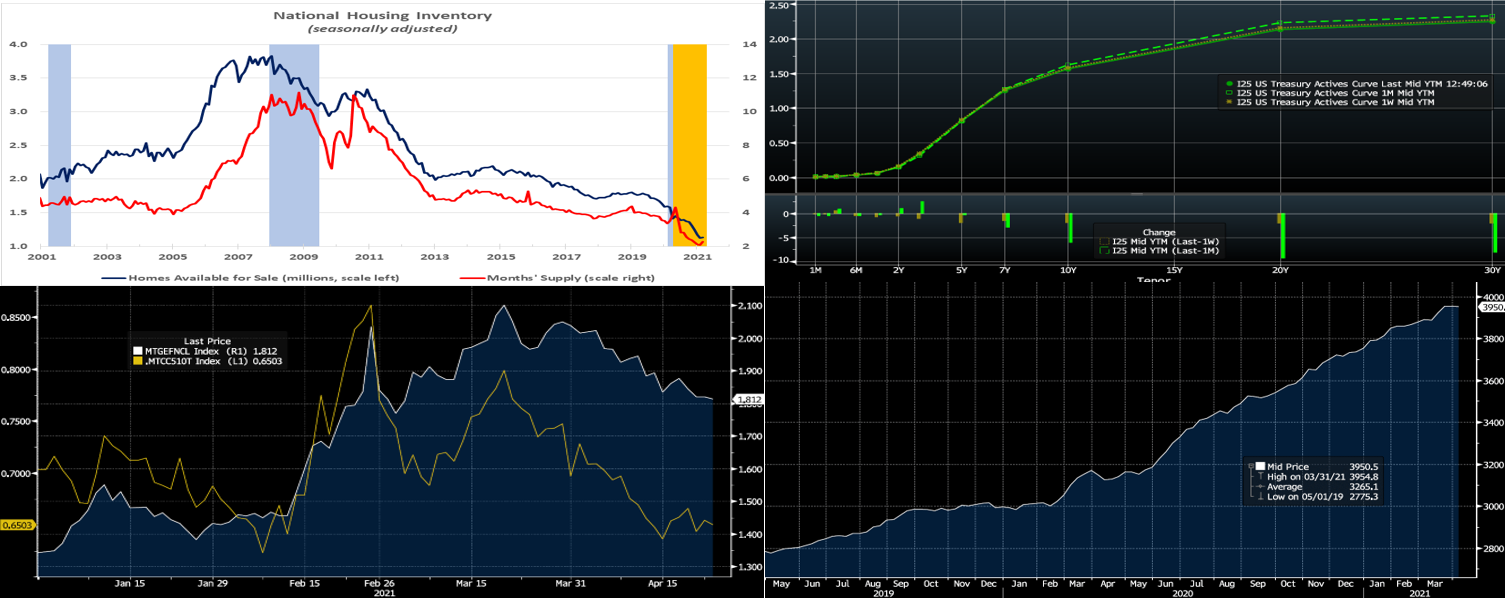
CHART 1 – UPPER LEFT
National Assoc. of Realtors, FHLBNY; blue-shaded areas mark recessions, orange-shaded area marks past year when the probability that the nation was in recession dipped below 1%. The NAR reported that existing home sales declined by 3.7% to a SAAR of 6.01mn in March, following an upwardly revised 6.24mn tally the prior month – the fewest closings since the 5.97mn posted last August. Last month’s resales were below the 6.11mn market expectation, yet well above the 5.8mn foreshadowed by the dip in new contracts over January-February. Resales retreated across the country during the reference period. The stock of homes on the market climbed by 3.9% to 1.07mn, after the record low of 1.03mn touched during the year’s first two months. Along with last month’s sales decline, that increase pushed the months’ supply measure a tick higher to 2.1 months. The dearth of available dwellings amidst solid demand continues to put upward pressure on prices. The national median sales price jumped by 5.9% to $329.1K – 17.2% above the $280.7K of a year ago. The average sales price of $355.2K last month was up 3.8% from February and 12.4% above March 2020’s $316.1K.
CHART 2 – UPPER RIGHT
Source: Bloomberg. Note: top pane is yield (%), bottom pane is change (bps). UST yields again dipped lower week-over-week, in a mild “bull flattener” move. While shorter maturities were barely changed, the curve 4-year and beyond finished a few bps lower. Most of the decrease occurred on Thursday, in a slight flight-to-quality shift, when stocks fell on news of the Biden Administration’s capital gains tax proposal. But the markets reversed this shift on Friday, as the proposal was not truly “new news” and could likely be subject to negotiation and changes. Meanwhile, despite strong economic data during the week, yields remained in a contained range owing to continued foreign and real-money investor buying. Covid-19 variants and some vaccine obstacles (mainly hesitancy at this point) persist, but the thus-far uptick in vaccinations continues to foster economic activity and bolster growth projections which, in turn, are likely to underpin the yield curve. The market will “watch the Fed” this week, but any talk of tapering its asset-purchase program and/or changes to official rates are not expected from the meeting.
CHART 3 – LOWER LEFT
Source: Bloomberg. Market yields have retraced some of Q-1’s rise. Shown here is the MBS Current Coupon yield (RHS, %, computed yield of a par-priced MBS) which has declined over 25 bps from the high of March. Part of the decline has been driven by mortgage spreads (LHS, %, MBS Current Coupon spread to the average of 5 and 10-year UST yield) which have tightened over 20 bps since late February. In turn, mortgage rates for homebuyers have dipped too and are now back to ~3% area. These developments have helped to underpin housing markets and prices.
CHART 4 – LOWER RIGHT
Source: Bloomberg. A contributor to the retracement of yields has been real-money investors, such as banks, buying of securities. Depicted here is the holdings (in $bn) of UST and Agency-issued securities by US commercial banks. These holdings have maintained a notable uptrend and sit near $3.96trn, driven by high liquidity levels and thus-far tepid loan demand in the nascent recovery. Many institutions expect loan demand to accelerate in the second half of the year, and funds are being put to work in the meantime.
FHLBNY Advance Rates Observations
Front-End Rates
Short-end advance mostly finished a bp lower week-over-week. Money Market Funds’ AUM increased by ~$16.2bn on the week, led by a $18.2bn increase in Government-Only funds, thereby infusing demand to the sector. The GSEs are placing larger sums into money markets. And the US TGA, as covered in last week’s report, continues its decline. From a bigger-picture vantage point, the overall moderation in the supply of short paper, relative to high cash levels in the market, is expected to keep short-end rates relatively steady and under downward pressure in the year’s first half.
UST issuance overall is now net positive supply in that more is being issued than what the Fed is buying in its programs. However, with short UST rates at rock-bottom levels and the Fed on hold for a long period, rates are likely to persist in a near-term sideways to softer pattern. Importantly, weekly net T-bill issuance has been lower since 2020 and even negative at times in recent months, and Treasury has announced plans to shift issuance out the curve. The latest relief package and related borrowing may lead to an increase of T-bill auction sizes and positive net supply, but overall market supply/demand dynamics should keep short rates in check on the upside.
Term Rates
On the week, medium and longer-term Advance rates were ~1 to 3 bps lower, led by the longer maturities. Kindly refer to the previous section for further color on relevant market dynamics.
On the UST supply front, this week brings 2/5/7-year auctions. Recent auction sizes have been of record size yet absorbed easily. The market will maintain attention on further Covid-19 and legislative developments this week, while paying special focus on the FOMC meeting.
New Product Alert: In order to satisfy member needs and provide greater product flexibility to match bond and derivative market conventions, FHLB-NY now offers SOFR-linked advances based on SOFR-index compounding. Note that this product is in addition to SOFR-linked advances based on SOFR-index averaging which have been offered since November 2018.
The Symmetrical Prepayment Advance Feature
With rates at or near multi-year lows, it is a compelling juncture to use the SPA feature on term advances. This feature allows member to capture, at prepayment, changes in the Fair Value of the advance which are favorable to the member. Contact us to discuss.
Looking for more information on the above topics? We’d love to speak with you!
Questions?
If you wish to receive the MSD Weekly Market Update in .pdf format (includes FHLBNY rate charts) or to discuss this content further, please email the
MSD Team.
Special Member Alert
The FHLBNY recently announced a newly expanded and flexible Disaster Relief Funding (DRF) advance program which offers discounted rate advances with maturities 1-mo and greater. Additionally, we have announced that PPP loans will be accepted as eligible collateral. Please contact us with any questions.