Member Services Desk
Weekly Market Update
This MSD Weekly Market Update reflects information for the week ending June 23, 2023.
Economist Views
Click to expand the below image.
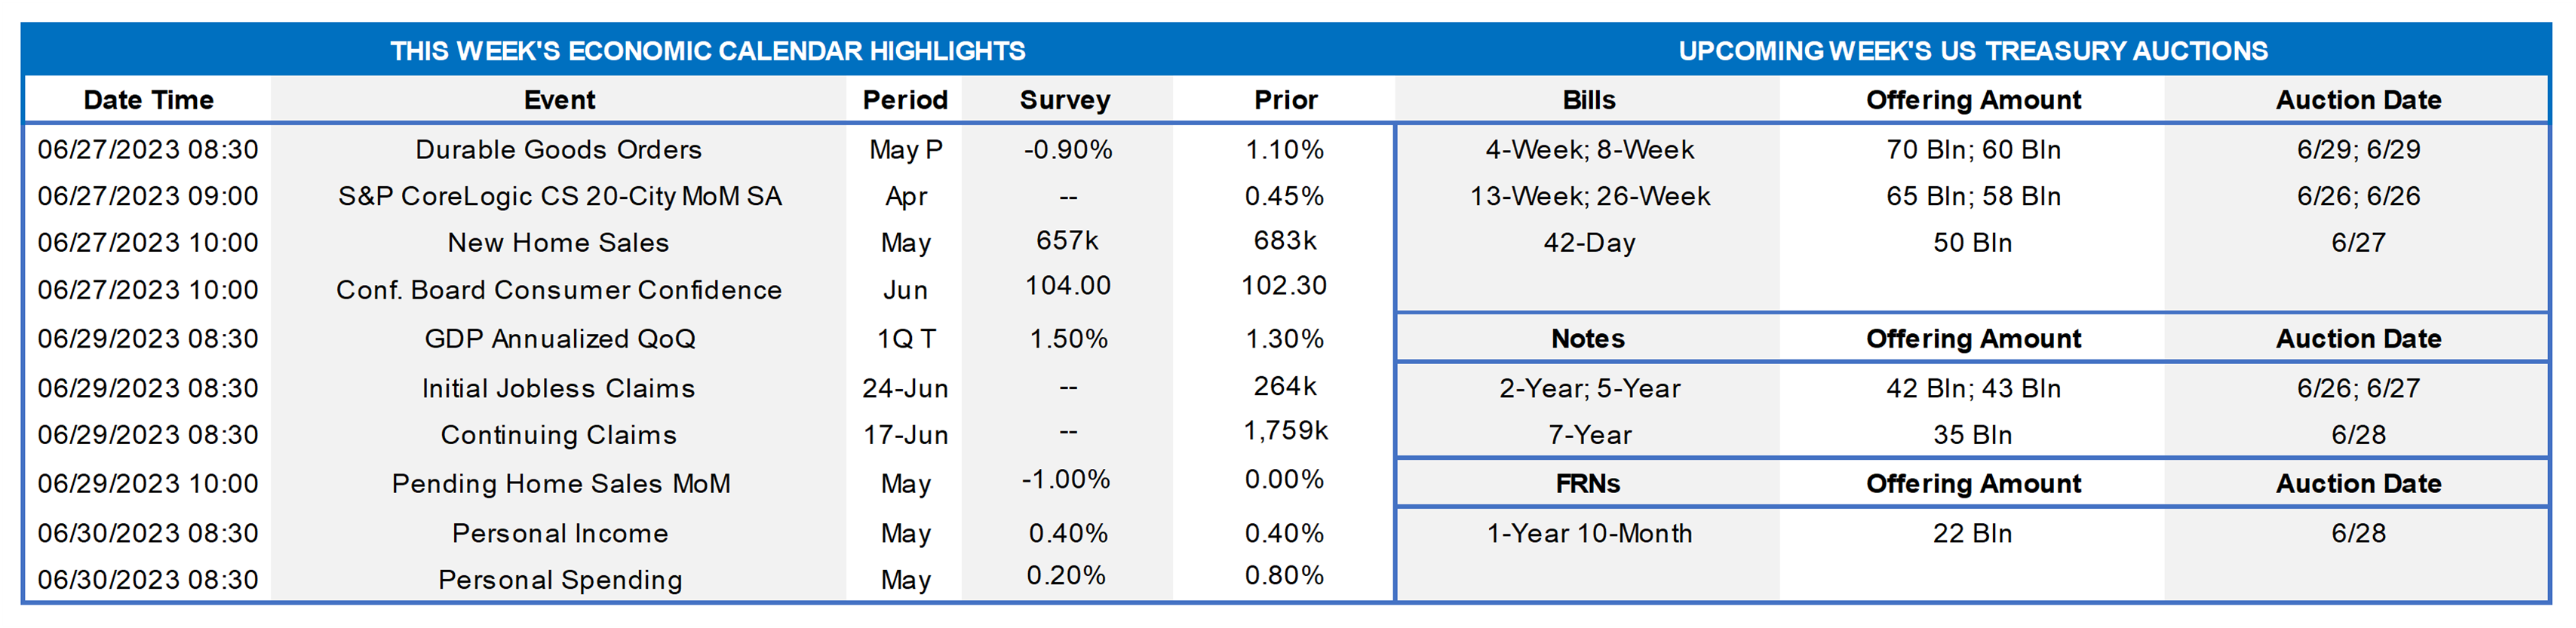
Having weathered Federal Reserve Chair Jerome Powell’s semi-annual Monetary Policy Report to Congress and projections that additional federal funds rate increases may be forthcoming, market participants will now focus on the economic release calendar. Housing soundings are expected to be positive on balance, with selling prices and sales of new dwellings posting gains. Durable goods orders probably retreated last month while the merchandise trade gap closed. Government statisticians are expected to report that growth during the winter quarter was stronger than previously estimated. Alternative survey data suggest that consumer sentiment improved markedly as the spring quarter ended.
Durable Goods Orders: Prompted by an aircraft-led falloff in transport equipment bookings, durable goods orders likely slipped by .9% in May, erasing all but a fraction of the 1.1% rise recorded the prior month. As always, pay particular attention to core nondefense capital goods shipments excluding jet deliveries, for clues to the strength of equipment spending during the spring quarter.
S&P CoreLogic Case-Shiller (SPCLCS) 20-City Home Price Index: Home prices probably edged .5% higher for a second straight month in April across the twenty major metropolitan areas canvassed by SPCLCS. Despite the anticipated increase, the average selling price nationwide would remain 2.3% below that recorded 12 months earlier.
New Home Sales: Reported surges in single-family building permits and housing starts suggest that contracts to purchase a newly constructed dwelling jumped by 12.7% to a 15-month high seasonally adjusted annual rate of 710K in May.
Conference Board Consumer Confidence: Rosier appraisals of current and prospective economic conditions probably propelled the Conference Board ‘s sentiment gauge from 102.3 in May to 110.5 in June – the highest reading since the beginning of 2022.
Real GDP Growth: Source data released after the Bureau of Economic Analysis’ (BEA) preliminary report suggest that Q1 real GDP growth may be marked higher than the previously recorded 1.3% annualized clip. Pay particular attention to any revisions to real Gross Domestic Income (GDI) in this report. The BEA previously estimated that real GDI contracted by 2.3% during the winter quarter, following a 3.3% pullback over the final three months of 2022.
Jobless Claims: Initial claims for unemployment benefits likely remained in a 260-270K range during the filing period ended June 23. Keep an eye on continuing claims for signs that furloughed employees may be having a tougher time finding work.
Pending Home Sales: Constrained by limited supplies of homes on the market, contracts to purchase a dwelling probably declined by 1% in May, after no change in the preceding month.
Personal Income & Spending: Personal income growth likely continued apace in May, rising by .4% for a second consecutive month. Consumer spending is expected to post a more modest .2% gain but to have remained steady when inflation is considered.
Federal Reserve Appearances:
- June 28 Federal Reserve Chair Powell to participate in a policy panel discussion with other foreign central bank heads.
- June 29 Atlanta Fed President Bostic to speak about the US economic outlook with the Irish Association of Investment Managers.
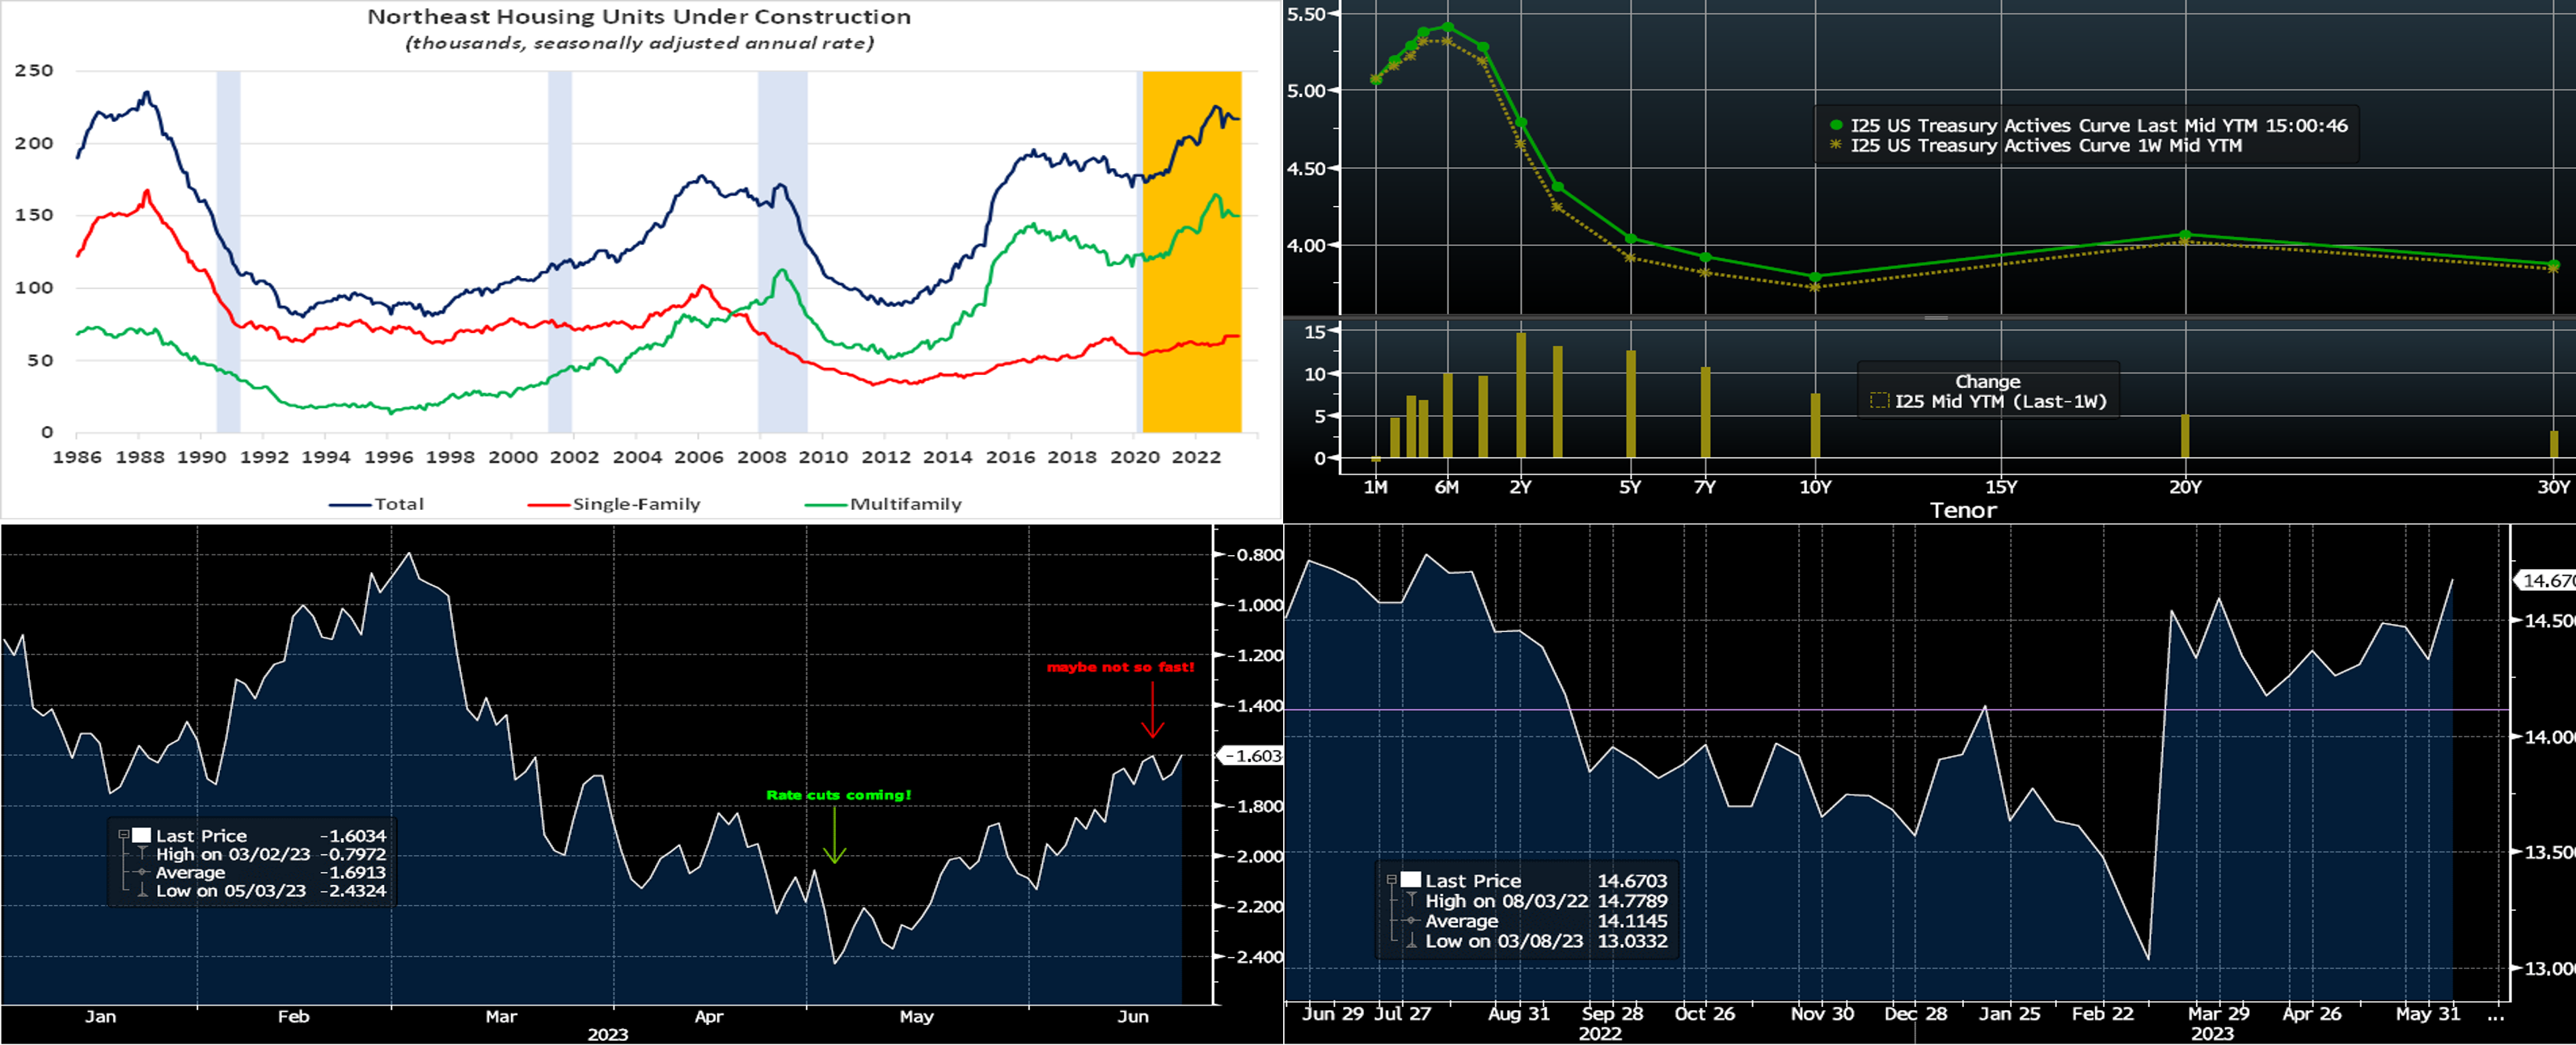
CHART 1 UPPER LEFT
Source: Census Bureau; National Bureau of Economic Research; FHLB-NY. Notes: Blue-shaded areas denote recession; orange-shaded areas highlight current economic expansion. Inventories of available housing units remain historically low both across the country and within our region. While still near the highest levels since the late 1980s, the number of housing units under construction in the Northeast has been trending lower since last August. In contrast to the remainder of the nation, where the difference between single-family and multifamily units being built is relatively close, the latter accounts for almost 70% of activity in our region. Amid ongoing challenges in finding building materials and workers, completion times remain unusually long in the Northeast. In 2022, it took an estimated 20.4 months to complete a multifamily building, up from 18.5 months in 2021 and well above the 17-month national average.
CHART 2 UPPER RIGHT
Source: Bloomberg. Top pane is yield (LHS, %), bottom pane is change (bps). From last Thursday afternoon to this one, UST term yields finished higher and flatter yet again, with 2 to 5-year yields up by ~12 to 15 bps. Hawkish Fedspeak was a major reason for the changes, and the market backtracked further on its pricing of potential rate cuts in 2023-2024. Fed Chair Powell appeared before Congress mid-week, and he classified the process of getting inflation down to the 2% target as having a “long way to go”. He also declared that he did not envision rate cuts “happening anytime soon.” Moreover, he and other Fed officials stated that they thought more rate hikes could be in store for this year. As of this writing, the market prices the odds of a 25 bps hike at the July 27th FOMC at ~76%. The year-end Fed Funds forward is ~5.28%, ~8 bps higher than a week ago. The market’s repricing of the Fed has served to push the Fed’s BTFP rate higher, thereby now making our 2-month-and-in advance tenors a better alternative. Please call the Member Services Desk for further information on market dynamics and/or products.
CHART 3 LOWER LEFT
Source: Bloomberg; FHLB-NY. Shown here is the OIS (Overnight Index Swap, essentially representing the market’s Fed Funds rate projections) curve differential (RHS, %) of 3-month vs. 3-month 18-months forward. These curve points have been referenced in the past by Fed Chair Powell as ones he monitors for gauging recession expectations. In recent editions, we have noted that the market’s pricing of the Fed path has shifted notably upwards in the past six weeks. As can be seen here, in early May, the market was aggressively pricing, via these severely inverted curve points, a Fed easing cycle to commence this year and to continue through 2024. While the market still prices an easing cycle, the start and pace of it have been notably pared back in recent weeks. Consequently, the overall yield curve has moved higher and flatter over this period.
CHART 4 LOWER RIGHT
Source: Bloomberg. Last week we presented a chart and comments on the recent decline of implied volatility priced into option markets. Surely, a reason for the decline has been the “calmer seas” of the banking industry in recent months, which, in turn, has led to less market volatility. While no one is calling the coast completely clear of any future turbulence, here we can see a result of industry efforts to bolster liquidity. Shown is the US banking industry’s Cash-to-Total Assets ratio (RHS, %, white line; purple line is the average) over the past year. After a precipitous decline, it has recovered in the past few months near levels of a year ago.
FHLBNY Advance Rates Observations
Front-End Rates
- Short-end rates are mixed from a week ago, with the shortest tenors lower but longer ones a bit higher. The 2-month-and-in tenors are 2 to 6 bps lower, with the shortest down most. The 3-month-and-out points are each higher by 2 bps. Net T-bill supply remains robust as Treasury rebuilds its account post-debt ceiling agreement; however, it has been absorbed well thus far as Money Market Funds (MMFs) switch from the Fed’s RRP to T-bills with competitive yields. Moreover, FHLB supply has subsided from peak levels of spring, further helping T-bill interest from investors. These dynamics are conspiring to ease any upward pressure on rates from the T-bill supply resurgence.
- With much of the latest Fedspeak having been absorbed, economic data should be the prime driver of rates this upcoming week.
Term Rates
- The longer-term curve bear flattened from last week, generally mirroring moves in USTs and swaps. The 2 to 5-year zone was up by ~10 to 13 bps, while longer tenors finished higher by 3 to 6 bps. Kindly refer to the previous section for relevant market color. The advance curve remains inverted out to 5-year, thereby offering opportunities to extend in advance duration at lower coupon cost.
- On the UST term supply front, the upcoming week serves 2/5/7-year auctions. Please contact the Member Services Desk for further information on market dynamics, rate levels, or products.
Product Alert: FHLBNY is pleased to announce the reintroduction, after a temporary suspension owing to Libor-cessation, of the Putable Advance, Fixed-Rate with SOFR Cap Advance, and ARC with SOFR Cap/Floor Advance. The Callable Advance continues to be offered. This expansion of the product menu will provide members with more options and flexibility for the management of funding and/or hedging needs.
Forward Start Advance (FSA): For members with upcoming borrowing or refunding plans, consider the FSA as a method to opportunistically “lock in” rates before advance settlement date. Please contact the Member Services Desk at (212) 441-6600 for more information.
The Symmetrical Prepayment Advance Feature
For those anticipating term funding needs, and with rates on an uptrend, it can be an appropriate juncture to consider our SPA feature. This feature allows the member to capture, at prepayment, changes in the fair value of the advance which are favorable to the member. Contact Member Services Desk to discuss.
Looking for more information on the above topics? We’d love to speak with you!
Questions?
If you wish to receive the MSD Weekly Market Update in .pdf format (includes FHLBNY rate charts) or to discuss this content further, please email the MSD Team.