Member Services Desk
Weekly Market Update
This MSD Weekly Market Update reflects information for the week ending February 24, 2023.
Economist Views
Click to expand the below image.
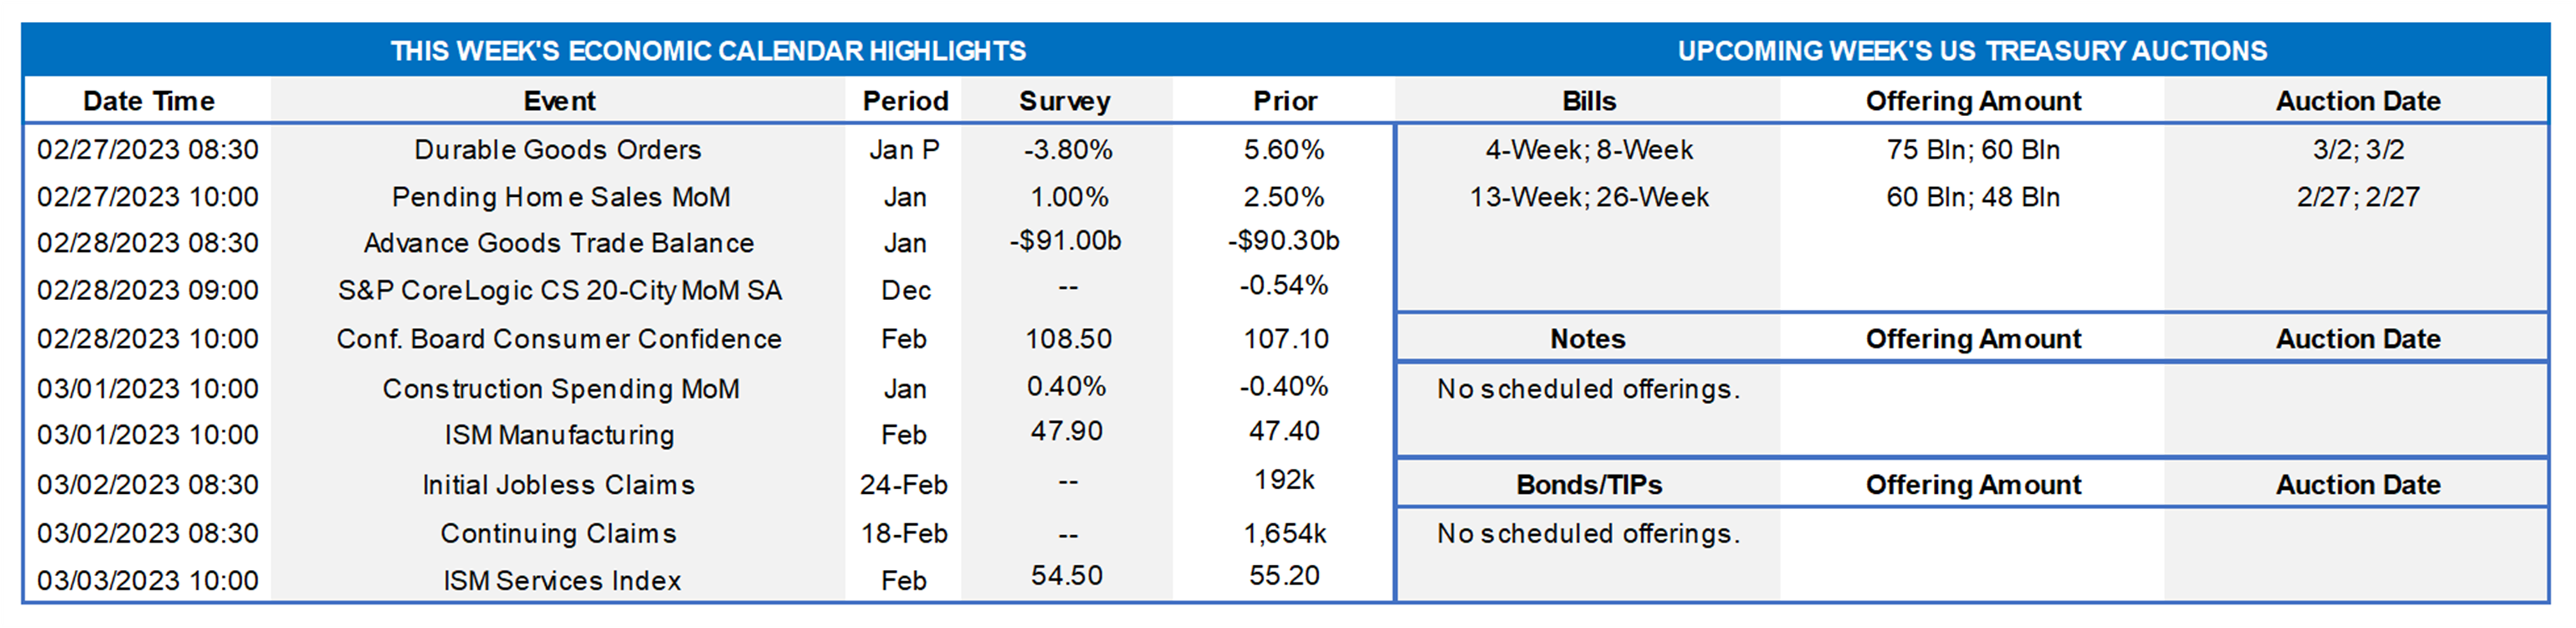
While market participants will contend with a very crowded economic release calendar this week, the Bureau of Labor Statistics’ update on the employment situation in February will be delayed until Friday, March 10. This week’s slate of indicators is expected to be decidedly mixed. On the positive side, closely followed canvasses of manufacturing and service-producing activity likely will show further improvements from their reported January readings. Tight labor market conditions continued to support consumer confidence this month. On the negative side, home-selling prices probably remained on a downtrend at the end of last year, while durable goods orders likely slumped in January. By contrast, the Federal Reserve public-speaking calendar will be exceptionally light, with only Atlanta Fed President Raphael Bostic slated to give welcoming remarks at a conference on racial inequality.
Durable Goods Orders: An aircraft-led decline in transportation equipment bookings probably pared durable goods orders by 3.5% in January, erasing over half of the 5.6% jump recorded in December. Net of the anticipated weakness in transport requisitions, “hard goods” bookings likely edged .2% higher during the reference period, reversing the .2% prior-month dip. Pay particular attention to core nondefense capital goods shipments for clues to the momentum in business equipment spending at the beginning of the New Year.
Pending Home Sales: Buoyed by recent reductions in mortgage interest rates, home-contract signings likely climbed by 1% in January, building on December’s 2.5% gain.
Merchandise Trade Balance: The merchandise trade deficit is expected to have widened slightly to $90.5bn in December, after an $89.7bn shortfall in the preceding month.
S&P CoreLogic Case-Shiller 20-City Home Price Index: Home prices probably retreated for a sixth consecutive month across the twenty major metropolitan areas canvassed by SPCLCS in December. The .5% decline implied by available reports, after a similar dip in November, would leave home selling prices 4.7% above those recorded at the end of 2021.
Conference Board Consumer Confidence: Rosier assessments of current and prospective labor-market conditions probably propelled the Conference Board’s sentiment gauge to a 13-month high of 110 in February from 107.1 in the previous month.
Construction Spending: The nominal value of new construction likely remained on a saw-toothed path in January, climbing by .3% after a .4% decline in December.
ISM Manufacturing Index: The nationwide slump in manufacturing activity likely marked its fourth month in February. District Federal Reserve Bank canvasses and other surveys suggest that the Purchasing Managers Index improved marginally to 48% from 47.4% in the previous month.
Jobless Claims: New claims for unemployment insurance benefits probably remained below the 200K mark for a seventh straight week during the period ended February 24. Keep an eye on continuing claims, which have clocked in below the 1.7mn mark since mid-December, for any signs that recently furloughed employees may be having a more challenging time finding work.
ISM Services Index: Available surveys suggest that service-producing activity accelerated in February, thus propelling this barometer to a 13-month high of 59% from 55.2% in the previous month.
Federal Reserve Appearances: Mar. 3 – Atlanta Fed President Bostic to give welcoming remarks via recorded video at a conference on racial inequality.
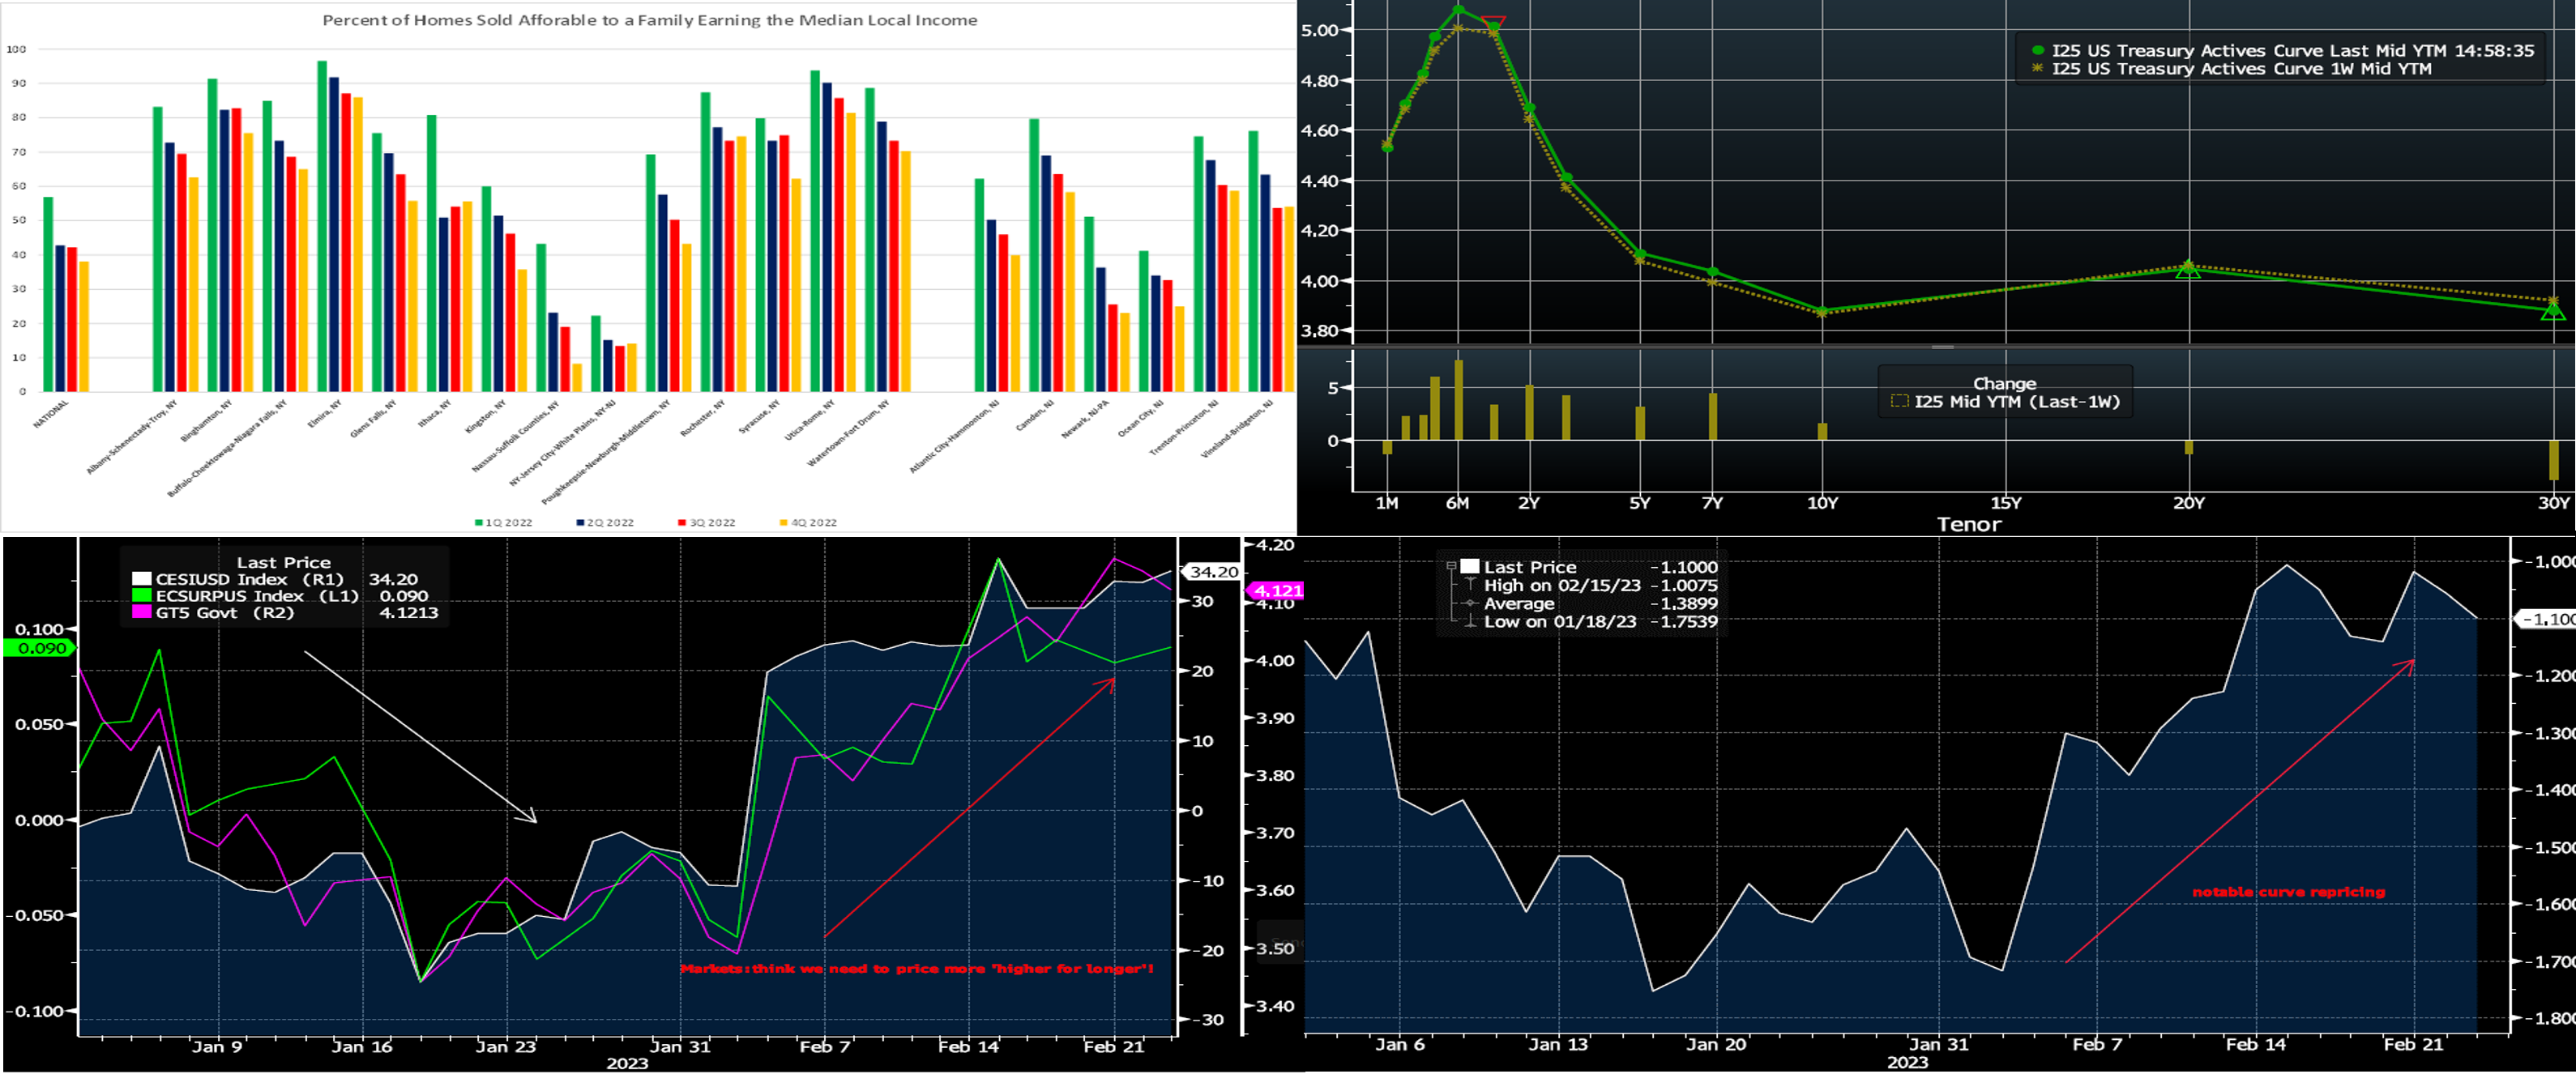
CHART 1 UPPER LEFT
Source: National Association of Home Builders/Wells Fargo; FHLBNY. Kindly enlarge the chart for a more complete view. The NAHB/Wells Fargo Housing Opportunity Index (HOI) for a given area is defined as the share of homes sold that would have been affordable to a family earning the local median income, based on standard mortgage underwriting criteria. Nationwide, just 38.1% of new and existing homes sold between the beginning of October and the end of December were affordable to families earning the U.S. median income of $90K. This marks the third quarterly record low for housing affordability since the Great Recession, trailing the previous mark of 42.2% set over the course of the summer. Except for the modest improvements witnessed in Ithaca, the NY-Jersey City-White Plains-NY-NJ Metro Statistical Area, Rochester, and Vineland-Bridgeton, NJ, housing opportunity deteriorated markedly across the bulk of the FHLB-NY coverage area in Q4. Housing opportunities in the FHLB-NY District during the fall ranged from a high of 86% in Elmira, NY to a low of just 8.3% across Nassau and Suffolk Counties. We encourage members to utilize our affordable housing and community programs; for information, please visit our community page.
CHART 2 UPPER RIGHT
Source: Bloomberg. Top pane is yield (LHS, %), bottom pane is change (bps). As of Thursday afternoon, UST term yields, except for the very long end, moved higher yet again week-over-week The move was led by the 2 to 7-year sector; the 2-year was ~8 bps higher and 5-year ~5 bps (both adjusted for the roll to new on-the-run bonds). Fed-speak sustained a hawkish tone, and Wednesday’s FOMC Minutes release essentially indicated “more work to be done” by the Fed to combat inflationary forces. Debates on the 2023 economic “flight path” had previously centered on “soft vs. hard landing” but now include “no landing”. Consequently, the market again repriced higher and longer the prospective path of Fed hikes. The market’s pricing for end-2023 is now ~5.17%, up from last week’s 5.02%. The market has also priced higher the peak rate to ~5.35% for this August, up from ~5.23% a week ago. Despite the repricing of recent weeks, the market still prices an easing timeline near or just after the turn-of-the-year that is at odds with Fed projections.
CHART 3 LOWER LEFT
Source: Bloomberg. Illuminated here is the reason that we provide an economic data calendar in this report. A main catalyst for the reversal of higher rates (RHS-2, purple, 5-year UST yield) this month has been higher-than-consensus data reflecting still non-recessionary outcomes and still portraying inflationary forces as not fully staunched yet. The Citibank (RHS, white) and Bloomberg (LHS, green) Economic Surprise indices clearly reflect, via their notable upward moves, this theme thus far in February.
CHART 4 LOWER RIGHT
Source: Bloomberg. Shown here is the 3-month vs. 18-month-forward 3-month OIS (Overnight Index Swap = Fed funds barometer) yield curve. This portion of the yield curve is monitored by some strategists as a signal, when it inverts, for a looming recession and has also been cited in Fed research and by Fed Chair Powell himself in past comments. After reaching deeply inverted levels (i.e., the forward rate much lower than the spot rate) in January, it has notably steepened this month; the steepening has essentially been driven by the market’s repricing higher, owing to themes mentioned above, the forward rate to reflect a Fed policy rate path that will be “higher for longer.”
FHLBNY Advance Rates Observations
Front-End Rates
- Short-end rates were mostly unchanged in the very short-end but 5 bps higher in the 2-month-and-out tenors, week-over-week. The move higher was essentially further upwardly revised pricing of the Fed’s hiking path. Please see the previous section for more specific Fed-pricing color.
- Given the Fed’s ongoing tightening and data-dependent posture, rates will be most responsive to Fed-speak and the data calendar.
Term Rates
- The longer-term curve moved 4 to 9 bps higher week-over-week, as of Thursday afternoon, led by the 1 to 5-year sector and generally mirroring moves in USTs and swaps. Kindly refer to the previous section for relevant market color. The advance curve remains inverted out to 5-year, thereby offering opportunities to extend in advance duration at lower coupon cost. We have also seen a few compelling opportunities in floating advances.
- On the UST term supply front, this upcoming week serves a reprieve from auctions. Data releases will be on the busier side. Kindly call the Member Services Desk for information on market dynamics, rate levels, or products.
Product Alert: FHLBNY is pleased to announce the reintroduction, after a temporary suspension owing to Libor-cessation, of the Putable Advance, Fixed-Rate with SOFR Cap Advance, and ARC with SOFR Cap/Floor Advance. The Callable Advance continues to be offered. This expansion of the product menu will provide members with more options and flexibility for the management of funding and/or hedging needs.
Forward Start Advance (FSA): For members with upcoming borrowing or refunding plans, consider the FSA as a method to opportunistically “lock in” rates before advance settlement date. Please contact the Member Services Desk at (212) 441-6600 for more information.
The Symmetrical Prepayment Advance Feature
For those anticipating term funding needs, and with rates on an uptrend, it can be an appropriate juncture to consider our SPA feature. This feature allows the member to capture, at prepayment, changes in the fair value of the advance which are favorable to the member. Contact Member Services Desk to discuss.
Looking for more information on the above topics? We’d love to speak with you!
Questions?
If you wish to receive the MSD Weekly Market Update in .pdf format (includes FHLBNY rate charts) or to discuss this content further, please email the MSD Team.