Member Services Desk
Weekly Market Update
This MSD Weekly Market Update reflects information for the week of May 2, 2022
Economist Views
Click to expand the below image.
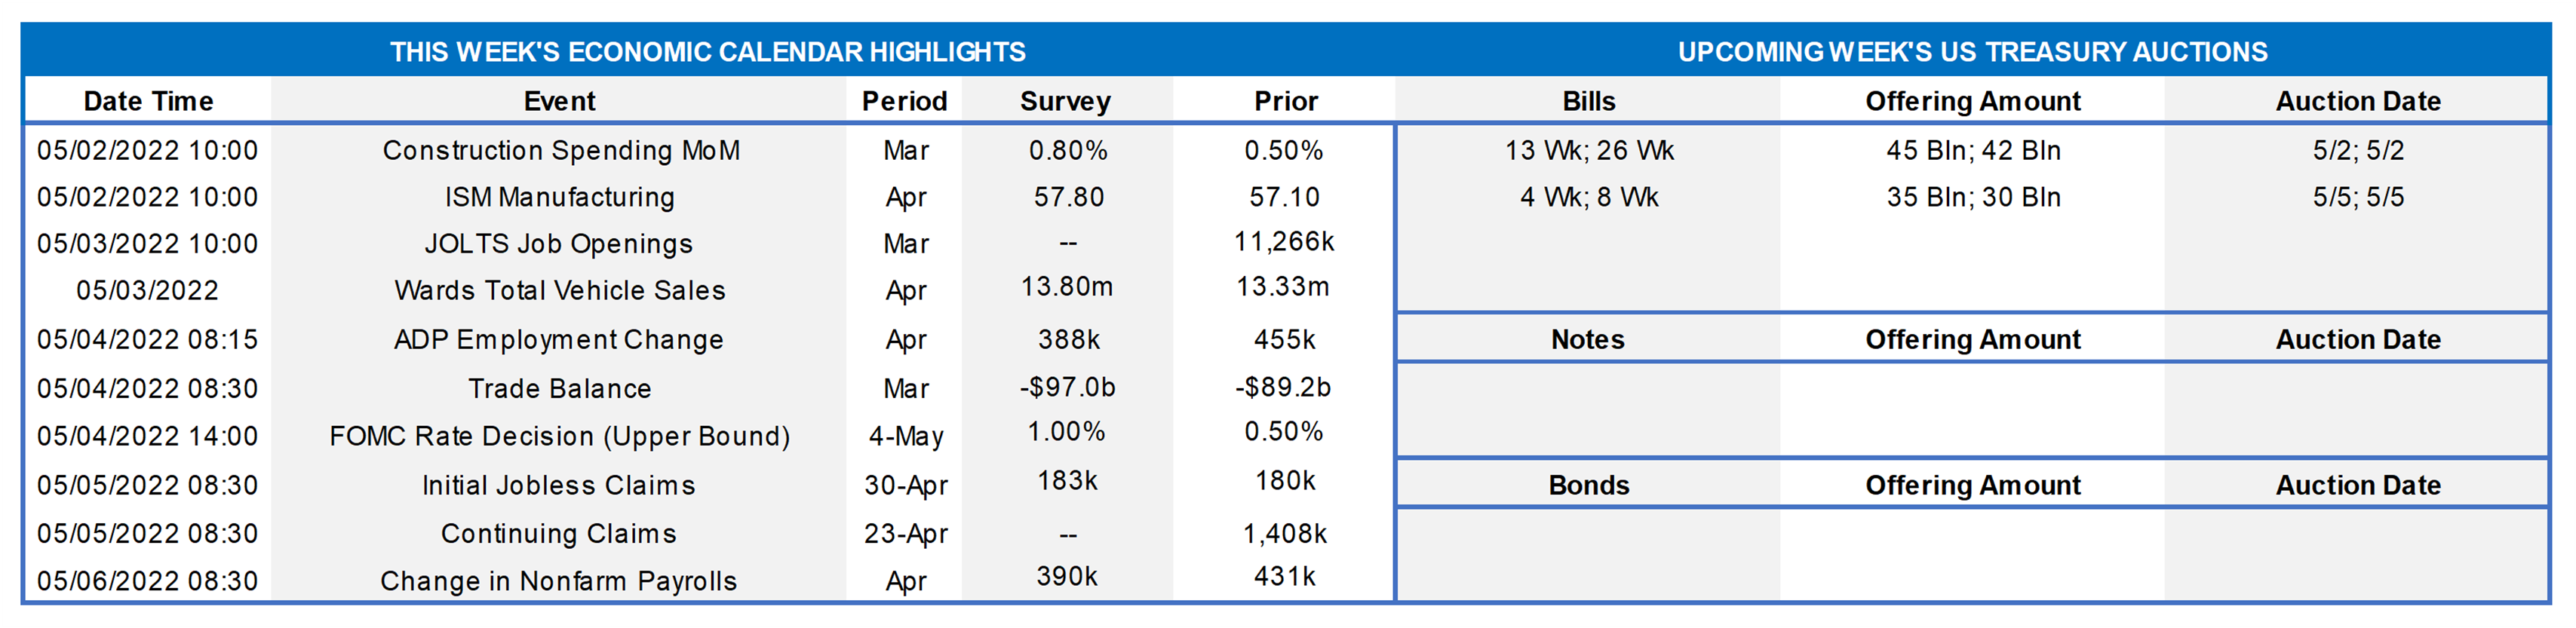
The market will confront a storm of economic information this week. Topping the list of events will be the Federal Open Market Committee (FOMC) meeting. Policymakers are universally expected to raise the federal funds rate target by a one-half percentage point to .75% to 1%. More attention will be paid to any information on plans to reduce the size of the System Open Market Account (the Fed’s securities portfolio), which currently stands at $8.5trn – a whopping $4.6trn above the pre-pandemic level. Manufacturing activity is expected to have expanded at a marginally faster pace than in March. Labor market conditions probably tightened further in April, with the possibility that the national unemployment rate may have retreated to a nearly seven-decade low.
Construction Spending: : The nominal value of new construction put-in-place probably climbed by .8% in March, boosting the cumulative increase over the latest 12 months to 10.9%.
ISM Manufacturing Index: The nationwide manufacturing expansion likely marked its 23rd month in April, with the pace of activity quickening slightly from March’s reported clip. District Federal Reserve Bank canvasses suggest that the Purchasing Managers Index climbed to 57.7% from 57.1% in the previous month.
JOLTS Job Openings: A sharp bounce-back in online help-wanted postings suggests that total job openings likely rebounded to a record 11.5mn in March. Given the reported decline in civilian unemployment last month, that result left would leave the gap between available positions and the jobless at an all-time wide of 5.5mn. In other words, there was an estimated 1.9 jobs per unemployed person in March.
Motor Vehicle Sales: Combined purchases of light trucks and passenger cars are expected to have jumped by 8.8% to a three-month high seasonally adjusted annual rate of 14.5mn in April.
ADP National Employment Report: Street economists expect ADP Employer Services to report that 370K net new jobs were added in the private sector in April, following a 455K gain in March. Given the comparatively modest overshoot from the 431K net positions added in the Bureau of Labor Statistics’ March report, any prior-month revision should be negligible.
International Trade Deficit: Triggered by a dramatic widening of the merchandise trade deficit, the aggregate shortfall on international trade in goods and services likely widened to a record $107 bn in March, after an $89.2bn shortfall in February.
Employment Situation Report: Labor-market conditions probably tightened further in April. Indeed, powered by increased hiring at service-producing firms, nonfarm payrolls likely expanded by 500K after the 431K increase recorded in March. A sharp reduction in the state insured unemployment rate between canvassing periods suggests that the percentage of the civilian labor force without a job moved three ticks lower to 3.3% – the lowest level since October 1953. An extended 5-week interval between establishment surveys may result in an above-consensus wage gain in this week’s report.
Federal Reserve Appearances:
- May 4 Federal Open Market Committee meeting communique.
- May 4 Federal Reserve Chair Powell to hold post-FOMC meeting press conference.
- May 6 New York Fed President Williams to deliver opening remarks at an environmental economics and policy conference.
- May 6 Fed Governor Waller and St. Louis Fed President James Bullard to take in a discussion on monetary policy strategy.
Click to expand the below image.
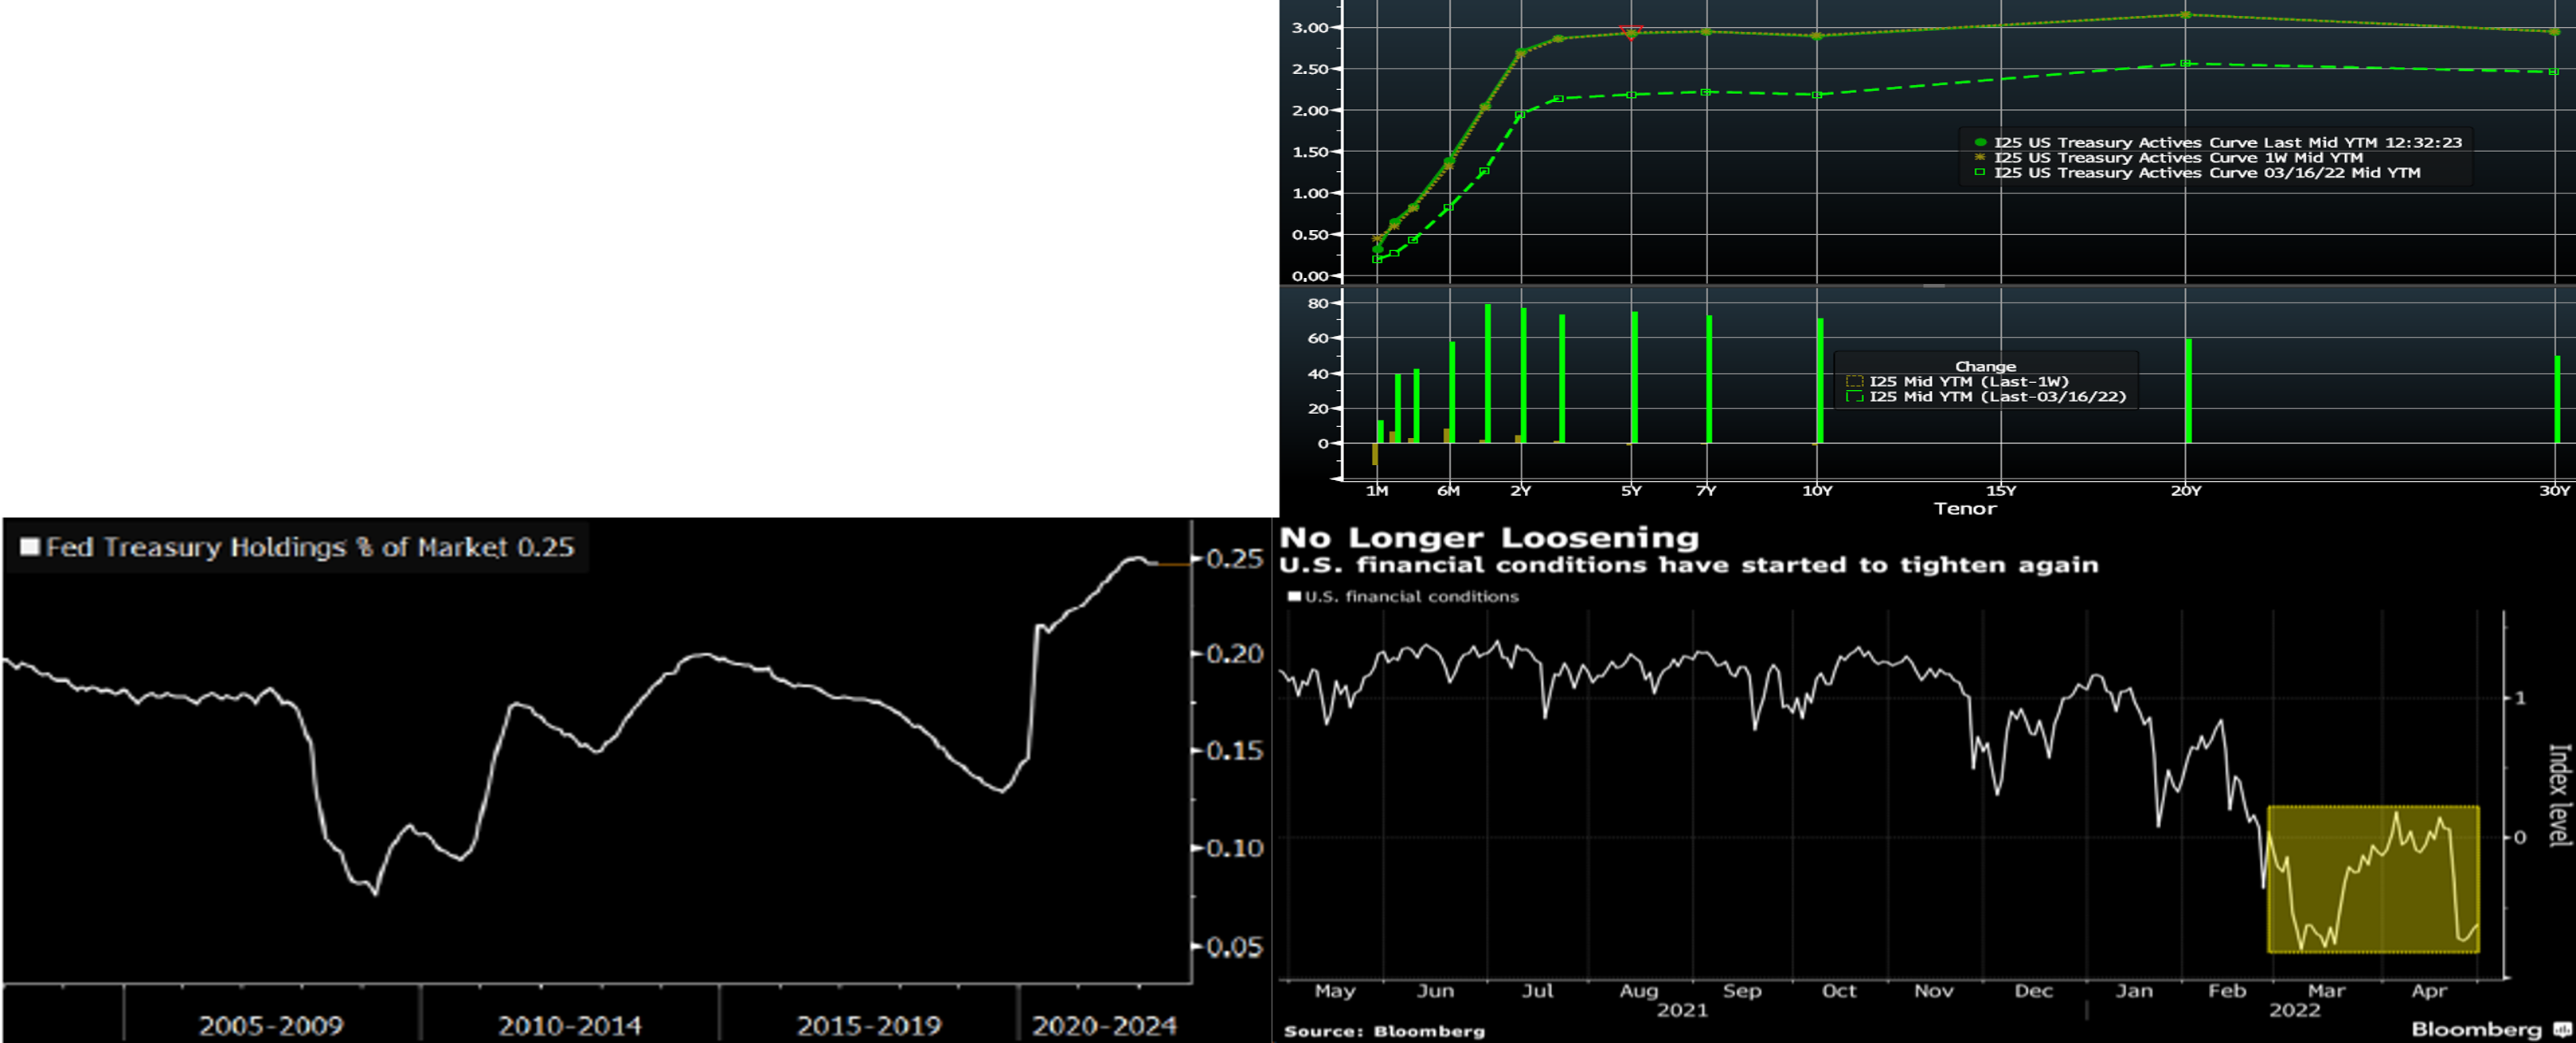
CHART 1 UPPER LEFT
Source: Bloomberg; FHLBNY. Market-based expectations of prospective Fed interest-rate hikes have risen sharply since the March 16 FOMC meeting. Market participants now universally expect a 50 bps hike in the federal funds rate target range to .75% to 1% at this week’s gathering. Moreover, a pair of similarly sized increases are projected for the following three meetings in June, July, and September. An updated “dot plot” of Federal Reserve official’s rate forecasts will not be released until the middle of next month, but it is probably safe to say that those projections are poised to move higher, especially given “hawkish” Fed-speak in the past few weeks.
CHART 2 UPPER RIGHT
Source: Bloomberg. Note: Top pane is yield (%), bottom pane is change (bps). The UST yield curve modestly flattened week-over-week. As of Friday afternoon, yields out to 3-year were a few bps higher from the prior week, while the rest of the curve finished mostly unchanged. Fed-speak was absent, owing to the Fed’s blackout before the FOMC this upcoming week. At this stage, a 50 bps hike from the Fed is “baked in the cake”. The market presently prices for a 100% chance of a 50 bps hike at both the May 4 and June 15th FOMC meeting; in fact, it also prices for a ~38% chance of a 75 bps hike at the June meeting. For the rest of 2022, the market prices for ~251 bps of cumulative hikes from the current level. In terms of the Fed’s portfolio, the market generally anticipates the Fed to announce plans to run-off its holdings by ~$85-90bn a month, with ~70% of that in USTs and the rest in MBS. Suffice it to say that the market focus will be on the FOMC outcome this upcoming week.
CHART 3 LOWER LEFT
Source: Bloomberg. Last week we presented a chart on a large amount of Agency MBS held by the Fed in its portfolio. As a companion chart, here can be seen that the Fed now owns a historically large, at ~25%, the share of the outstanding UST market. Owing to the Fed’s Quantitative Easing program, this share has risen by 10 percentage points since February 2020. Projecting forward, a monthly runoff pace of ~$60bn may get the Fed’s ownership share down to ~18% of the market, or back into the range of the last several pre-pandemic years. As cited on the previous slide herein regarding the FOMC meeting, the market will monitor the outcome for any surprise or large deviance from this kind of expected runoff pace.
CHART 4 LOWER RIGHT
Source: Bloomberg. Shown here is the Bloomberg U.S. Financial Conditions Index which tracks the overall level of financial stress in U.S. markets to help assess the availability and cost of credit. A positive value indicates accommodative financial conditions, while a negative value indicates tighter financial conditions relative to pre-crisis (Great Financial Crisis of late-2000’s) norms. Its components include measures and levels of stock and bond market volatility, credit spreads in bond and money markets, and equity market valuations. After running on the clearly “loose” side during 2021, conditions have turned tighter in the past two months. In simpler terms, bond and stock returns have fallen (a “60/40” stock/bond portfolio is down ~10% thus far in 2022), credit and MBS spreads have widened, and volatility has risen to highs in recent years. It may appear somewhat counterintuitive for the Fed to push onward with rate hikes, given this index reflects tighter conditions. But after a long run of loose conditions, the Fed now desires and has worked to make conditions tighter. Indeed, Fed Chair Powell stressed at March’s FOMC meeting that financial conditions are the mechanism through which monetary policy “reaches the real economy.” In that vein, the Fed is expected to proceed with hikes and balance sheet reduction, in order to reinforce this impact.
FHLBNY Advance Rates Observations
Front-End Rates
- Short-end Advance rates finished higher week-over-week by varying degrees. Whereas 1-month was up ~12 bps, the 6-month was higher by 8 bps. The market’s ongoing aggressive pricing of forthcoming Fed rate hikes has served to push advance rates higher. As of this past Friday afternoon, the market priced for a 100% probability of 50 bps hikes at both the May 4 and June 15th FOMC meetings, with the June meeting also priced for a significant chance of a 75 bps hike. This pricing and the fact that maturities are crossing further into the timeline of the Fed hiking cycle, were causal factors in the rate moves.
- Given the Fed tightening posture and upcoming FOMC meetings, rates will remain highly responsive to the market’s moves and pricing of the Fed.
Term Rates
- The advance rates curve generally mimicked the UST curve week-over-week and mildly flattened from the week prior. For instance, while the 1-year was ~5 bps higher, the 5-year was ~1 bps lower on the week. Kindly refer to the previous section for relevant market color. While our advance curve has lost points of inversion a few weeks ago, it is still notably flat in certain areas; for instance, the 4 to 5-year is flat. This condition may provide a compelling opportunity to extend liability duration at no or minimal coupon increase.
- On the UST term supply front, this upcoming week brings a reprieve from auctions. Given market volatility, members should monitor conditions for potentially more optimal timing on transactions. Please call the desk for information on market dynamics, rate levels, or products.
Product Alert: FHLBNY is pleased to announce enhancements to our Advance Rebate Program, which provides members an opportunity to receive a cash rebate when prepaying an eligible advance and rebooking a new advance within a 30-day period. Rebate-eligible advances now must have a minimum of 6-months (reduced from 1-year) remaining. Moreover, the potential cash rebate has been increased. This program can be suitable for those wishing to extend their liability duration and/or potentially improve net interest margin. Please call the Member Service Desk at (212) 441-6600 for more information.
Forward Start Advance (FSA): For members with upcoming borrowing or refunding plans, consider the FSA as a method to opportunistically “lock in” rates before advance settlement date. Please call the Member Service Desk at (212) 441-6600 for more information.
The Symmetrical Prepayment Advance Feature
With rates at or near multi-year lows, it is a compelling juncture to use the SPA feature on term advances. This feature allows member to capture, at prepayment, changes in the Fair Value of the advance which are favorable to the member. Contact us to discuss.
Looking for more information on the above topics? We’d love to speak with you!
Questions?
If you wish to receive the MSD Weekly Market Update in .pdf format (includes FHLBNY rate charts) or to discuss this content further, please email the MSD Team.