Member Services Desk
Weekly Market Update
This MSD Weekly Market Update reflects information for the week ending April 12, 2024.
Economist Views
Click to expand the below image.
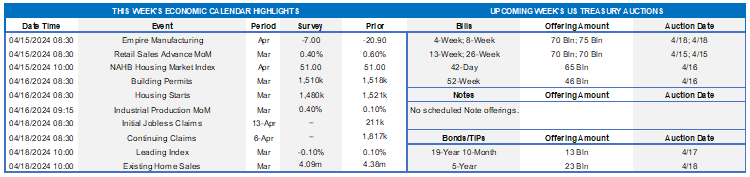
The upcoming week serves a crowded calendar of economic data and public appearances by Federal Reserve officials. Reports on retail sales, residential construction activity, industrial production and existing home sales will allow economists to fine-tune their projections for real GDP growth in Q1. Current estimates for the Bureau of Economic Analysis’ advance report, which will be released on April 25, are centered at 2% annualized, following Q4’s 3.4% annualized advance. Seven Fed officials, including five current FOMC voters, are slated to give their views on a variety of topics. The Federal Reserve’s Beige Book will provide useful color on regional economic conditions.
Empire State Manufacturing Survey: Activity in New York State likely contracted for a fifth straight month in April, although the net percentage of respondents witnessing a pickup in business less those experiencing a decline probably improved from the -20.9% reading recorded in March.
Retail & Food Services Sales: Sales probably continued their rise, estimated at .6%. As always, watch so-called “control” sales excluding auto, building materials and gas purchases for clues to the pace of Q1 consumer spending. Barring any prior-month revisions, a .6% rise would leave core purchases over the Q1 span .6% annualized above their Q4 average, after a 2.9% annualized gain in Q4.
NAHB Housing Market Index: Rosier appraisals of sales, along with an anticipated pickup in buyer traffic, probably lifted the confidence gauge by one point to a nine-month high of 52 in April.
Housing Starts & Building Permits: New residential construction activity likely ebbed slightly in March, with the number of new housing units started and building permits issued retreating by 2.7% and .9%, respectively, to seasonally adjusted annual rates (SAAR) of 1.51mn and 1.48mn.
Industrial Production & Capacity Utilization: Output at mines, factories and utilities probably quickened in March, lifting the Federal Reserve’s industrial production gauge by .6% after a modest .1% uptick in February. With output growth expected to eclipse additions to productive capacity during the reference period, the aggregate operating rate likely climbed to a three-month high of 78.6%.
Jobless Claims: Initial claims for unemployment insurance benefits probably remained in the recent 210-225K range during filing period ended April 13. Continuing claims – the total number of persons collecting benefits – likely hovered near the 1.8mn mark during the week ended April 6 – a sign that the recently unemployed are having few difficulties finding work.
Index of Leading Economic Indicators: The Conference Board’s augur of future economic activity is expected to have dipped by .1% in March, erasing the surprising February gain. Aside from the LEI, the economy has shown few signs of faltering. Indeed, St. Louis Fed’s recession probability model placed the chances that the economy was contracting in February at a negligible 1.5%.
Existing Home Sales: A reversal in home-purchase contract signings over the January-February span suggests that closings dipped by .9% to a SAAR of 4.34mn in March, holding on to all but a fraction of the prior month’s 9.5% jump. With the number of available homes on the market expected to hold steady at 1.07mn, supply at the estimated sales pace would edge a tick higher to three months.
Federal Reserve Appearances:
- Apr. 15 San Francisco Fed President Daly to give keynote remarks at the Stanford Institute for Economic Policy Research.
- Apr. 17 The Federal Reserve Board will release the Beige Book summary of economic conditions.
- Apr. 18 Fed Governor Bowman to speak at a fireside chat at the SIFMA Basel III Endgame Roundtable.
- Apr. 18 Atlanta Fed President Bostic to participate in fireside chat about the economic outlook in Fort Lauderdale, FL.
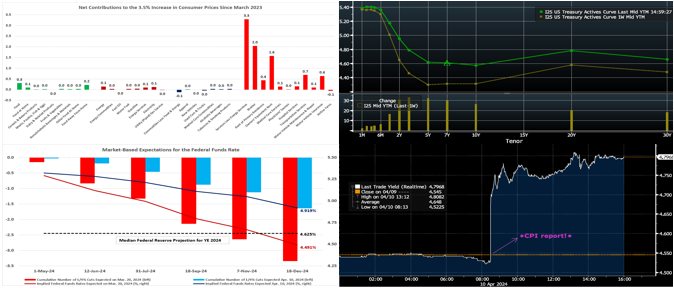
CHART 1 UPPER LEFT
Source: BLS; FHLB-NY. Non-energy service cost increases have been responsible for all but a fraction of the 3.5% rise in the Consumer Price Index (CPI) over the past 12 months. While the stubbornness of shelter costs has been widely covered in the press, sharp increases in motor vehicle maintenance, repair, and insurance prices have also played a role in limiting progress on the consumer inflation front. Indeed, automotive maintenance and repair costs have climbed by 8.2% since March 2023, while motor vehicle insurance prices have leaped by 22.2%. Coming on the heels of a strong employment report, it will become increasingly difficult for Fed officials to discuss publicly a cut in rates any time soon. The central bank is doing well on the employment side of its dual mandate, but continued above-trend GDP growth and a stalling of progress in key consumer price metrics suggest that it will take more time to bolster confidence that price pressures are indeed moving towards the Fed’s desired 2% target.
CHART 2 UPPER RIGHT
Source: Bloomberg. Top pane is yield (LHS, %), bottom pane is change (LHS, bps). From last Thursday afternoon to this one, the UST curve moved markedly higher. Led by the 3-year, the 2- to 7-year sector was 30 to 32 bps higher. The main catalyst for the move was Wednesday morning’s CPI release. The market also had to digest the 3/10/30-year UST auctions, and each of them met with lackluster demand and added further upward pressure on yields. The tone of Fedspeak, meanwhile, continued to support a “rate cuts are likely this year but waiting/monitoring for now”. But the tone also seems to be veering towards a longer wait being appropriate, given recent data. In terms of market-implied pricing of the Fed, a full 100% probability of a 25 bps cut is now in the Fall, with the June 13th FOMC priced at only ~23% chance, down from ~76% last week. The year-end 2024 forward is ~4.90%, or ~32 bps higher than last week, implying a cumulative total of ~43 bps of cuts by the end of this year.
CHART 3 LOWER LEFT
Source: Bloomberg; Board of Governors of the Federal Reserve System; FHLB-NY. This past Wednesday’s stronger-than-expected CPI release spurred a significant adjustment in the market’s expectations for the Fed Funds rate. Shown here is market pricing in the immediate aftermath of the CPI release and the pricing back on the last FOMC meeting of a few weeks ago. The market had already in the past week priced slightly lower chances and extents of rate cuts in 2024, but it significantly recalibrated its pricing in the aftermath of the CPI release. Indeed, by Wednesday midday a 100% probability of a 25 bps cut had been pushed back to November from July 31st. Moreover, the market priced for a cumulative 1.6 cuts of 25 bps for 2024, down from three cuts last week, with a year-end rate well above the latest Fed dot plot! In reaction to the data and moves, market strategists began to announce adjustments later/shallower in their official “Fed-cut” forecasts. Please note that market pricing is extremely fluid and may move by the time of this publication.
CHART 4 LOWER RIGHT
Source: Bloomberg. This week’s CPI release sparked one of the biggest yield moves in months. As can be seen here in this past Wednesday’s intraday chart of the 3-year UST yield (RHS, %), the move was immediate and swift, with the yield rising over 20 bps within the first half-hour of the 8:30 a.m. release before closing the day ~25 bps higher. In turn, implied volatility in options markets jumped notably higher from the multi-month low points of a few weeks ago. Going forward, with heightened uncertainty on Fed policy, yields may become more sensitive to data. Regarding the analysis and timing of potential transactions, members should closely follow this dynamic and monitor the data calendar.
FHLBNY Advance Rates Observations
Front-End Rates
- Short-end rates moved higher and steeper week-over-week. While the 1-month-and-in sector was marginally changed, the 3- to 6-month zone was higher by 3 to 7 bps. The market’s upward pricing of prospective Fed policy drove the changes. Net T-bill supply, after a long spell in positive territory and in timing with the upcoming Tax Day when Treasury receives cash inflows, has turned negative in recent weeks. This dynamic, all else equal, can help tighten spreads on FHLB paper. But the looming April tax date can spur withdrawals from Money Market Funds (MMFs) and thereby lessen demand for short-end paper. Indeed, MMF AUM dropped by $31bn in the past week.
- In addition to fresh economic data in the upcoming week, market participants will monitor the ongoing plethora of Fed speakers.
Term Rates
- The longer-term curve, week-on-week and generally mirroring moves in USTs and swaps, moved notably higher. The 3-year led the move, rising by ~32 bps, with other tenors up by slightly less. Please refer to the previous section for color.
- On the UST term supply front, the upcoming week serves a 20-year nominal and a 5-year TIPS auction. Note that UST auctions usually occur at 1pm and can occasionally cause volatility around that time. Please contact the Member Services Desk for further information on market dynamics, rate levels, or products.
The FHLBNY is pleased to announce the 2024 0% Development Advance (ZDA) Program, now available with a new streamlined submission process. This program provides members with subsidized funding in the form of interest rate credits to assist in originating loans or purchasing loans/investments that meet the eligibility criteria under the Business Development Advance (BDA), Climate Development Advance (CDA), Infrastructure Development Advance (IDA), or Tribal Development Advance (TDA). Please contact the Member Service Desk for information and/or visit our ZDA information page.
Price Incentives for Advances Executed Before Noon: In effect as of Tuesday, September 5, 2023, the FHLBNY is pleased to now offer price incentives for advances executed before Noon each business day. These pricing incentives offer an opportunity to provide economic value to our members, while improving cash and liquidity management for the FHLBNY. For further details, kindly refer to the Bulletin.
The Symmetrical Prepayment Advance Feature
For those anticipating term funding needs, and with rates on an uptrend, it can be an appropriate juncture to consider our SPA feature. This feature allows the member to capture, at prepayment, changes in the fair value of the advance which are favorable to the member. Contact Member Services Desk to discuss.
Looking for more information on the above topics? We’d love to speak with you!
Questions?
If you wish to receive the MSD Weekly Market Update in .pdf format (includes FHLBNY rate charts) or to discuss this content further, please email the MSD Team.