Member Services Desk
Weekly Market Update
This MSD Weekly Market Update reflects information for the week ending April 21, 2023.
Economist Views
Click to expand the below image.
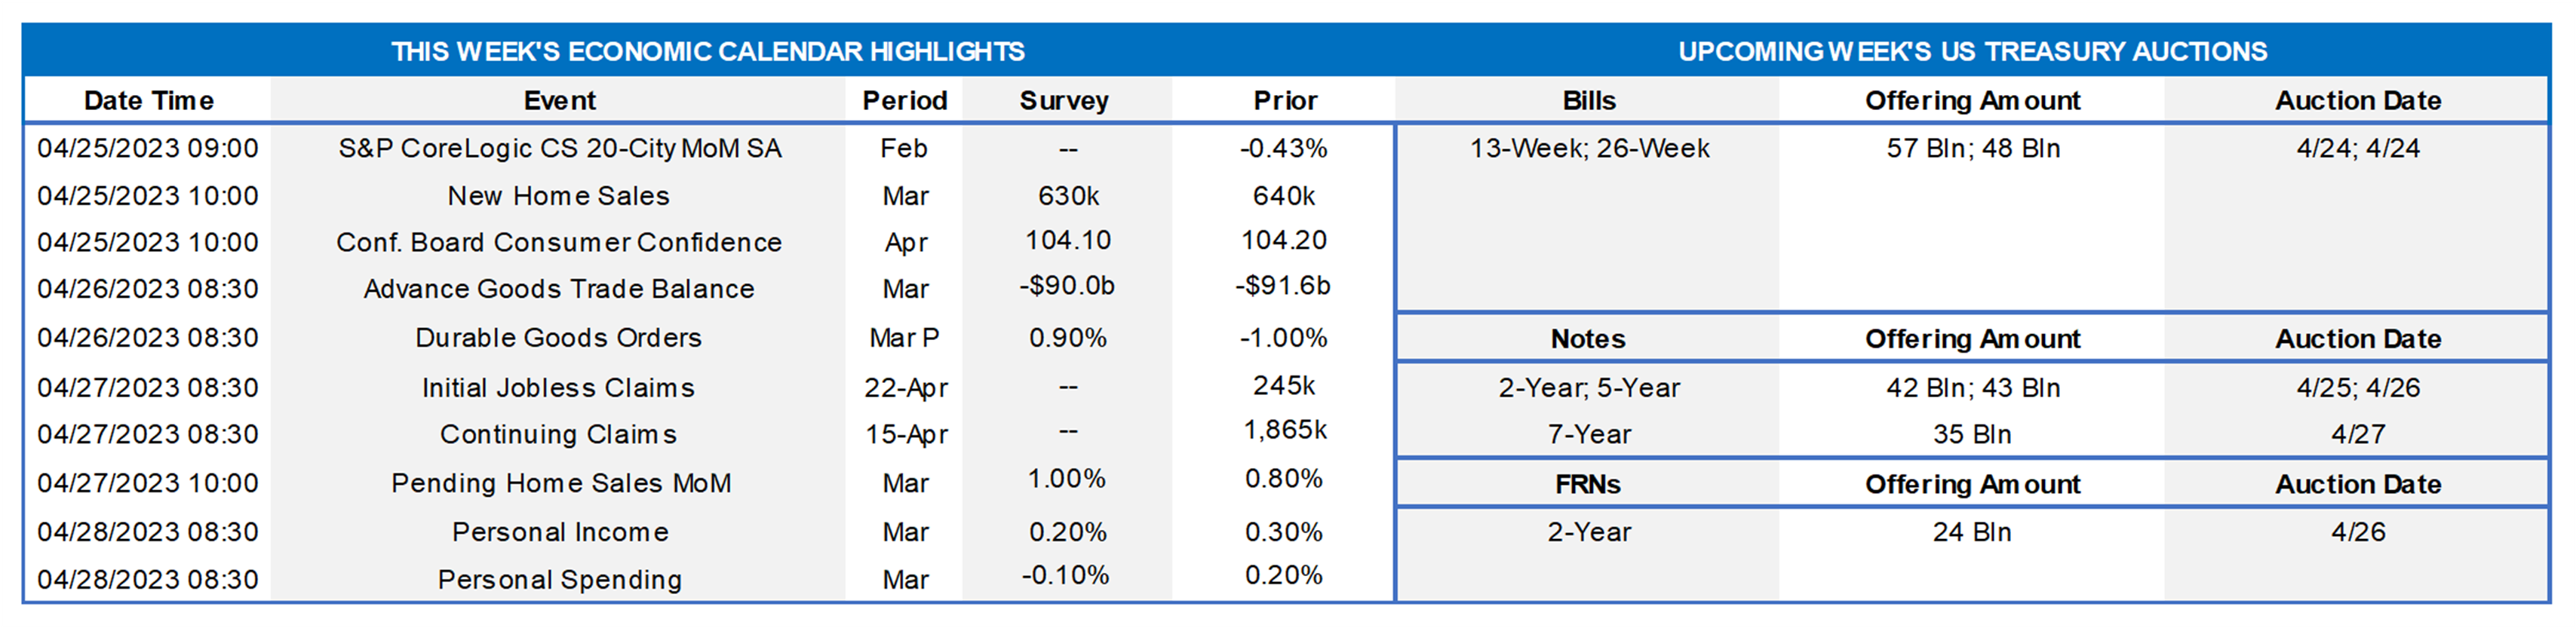
With monetary policymakers observing the traditional ban on public appearances ahead of the May 2-3 Federal Open Market Committee meeting, the sights of market participants will fall squarely on the economic data calendar this week. The Bureau of Economic Analysis’ advance report on real GDP growth during the winter quarter will be the marquee release. The median Street projection calls for a 2% annualized increase, down from 2.6% during Q4 2022, but the range of estimates is quite wide, extending from virtually no change to a well-above-trend 3.3% gain. Whatever the result, inflation-adjusted inventory liquidations over the first three months of the year likely will mask stronger accelerations in key demand metrics.
S&P CoreLogic Case-Shiller 20-City Home Price Index: Home prices probably edged higher for the first time since last June across the twenty major metropolitan areas canvassed by SPCLCS in February. The .2% uptick implied by available reports, after a .4% dip in January, would leave home selling prices just .4% above those recorded 12 months earlier.
New Home Sales: Reported increases in single-family building permits and housing starts suggest that contracts to purchase a newly constructed dwelling climbed by 4.7% to a 12-month high seasonally adjusted annual rate of 680K in March.
Conference Board Consumer Confidence: Rosier assessments of current and prospective economic conditions probably propelled this sentiment gauge to a four-month high of 107 in April from 104.2 in the previous month.
Durable Goods Orders: Powered by an aircraft-led snapback in transportation equipment bookings, durable goods orders likely rebounded in March, following a 1% dip in February and a 5% drop in January. As always, pay particular attention to core nondefense capital goods shipments sans jetliner deliveries for clues to the strength of business equipment spending during the winter quarter.
Merchandise Trade Balance: The merchandise trade deficit is expected to have narrowed to $89.5bn in March from the $91.6bn shortfall recorded in February.
Jobless Claims: Initial claims for unemployment benefits likely remained within their recent 225-250K range during the filing period ended April 22. Keep an eye on continuing claims for signs that furloughed employees may be having a tougher time finding work.
Pending Home Sales: Responding to recent reductions in mortgage interest rates, home-purchase contract signings are expected to have risen by 1% in March, boosting the cumulative increase since last November to 11.3%.
Employment Cost Index: The Employment Cost Index – the most complete compensation gauge including not only wages and salaries but also benefit costs – is expected to have risen by 1.1% over the January-March span, after a 1% gain over the final three months of 2022.
Personal Income & Spending: Personal income and consumer spending likely were little changed in March, following respective .3% and .2% upticks in February. The core PCE inflation gauge probably rose by .3% last month, clocking in 4.5% above its March 2022 level.
Federal Reserve Appearances: None. Federal Reserve officials will be observing the traditional blackout period ahead of the May 2-3 FOMC meeting.
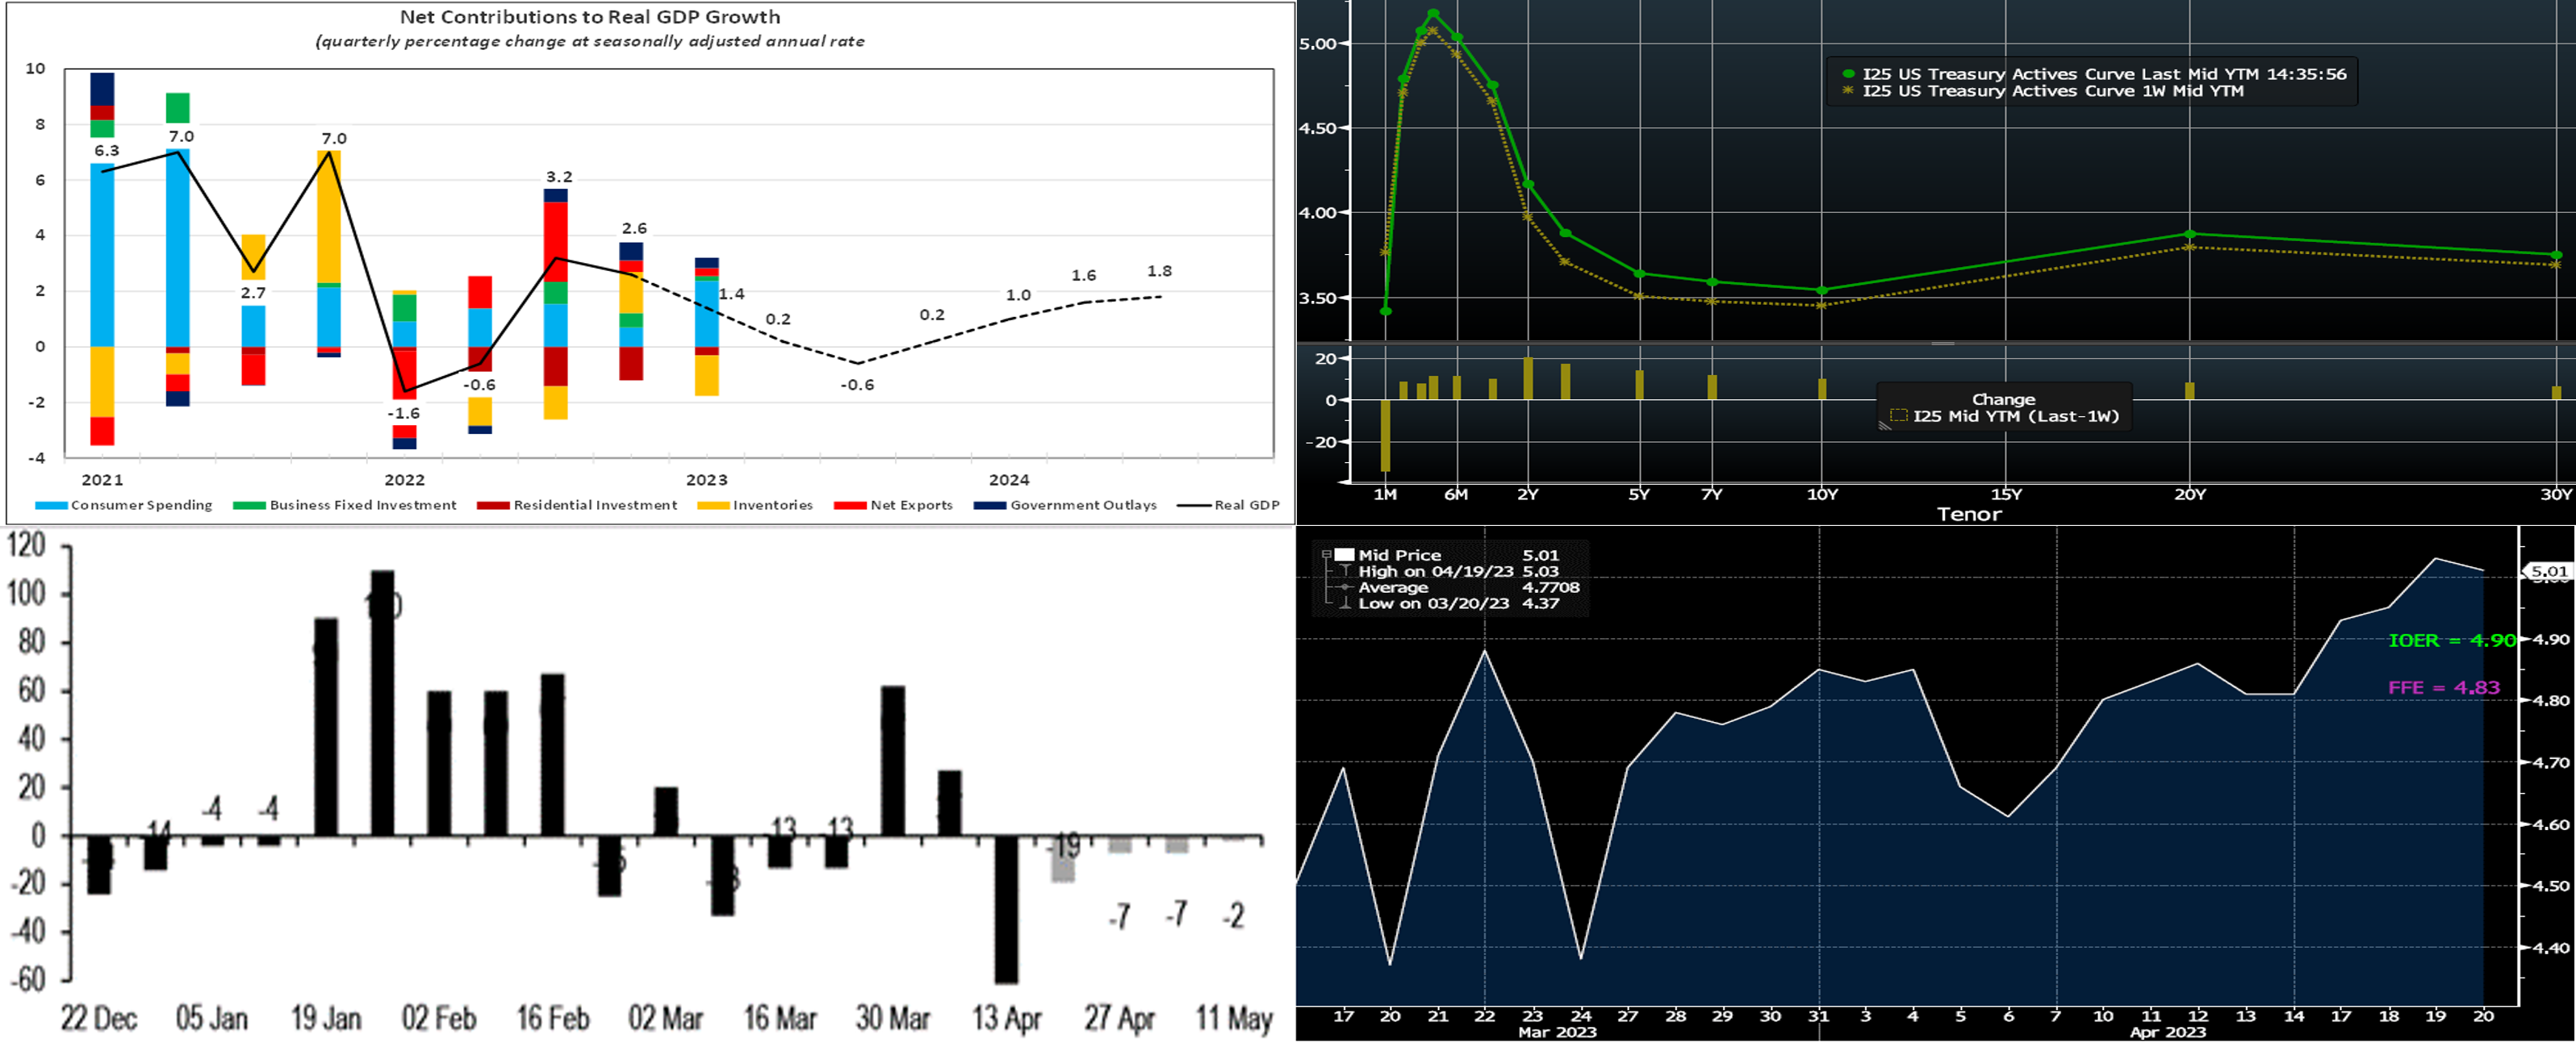
CHART 1 UPPER LEFT
Source: Bloomberg; Bureau of Economic Analysis; FHLB-NY. Available data suggest that economic activity slowed during Q1 from the fall quarter’s pace. While estimates vary widely, the median economist forecast calls for a 1.4% annualized increase in real GDP, down from the 2.6% gain witnessed over Q4 2022. Unsurprisingly, an anticipated rise in consumer spending is expected to be the primary growth driver. Modest increases in business fixed investment and government outlays, along with a narrower trade deficit, are also expected to buoy topline growth. Inventory liquidations and reduced residential investment probably capped reported growth. The projected slowdown likely will mask solid pickups in key demand measures, however. Excluding stock drawdowns, real final sales probably climbed by 2.9% in Q1, almost triple the 1.1% gain of Q4 2023. Further reversing the signs on exports and imports, the growth of real final sales to domestic purchasers is expected to have accelerated from .7% to 2.5% – the fastest pace since the 8.2% leap of spring 2021. Looking beyond Q1, economists anticipate an extended period of below-trend growth through spring 2024.
CHART 2 UPPER RIGHT
Source: Bloomberg. Top pane is yield (LHS, %), bottom pane is change (bps). From last Thursday afternoon to this one, UST term yields were higher, with the 2-year up by ~20 bps to lead the move. The 1 to 5-year sector led the curve’s bear flattening. Economic data continues to generally reflect some moderation in inflation forces and a bit of loosening in the job market, but it appears not enough and too early to dissuade the Fed from another rate hike. Multiple Fed members this week indicated that, while acknowledging some economic slowdown and potential credit constraints building, another rate hike is likely in store. As of this Thursday afternoon’s writing, the market prices the odds of a 25 bps hike at the May 3rd FOMC at ~88% (up from last week’s 73%), and June, at ~5.11% (up 10 bps from last week), is the peak rate on the short-end Fed Funds forward curve. The year-end forward is ~4.57%, up 24 bps from last week, and so Fed easing is still priced into the curve for later this year but to a less extent than last week and much less than during March’s turmoil. Please call the Member Services Desk for further information on market dynamics and/or products.
CHART 3 LOWER LEFT
Source: JP Morgan, US Treasury. Here is a look at the weekly net issuance of T-bills (LHS, $bn, black bars actual, gray forecasted). Net issuance has recently been on the low and/or negative side, thereby spurring lower supply to meet recent voracious investor (such as money market funds) demand. With tax receipts having rolled in this past week, supply is unlikely to rebound soon in a big way, especially as Treasury continues to manage supply under the debt ceiling. And the debt ceiling issue, meanwhile, is driving investors to T-bill maturities before the forecasted “drop-dead” date in late July or August. Moreover, agency paper has benefited from these dynamics, as investors reach for incremental yield and/or steer away from T-bills and the debt ceiling issue.
CHART 4 LOWER RIGHT
Source: Bloomberg. Owing to the above dynamics, many short-tenor rates currently trade at low levels on a relative basis. Charted here (RHS, %) is the recent path of the Fed’s new BTFP (Bank Term Funding Program) rate. This rate is reset daily at 1-year OIS plus 10bps. While it was at low levels in late March, due to the market pricing aggressive Fed cuts into the forward curve in response to the banking industry turmoil, it has since notably reversed to 5.01% as of this writing. Meanwhile, notated on the right-axis are the Fed’s current IOER (Interest on Excess Reserves) rate and the Fed Funds effective rate. Our short-term advance rates have recently been at compelling levels, on a relative basis, to these data points. Please call the Member Services Desk for further information and/or rate quotes.
FHLBNY Advance Rates Observations
Front-End Rates
- Short-end rates were mixed but mostly higher from a week ago. The 2-week-and-in tenors were 5 to 6 bps lower, as they benefited from the market dynamics detailed in the previous slide. Tenors 3-week-and-out increased by 2 to 10 bps in steepening fashion. While some of these tenors also benefited from the same market dynamics, their maturity dates have now crossed over the timeline of an expected Fed hike on May 3rd. Please see the previous section for color on Fed pricing.
- With the Fed in blackout mode before the May 3rd decision, economic data should dictate direction this week.
Term Rates
- The longer-term curve, generally mirroring moves in USTs and swaps, was ~11 to 15 bps higher in bear flattening fashion. Up by ~17 bps, the 2-year led the move. Kindly refer to the previous section for relevant market color. The advance curve remains inverted out to 5-year, thereby offering opportunities to extend in advance duration at lower coupon cost.
- On the UST term supply front, this upcoming week serves 2/5/7-year auctions. Please contact the Member Services Desk for further information on market dynamics, rate levels, or products.
Product Alert: FHLBNY is pleased to announce the reintroduction, after a temporary suspension owing to Libor-cessation, of the Putable Advance, Fixed-Rate with SOFR Cap Advance, and ARC with SOFR Cap/Floor Advance. The Callable Advance continues to be offered. This expansion of the product menu will provide members with more options and flexibility for the management of funding and/or hedging needs.
Forward Start Advance (FSA): For members with upcoming borrowing or refunding plans, consider the FSA as a method to opportunistically “lock in” rates before advance settlement date. Please contact the Member Services Desk at (212) 441-6600 for more information.
The Symmetrical Prepayment Advance Feature
For those anticipating term funding needs, and with rates on an uptrend, it can be an appropriate juncture to consider our SPA feature. This feature allows the member to capture, at prepayment, changes in the fair value of the advance which are favorable to the member. Contact Member Services Desk to discuss.
Looking for more information on the above topics? We’d love to speak with you!
Questions?
If you wish to receive the MSD Weekly Market Update in .pdf format (includes FHLBNY rate charts) or to discuss this content further, please email the MSD Team.