Member Services Desk
Weekly Market Update
Economist Views
Click to expand the below image.
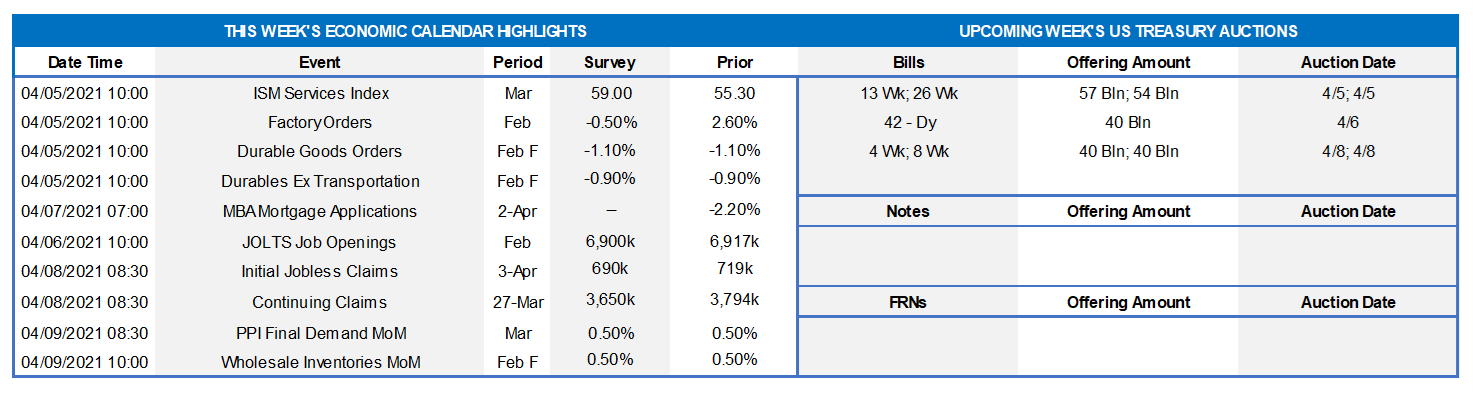
Last week’s economic soundings for March topped consensus expectations by considerable margins. That trend is likely to continue over the course of this month, especially with reports on retail sales, industrial production, and new residential building activity. The upcoming slate of indicators will be light, however. Echoing the upbeat manufacturing measure, the Institute for Supply Management’s (ISM) index of service-producing activity may have risen to an all-time high in March. Online job postings suggest that available positions probably crossed the 7mn mark in February. The minutes of last month’s Federal Open Market Committee meeting will provide valuable insight into policymakers’ current views on economic activity and the stance of monetary policy. Fed officials will make a half-dozen appearances this week. Top of the list will be Fed Chair Powell’s participation at the International Monetary Fund’s (IMF) annual spring meeting.
ISM Services Purchasing Managers Index: District Federal Reserve Bank canvasses suggest that the ISM’s service-producing activity barometer rose sharply from February’s 55.3% reading in March and might possibly top the record-high 62.0% reading of August 1997.
JOLTS Job Openings: A reported increase in online job postings suggests that the Bureau of Labor Statistics’ count of available positions probably climbed by 158K to a 13-month high of 7.075mn in February.
Jobless Claims: Initial and continuing claims under regular state unemployment insurance programs probably moved lower during their respective reporting periods. Those figures continue to understate the adverse impact of the pandemic and the slow healing of the domestic labor market, however. Indeed, as of March 13, an estimated 18.2mn persons were receiving some sort of unemployment assistance, down from the pandemic peak of 32.4mn reached last June but still well above the 2.1mn prevailing before COVID-19 struck in March 2020.
Producer Price Index: Powered by projected hikes in energy costs, the Producer Price Index (PPI) for final demand likely climbed by .5% in March, after a similar increase in February. Excluding anticipated changes in food and energy costs during the reference period, the core PPI probably edged 0.2% higher, also matching the reported prior-month gain. The consensus projections, if realized, would place the overall and core PPIs 3.8% and 2.5% above their respective year-ago levels.
Apr. 7 : Federal Reserve Appearances: Chicago Fed President Evans to discuss economic outlook at virtual event hosted by Prairie State College Foundation.
Apr. 7: Dallas Fed President Kaplan to take part in a panel discussion hosted by UBS.
Apr. 7: Richmond Fed President Barkin to discuss the economy and monetary policy at a virtual event hosted by GIC.
Apr. 7: zinutes of Federal Open Market Committee March 16-17 meeting to be released.
Apr. 8: St. Louis Fed President Bullard to discuss outlook and monetary policy at event hosted by Southern Illinois University.
Apr. 8: Fed Chair Powell to participate in panel discussion on the global economy at IMF spring meeting.
Apr. 8: Dallas Fed President Kaplan to take part in a pair of moderated Q&A sessions.
Click to expand the below images.
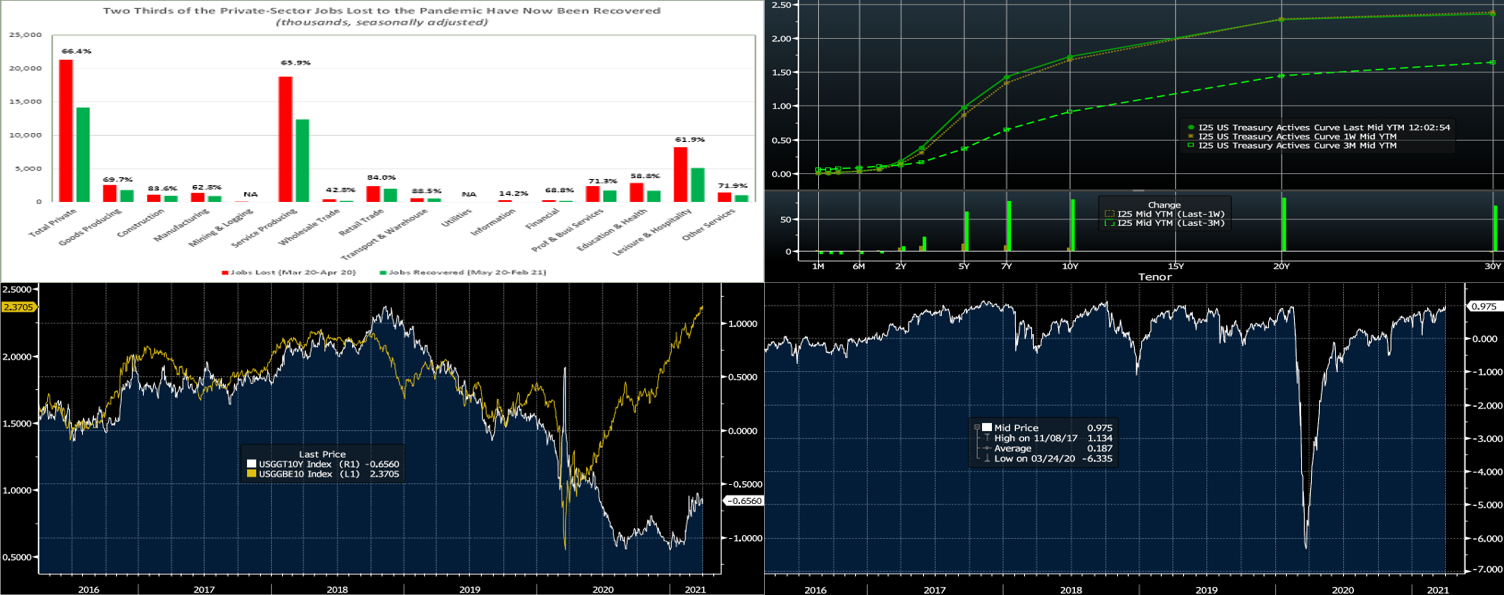
CHART 1 – UPPER LEFT
Source: Bureau of Labor Statistics, FHLB-NY. The Bureau of Labor Statistics reported that non-farm payrolls swelled by 916K in March, following upwardly revised gains of 468K (was 379K) in February and 233K (was 166K) in January. Last month’s job gain was well above the 650K anticipated by the Street, with prior-month adjustments adding 156K to the aggregate headcount level. Progress on the economic and vaccine front continues to recoup the jobs lost to the COVID-19 pandemic. To date 13.96mn, or 62.4%, of the 22.36mn non-farm jobs lost over the March-April 2020 span have been recovered. While currently lagging, the hardest hit sectors can be expected to make significant strides in coming months as vaccines become more widely distributed across the country.
CHART 2 – UPPER RIGHT
Source: Bloomberg. Note: top pane is yield (%), bottom pane is change (bps). Led by the belly (4 to 10-year sector) of the curve, UST yields pressed higher week-over-week. While shorter maturities finished 4-5 bps higher, the 3 through 7-year sector was ~10-13 higher, the 10-year ~5 higher, and the 20 to 30-year roughly unchanged. Economic data released over the week, most notably on the employment front, was positive and better than expectations. The Covid-19 situation still threatens at elevated levels, but the accelerating upward trend in vaccinations continues to spur higher activity, as evidenced by rising consumer mobility (dining/travel/”out and about”) data, thereby bolstering economic optimism and projections. Of consequence as well the past week was the Biden Administration’s unveiling of its infrastructure plan; while its spending would be gradual over time (years) and uncertainty prevails over what form and size of the plan can indeed pass Congress, it nonetheless can lead to upward adjustments to forecasts of both economic data and UST supply. These dynamics continue to underpin the yield curve. For perspective on the first quarter of 2021, note the significant “bear steepening” of the curve that occurred.
CHART 3 – LOWER LEFT
Source: Bloomberg. Portrayed here is the 10-year TIPS (Treasury Inflation Protected Securities) yield (RHS, also referred to as “real” or post-inflation yield) vs. the 10-year “Breakeven Inflation rate” (LHS). As a refresher, the latter is derived from the following equation: Nominal UST yield = Real Yield + Breakeven Inflation rate. The market has priced inflation higher during the pandemic recovery and in recent months; indeed, the increase has outpaced that of real yields. At this stage, even if inflation markups have “run their course”, there is historical scope for real yields to rise further as the economy improves and UST supply continues to increase.
CHART 4 – LOWER RIGHT
Source: Bloomberg. Depicted here is the Bloomberg U.S. Financial Conditions Index which tracks the overall level of financial stress in the U.S. money, bond, and equity markets to help assess the availability and cost of credit. A positive value indicates accommodative financial conditions, while a negative value indicates tighter financial conditions relative to pre-Great Financial Crisis norms. Despite the rise in yields of Q-1, overall conditions reside at accommodative levels and are likely a reason that the Fed has not expressed undue concern over the yield curve’s move in the quarter.
FHLBNY Advance Rates Observations
Front-End Rates
Short-end Advance rates finished unchanged week-over-week. Government-Only Money Market Funds’ AUM surged by ~$52.9bn into quarter-end; this sector has infused demand for short paper in the past two months. Meanwhile, the GSEs have been placing larger sums into money markets. And the US Treasury General Account has been declining, thereby adding cash to the banking system. Short T-bills hover ~0% yield. From a bigger-picture vantage point, the overall moderation in the supply of short paper, relative to high cash levels in the market, is expected to keep short-end rates relatively steady and under downward pressure in the year’s first half.
UST issuance overall is now net positive supply in that more is being issued than what the Fed is buying in its programs. However, with short UST rates at rock-bottom levels and the Fed on hold for a long period, rates are likely to persist in a near-term sideways to softer pattern. Importantly, weekly net T-bill issuance has been lower since last summer and even negative at times in recent weeks/months, and Treasury has announced plans to shift issuance out the curve. The latest relief package and related borrowing likely will lead to an increase of T-bill auction sizes and positive net supply, but overall market supply/demand dynamics should keep short rates in check on the upside.
Term Rates
On the week, medium and longer-term Advance rates were anywhere from unchanged in the 20-year-plus zone to 5 to 12 bps higher in other maturities; the largest increases were in the 3 to 7-year sector. Kindly refer to the previous section for further color on relevant market dynamics.
On the UST supply front, this week allows the market another reprieve. Recent auction sizes have been of record size and another contributor to the curve’s moves in Q-1. Much of Europe enjoys a long holiday weekend, and so activity and corporate supply may be light to begin the week. The market will keep focus on further Covid-19 and infrastructure bill developments; the Minutes from the last FOMC meeting will also be dissected for any signs of market-moving potential.
New Product Alert: In order to satisfy member needs and provide greater product flexibility to match bond and derivative market conventions, FHLB-NY now offers SOFR-linked advances based on SOFR-index compounding. Note that this product is in addition to SOFR-linked advances based on SOFR-index averaging which have been offered since November 2018.
The Symmetrical Prepayment Advance Feature
With rates at or near multi-year lows, it is a compelling juncture to use the SPA feature on term advances. This feature allows member to capture, at prepayment, changes in the Fair Value of the advance which are favorable to the member. Contact us to discuss.
Looking for more information on the above topics? We’d love to speak with you!
Questions?
If you wish to receive the MSD Weekly Market Update in .pdf format (includes FHLBNY rate charts) or to discuss this content further, please email the
MSD Team.
Special Member Alert
The FHLBNY recently announced a newly expanded and flexible Disaster Relief Funding (DRF) advance program which offers discounted rate advances with maturities 1-mo and greater. Additionally, we have announced that PPP loans will be accepted as eligible collateral. Please contact us with any questions.