Member Services Desk
Weekly Market Update
This MSD Weekly Market Update reflects information for the week ending May 16, 2025.
Economist Views
Click to expand the below image.
**The Weekly Market Update will return on Friday, May 30th – Best wishes for Memorial Day weekend.**
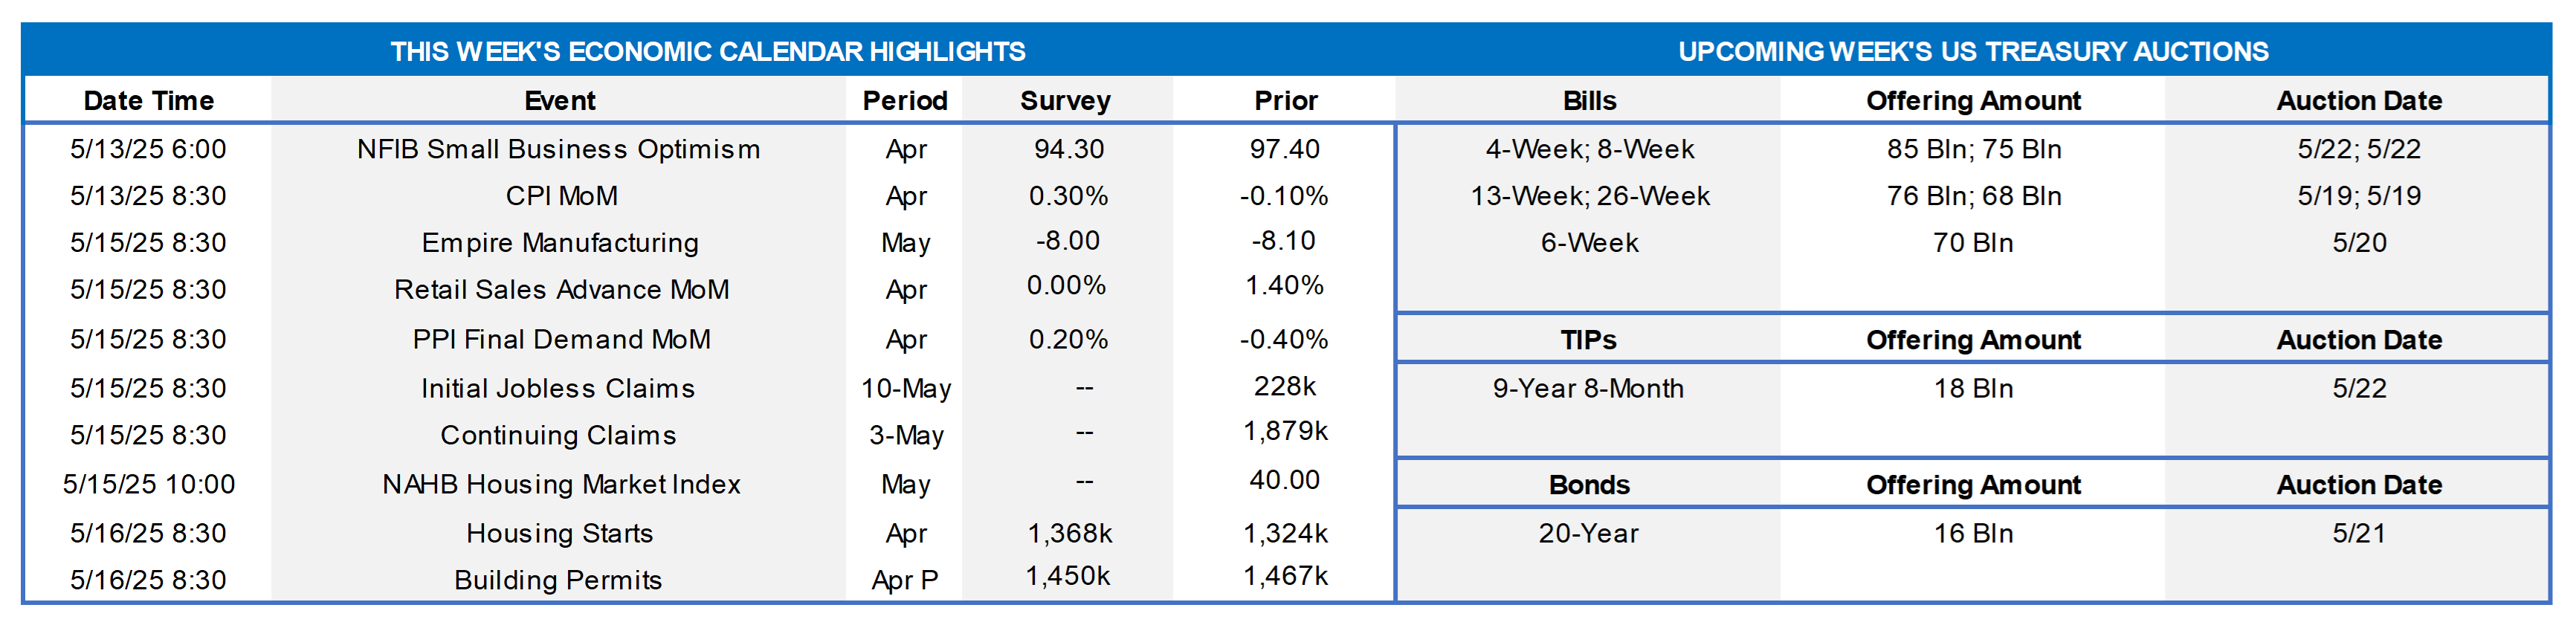
Market participants will face an extremely light economic release calendar leading into Memorial Day weekend. Contracts to purchase a newly constructed home and closings on existing dwellings both probably climbed higher in April. Leading indicators likely dipped for a fifth straight month. Yet, initial and continuing jobless claims remained near recent levels. The median economist forecast calls for a .9% annualized increase in real GDP during the current quarter, following Q1’s .3% dip, while estimates from the Atlanta and New York Federal Reserve Banks are tracking near 2¼%. A quintet of monetary policymakers will appear at the Federal Reserve Bank of Atlanta’s conference on “Financial Intermediation in Transition.”
Leading Indicators: The Conference Board’s augur of prospective business-cycle turning points is expected to have fallen by .8% in April, boosting the cumulative decline since last November to 2%. There remains little evidence that the economy is in any danger of faltering, however. Indeed, a model constructed by the Federal Reserve Bank of St. Louis estimated that the probability that the economy was in recession in March at a negligible .8%.
Jobless Claims: Labor market conditions probably were little changed during the week ending May 17 – the survey period for the Bureau of Labor Statistics’ upcoming employment report – with initial claims for unemployment insurance benefits remaining in a historically low 220K-230K range. The number of persons receiving regular state benefits likely registered below 1.9mn once again during the week ended May 10, implying that recent job-losers are having little difficulty finding work.
Existing Home Sales: Rising home-purchase contract signings over the February-March span suggest that existing home sales climbed by 3.5% to a seasonally adjusted annual rate of 4.16mn in April. With the number of available homes on the market likely to jump by 8.3% to a near 4½-year high of 1.44mn on a not seasonally adjusted basis during the reference period, the supply at the estimated sales pace would edge two ticks higher to 4.2 months.
New Home Sales: Home-purchase mortgage applications suggest that new homes entering contract rose by 3.6% to a three-year high seasonally adjusted annual rate of 750K in April.
Federal Reserve Appearances:
- May 18-21, Atlanta Federal Reserve Bank’s Conference on “Financial Intermediation in Transition.”
- May 19, New York Fed President Williams to speak at an event organized by the Mortgage Bankers Association.
- May 20, St. Louis Fed President Musalem to speak on the economy and monetary policy at the Economic Club of Minnesota.
- May 22, New York Fed President Williams to give keynote address at a New York Fed event.
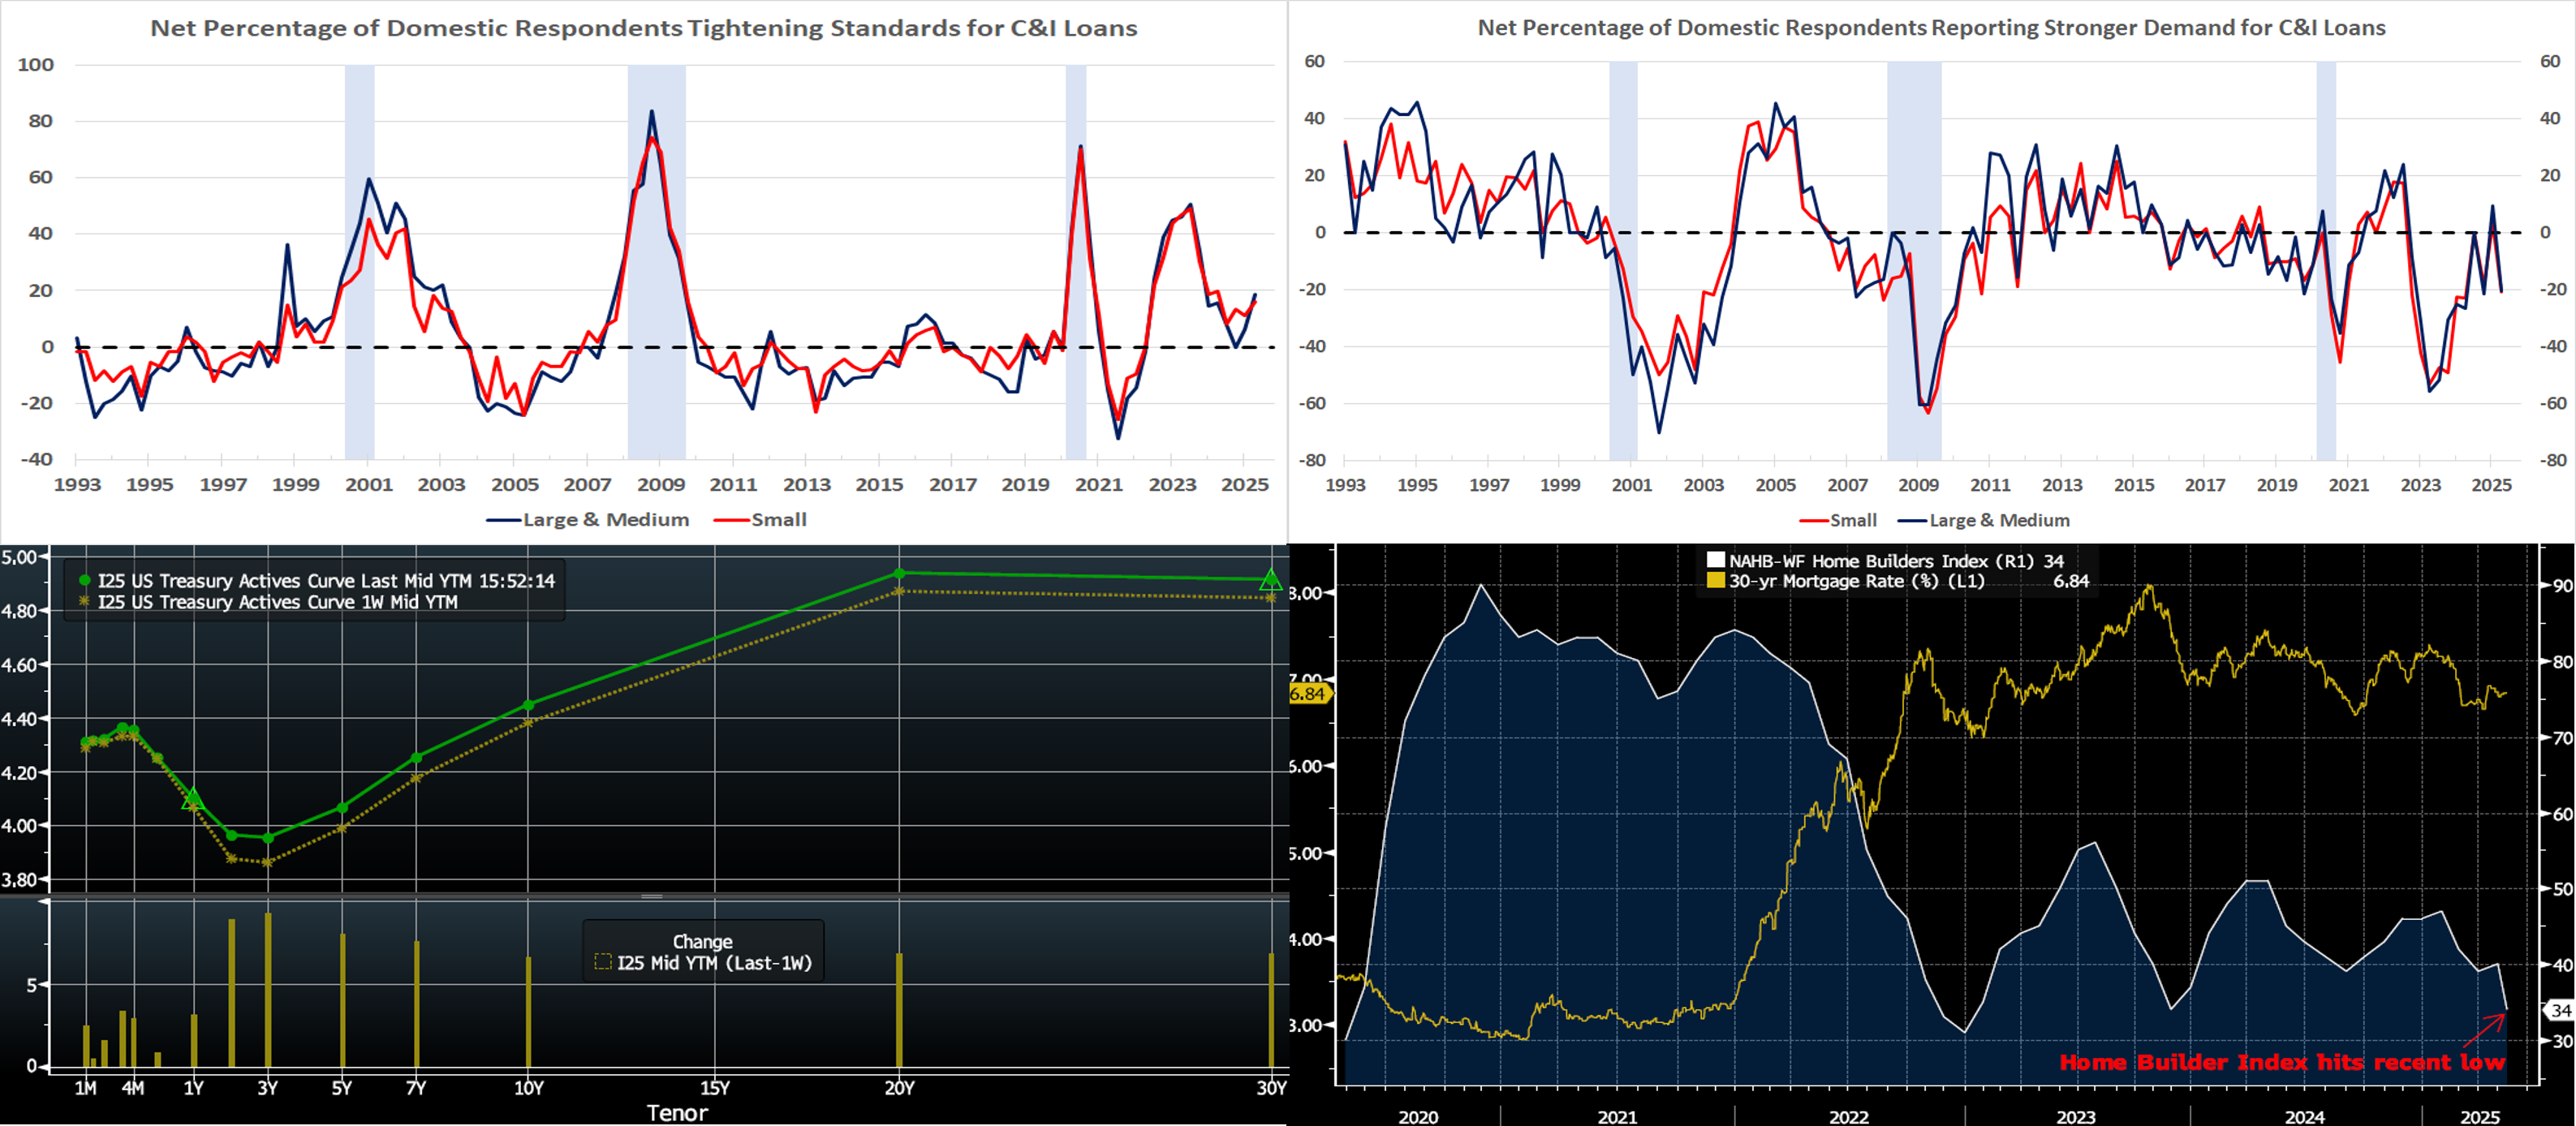
CHART 1 UPPER LEFT and CHART 2 UPPER RIGHT
Sources: Board of Governors of the Federal Reserve System; National Bureau of Economic Research; FHLBNY. Notes: Blue-shaded areas denote recessions. Released this week, the Federal Reserve’s Senior Loan Officer Opinion Survey on Bank Lending Practices revealed that commercial banks tightened credit standards for commercial & industrial (C&I) loans amid weakened demand during Q1. Indeed, the net percentage of domestic loan officers reporting tighter standards for such borrowings by large and medium-market firms jumped to a six-quarter high of 18.5%, while that for smaller entities with less than $50mn in annual sales rose by almost five percentage points to 15.9% – the most restrictive reading since the winter of 2024. The net percentages of bankers witnessing increased demand for C&I loans by firms with more than $50mn in annual sales slumped to -20.3% during the reference period from 9.4% last fall, while the barometer for smaller entities dropped from 3.2% to -20.6%. Among banks that reported having tightened standards and terms for C&I loans, major net shares cited a less favorable or more uncertain economic outlook, increased concerns about the effects of legislative changes, supervisory actions or changes in accounting standards, the worsening of industry-specific problems, and a reduced tolerance for risk as important reasons for doing so. The most frequently cited reasons for weaker demand, as reported by major net shares of banks, were decreased customer investment in plant or equipment and decreased customer financing needs for mergers or acquisitions. While not charted herein regarding commercial real estate (CRE) loans, banks also reported tighter or basically unchanged lending standards amidst weaker or basically unchanged demand. For residential real estate loans, banks reported basically unchanged lending standards and weaker demand.
CHART 3 LOWER LEFT
Source: Bloomberg. Top pane is yield (LHS, %); bottom pane is change (LHS, bps). At Thursday’s close and relative to a week prior, the UST term curve was higher by 6 to 9 bps, with the 2 and 3-year leading the move. The start-of-the-week news of a temporary US-China “tariffs détente” precipitated the backup in yields. Market strategists downgraded recession probabilities, and the curve notably repriced lower/later Fed easing expectations. As of late Thursday, the market prices end-2025 fed funds at 3.78%, or 13 bps higher than a week ago and which equates to ~2.2 25-bps Fed cuts. The market’s end-2026 forward is ~3.30%, or 10 bps higher than a week ago.
CHART 4 LOWER RIGHT
Source: Bloomberg; National Association Home Builders (NAHB); Wells Fargo (WF). Released Thursday morning and below expectations, the latest NAHB-WF Home Builder index (White, RHS) revealed that confidence among builders slumped to the lowest level since late 2023. Each of the three index components, namely expected sales, present sales, and prospective buyer traffic, fell to the lowest levels in 18 months or longer. According to the release, contributing factors to the decline were persistently higher rates, policy uncertainty, building material costs, and faltering consumer confidence. The report cited that nearly 80% of builders reported having difficulty pricing homes because of uncertainty, driven much by tariff policy, about the cost of materials. It should be noted that much of the report’s data was gathered prior to this past week’s US-China temporary “tariffs détente”. Also of note is that when the index was this low in late-2023 mortgage rates (Gold, LHS %) were higher than current levels, thereby indicating that non-rate factors are now exerting a heavy impact on sentiment.
FHLBNY Advance Rates Observations
Front-End Rates
- As of Thursday afternoon, short-end rates were mildly mixed vs. a week ago. The 1-month-and-in sector was unchanged to a bp or two lower, while 2-month-and-out was 1 to 3 bps higher due to market repricing of potential Fed cuts this year. Of note, our funding spreads have experienced tightening in recent weeks; this trend is most visible in our short-term ARC (floater) product. Robust Money Market Fund AUM levels have helped underpin demand for short-end paper, and cash has gradually returned to the sector post the usual April tax-date withdrawals. Also helpful is that net T-bill supply is expected to be modestly negative in the month ahead, owing to debt ceiling dynamics.
- The market will focus on a light economic data slate and any trade policy developments in the upcoming week.
Term Rates
- The longer-term curve, generally mirroring moves in USTs and swaps, was higher by 2 to 9 bps from the week prior, led by the 2- to 5-year zone. Kindly refer to the previous section for color on market dynamics and changes. We encourage members to engage with the desk for current rate levels and market color.
- On the UST term supply front, the upcoming week serves a 20-year nominal and a 10-year TIPS auction. Note that UST auctions usually occur at 1pm and can occasionally spur volatility around that time. Please contact the Member Services Desk for further information on market dynamics, rate levels, or products.
Price Incentives for Advances Executed Before Noon: In effect as of Tuesday, September 5, 2023, the FHLBNY is pleased to now offer price incentives for advances executed before Noon each business day. These pricing incentives offer an opportunity to provide economic value to our members, while improving cash and liquidity management for the FHLBNY. For further details, kindly refer to the Bulletin.
Looking for more information on the above topics? We’d love to speak with you!
Archives
Questions?
If you wish to receive the MSD Weekly Market Update in .pdf format (includes FHLBNY rate charts) or to discuss this content further, please email the MSD Team.