Member Services Desk
Weekly Market Update
This MSD Weekly Market Update reflects information for the week ending December 8, 2023.
Economist Views
Click to expand the below image.
Please note that the employment situation report on Friday, 12/8, at 8:30 a.m. may impact markets and rate levels referred to herein.
The Federal Open Market Committee (FOMC) meeting will be the focus this week. Policymakers are almost universally expected to leave the target range for the federal funds rate unaltered at 5¼% to 5½%. Given the narrowing string of positive data surprises since their last gathering, the post-meeting communiqué likely will note that the economy is expanding at a modest pace. The statement will probably repeat that job gains have moderated since earlier in the year but remain strong, the unemployment rate has remained low, and inflation remains. Consistent with the data dependency of policy, the communiqué can be expected to again omit any forward guidance on the prospective direction of administered rates. The statement likely will also point out that in determining the extent of future increases in the federal funds rate target range, policymakers will consider the cumulative tightening of monetary policy, the lags with which policy affects economic activity and inflation, and economic and financial developments. A wide range of information, including labor market conditions, inflation dynamics, and financial and international developments, will continue to be monitored in assessing monetary policy. The FOMC will continue to reduce its holdings of USTs and agency debt, and agency MBS, as described in the Plans for Reducing the Size of the Federal Reserve’s Balance Sheet that was issued last year. To date, runoffs of maturing securities have pared the System Open Market Account to $7.293trn from the $8.495trn peak reached in July 2022.
As per convention, an updated Summary of Economic Projections, or SEP, will be released containing projections for the fed funds rate and key economic variables out to 2026 and over the longer run. The so-called “dot-plot” of rate forecasts will be closely watched and could have a material impact on markets. At the time of the September FOMC meeting, policymakers expected a fed funds target range of 5%-5¼% at the end of 2024. Market participants currently expect the FOMC to begin the process of easing as early as March and envision a rate ~4% by yearend 2024. The updated SEP probably will include boosts to GDP growth and unemployment rate forecasts for this year and marginally lower projections for overall and core consumer price inflation.
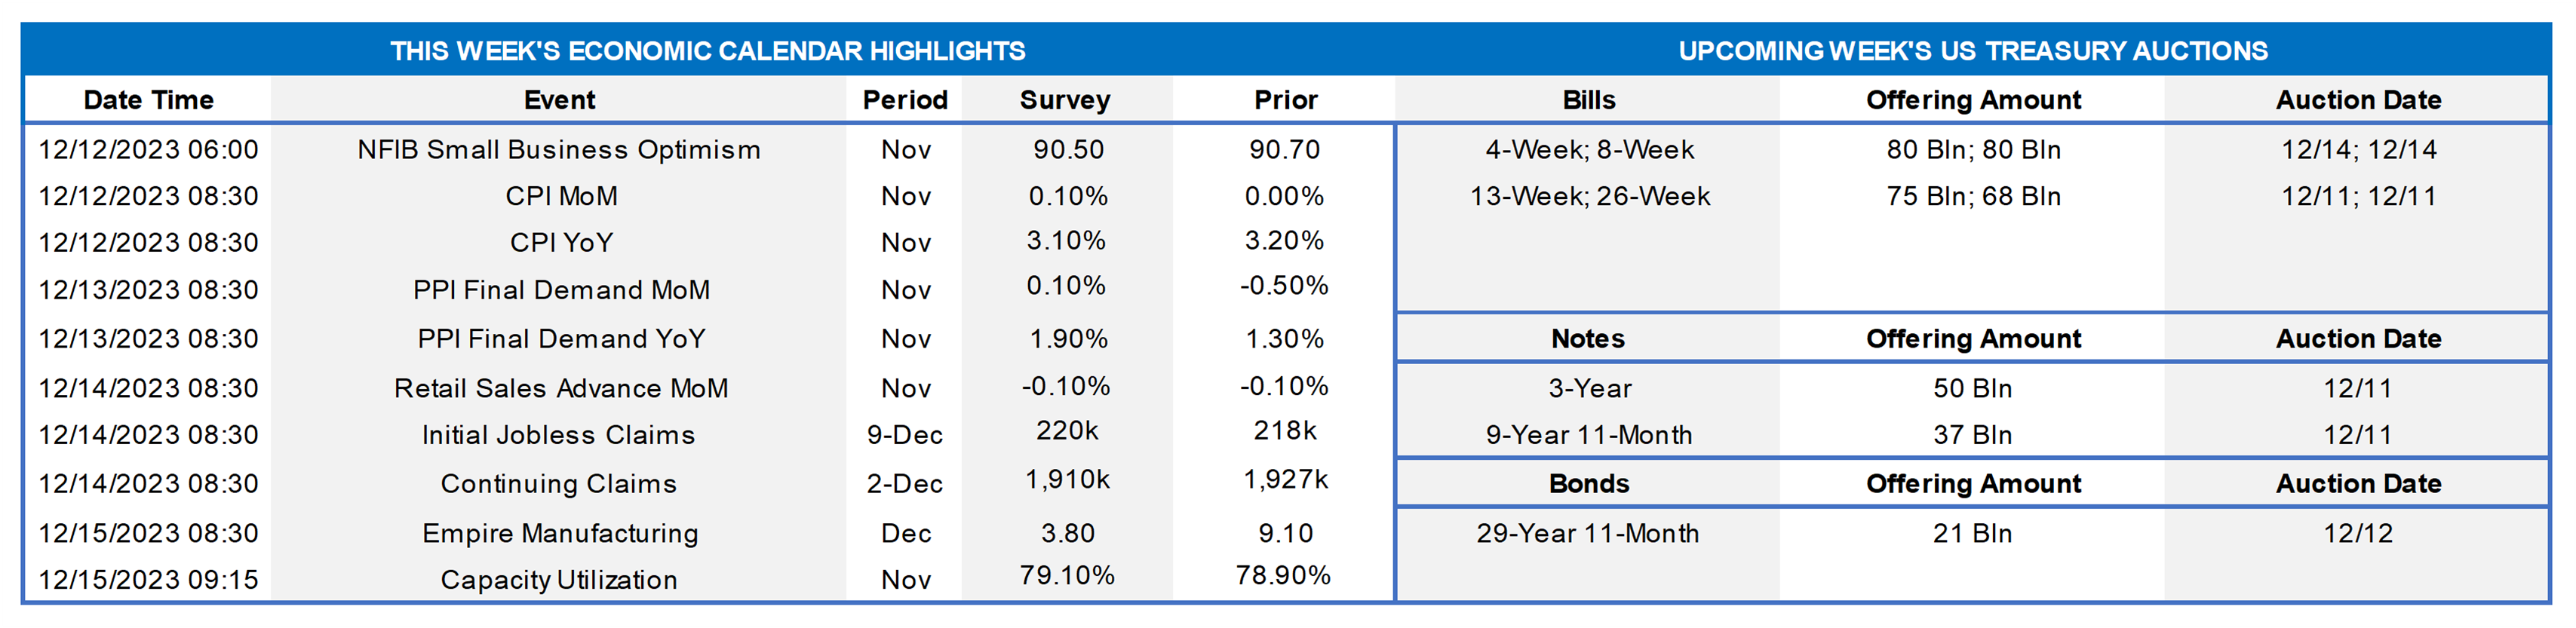
NFIB Small Business Optimism Index: Canvasses of larger firms suggest that sentiment improved to a 14-month high of 92 in November from 90.7 in October.
Consumer Prices: Prompted by dips in gas prices, CPI likely fell by .1% in November – the first reduction in the headline gauge since May 2020. Capped by anticipated reductions in auto costs, the core excluding volatile food and energy probably climbed by .2%, after a similar uptick in October. If realized, this would leave the overall and core CPIs 2.9% and 3.9% above their respective year-ago levels.
Producer Prices: Echoing the projected decline in the CPI, the Producer Price Index for final demand probably moved lower last month, following a .5% decline in October.
Retail & Food Services Sales: Pared by a reported decline in auto purchases, retail and food services sales probably dipped by .1% in November, after a similarly modest pullback in the prior month.
Empire State Manufacturing Survey: Manufacturing activity in New York State is expected to have expanded in early December, albeit at a slower clip than in the preceding month. The median economist estimate calls for the gap between survey respondents experiencing a pickup in general business conditions and those witnessing a decline to narrow to 3.8% from 9.1% in November.
Industrial Production & Capacity Utilization: Powered by a rebound in auto output post the UAW strike resolution, production likely climbed by .4% in November, reversing two-thirds of the .6% contraction posted in October. With output gains expected to eclipse additions to productive capacity during the reference period, the overall operating rate probably moved four ticks higher to 79.3%.
Federal Reserve Appearances: Dec. 13 – FOMC policy announcement and release of updated Summary of Economic Projections. Chair Jerome Powell to hold post-FOMC-meeting press conference.
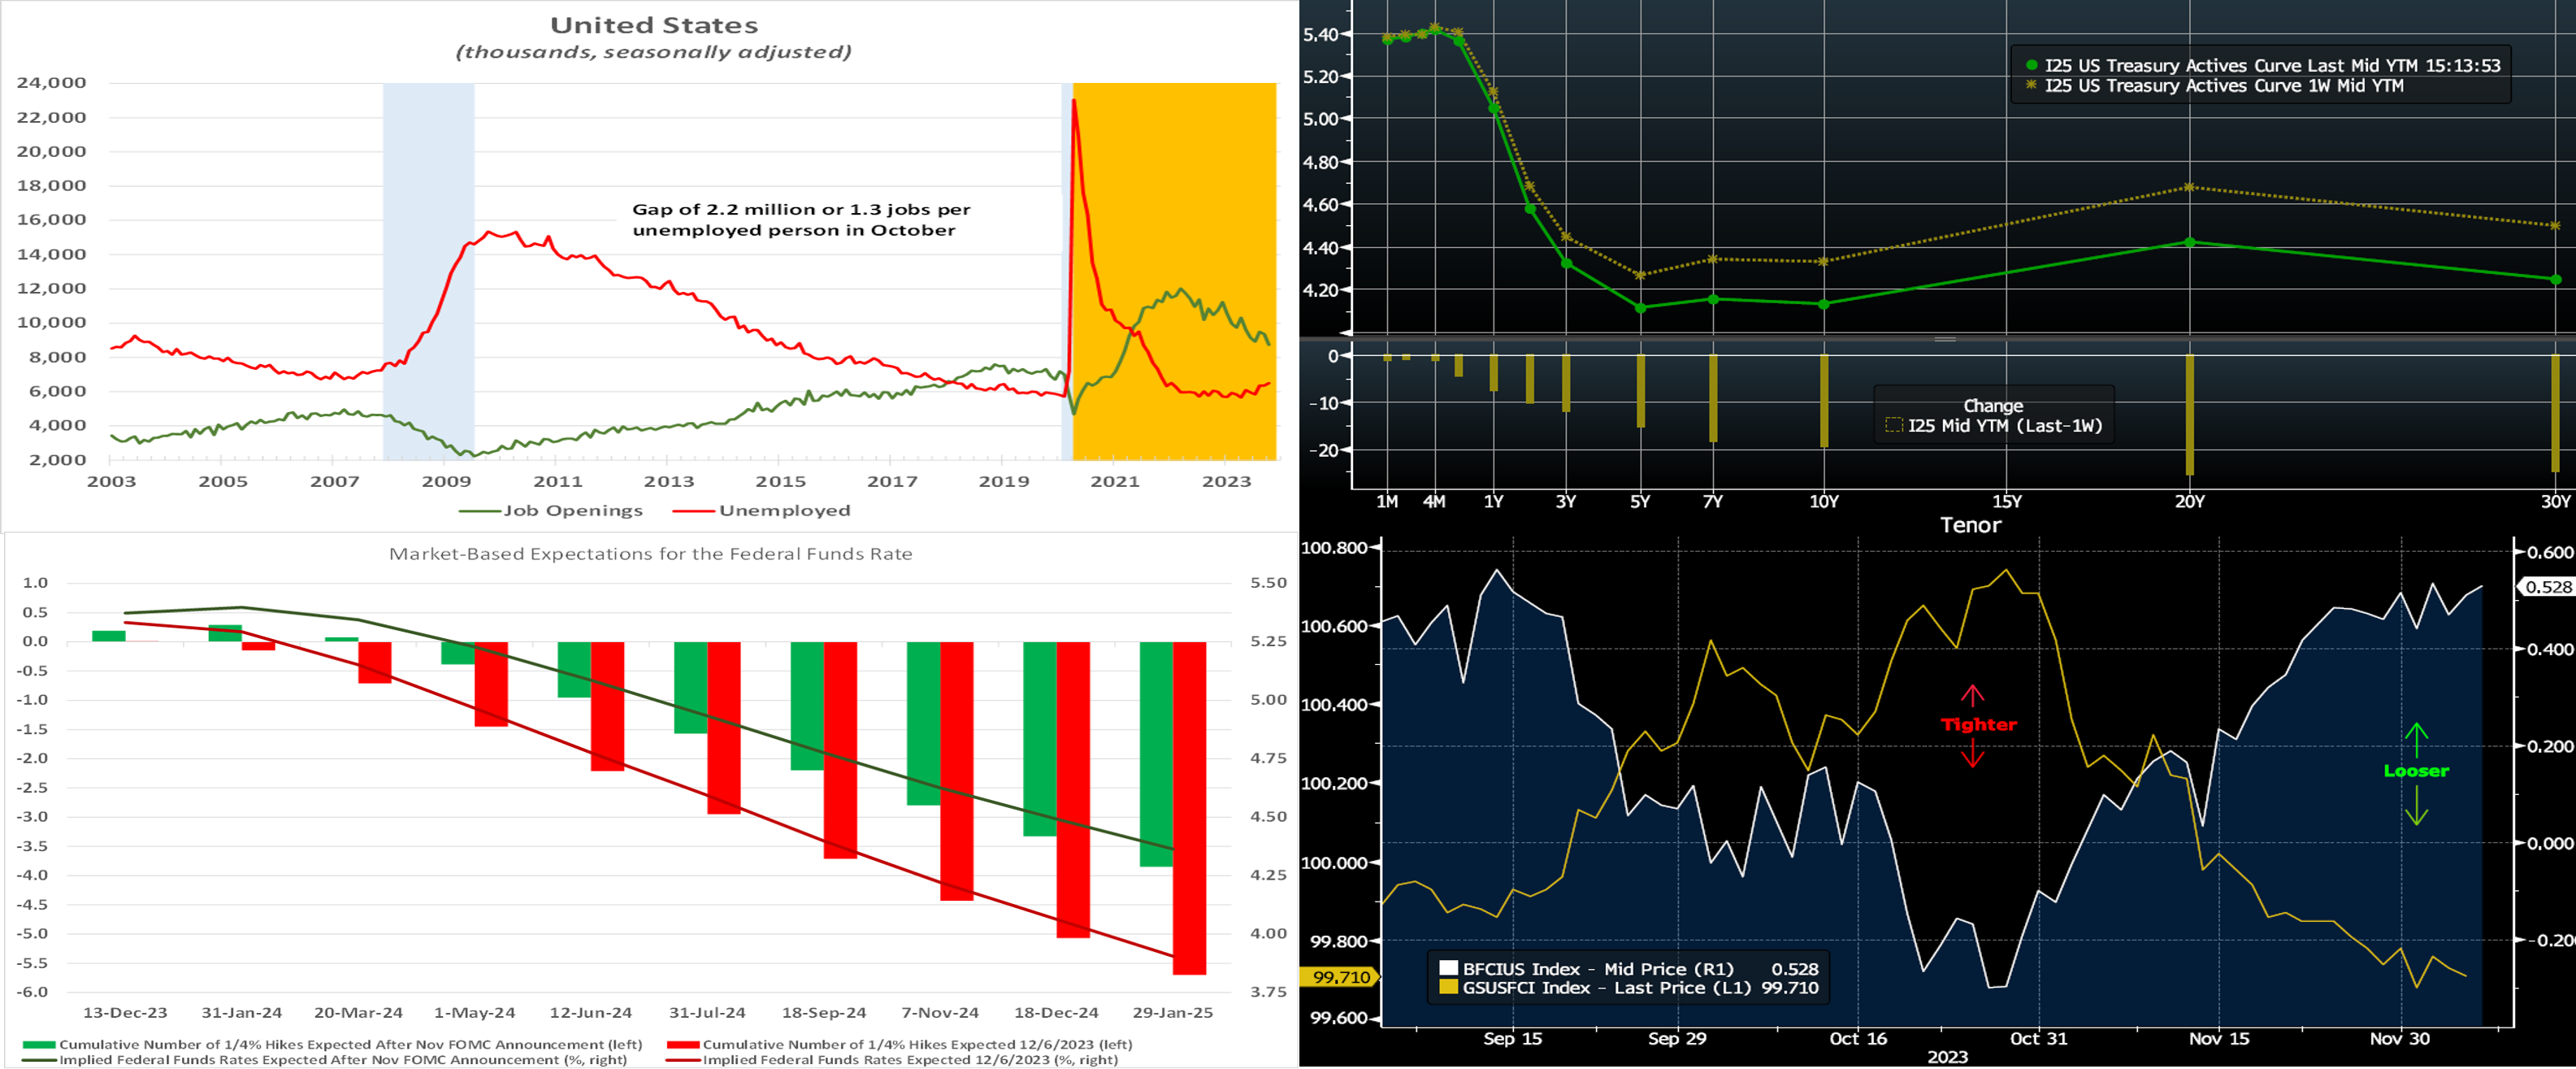
CHART 1 UPPER LEFT
Source: Bureau of Labor Statistics; National Bureau of Economic Research; FHLB-NY. Notes: Blue-shaded areas denote recessions; Orange-shaded area highlights current economic expansion. The number of available positions nationwide contracted by 617K to a little over 8.7mn in October. Down from the record peak of 12mn set in March 2022, the October tally marked the fewest job openings since March 2021. Fewer unfilled positions in finance & insurance, health care & social assistance, and accommodation & food services accounted for all but a fraction of the reported decline. Despite the recent downtrend, at 2.2mn, the number of job openings continues to eclipse the unemployed by a wide margin. Indeed, there were still 1.3 jobs per unemployed person during the reference period – well above the .7 average recorded since the JOLTS survey’s inception in December 2000. Nonetheless, the data point spurred yields to move lower this past Tuesday, given that it fits the “soft-landing” theme.
CHART 2 UPPER RIGHT
Source: Bloomberg. Top pane is yield (LHS, %), bottom pane is change (LHS, bps). From last Thursday afternoon to this one, the UST curve bull flattened, with longer tenors leading the continued decline in yields toward levels last seen back in the summertime. The 2-year was ~11 bps lower, while the 5 and 10-year were ~15 and 19 bps lower, respectively. Fedspeak was in blackout mode, but some “soft-landing narrative” friendly jobs data (JOLTS, ADP) prompted yields to tack lower. In terms of market-implied pricing of the Fed, the chance of another hike has been almost fully priced out. Meanwhile, deeper cuts have again been priced into the curve for mid-2024, with cumulatively now ~35 bps of cuts in May. The year-end 2024 forward is ~15 bps lower from a week ago, now ~4.05%.
CHART 3 LOWER LEFT
Source: Bloomberg; FHLB-NY. Here is a current, as well as a comparison to post the last FOMC, view of the market’s pricing of Fed Funds rate expectations (RHS, %; LHS, cumulative number of 25 bps moves). In the past month, the market has notably priced for earlier and larger cuts in the year ahead. As covered in our recent editions, this market move was precipitated by a set of softer-than-expected economic data and less hawkish Fedspeak. The market now prices full probability for a rate cut in Spring 2024. And it prices just over five cuts by end-2024, with a year-end 2024 rate of ~4.05% which is over 100bps lower than the Fed’s last dot plot from September! It will be interesting to learn how the FOMC’s fresh dot plot compares to market pricing and the potential market impact.
CHART 4 LOWER RIGHT
Source: Bloomberg. Shown here are two popular financial conditions indices (FCI). The Bloomberg U.S. FCI (RHS, White) tracks the overall level of financial stress in the U.S. money, bond, and equity markets to help assess the availability and cost of credit. A positive value indicates accommodative financial conditions, while a negative value indicates tighter financial conditions. Goldman’s index (LHS, Gold), meanwhile, is defined as a weighted average of riskless interest rates, the exchange rate, equity valuations, and credit spreads, with weights that correspond to the direct impact of each variable on GDP. An increase in the Goldman FCI indicates a tightening of financial conditions, and a decrease indicates an easing. As can be seen here, conditions tightened in the early Fall and into late October but have notably reversed since then. Surely, November’s large move lower in yields and rebound in stocks has contributed to the loosening conditions reflected in these indices. Heading into the FOMC, this dynamic could play a part in the Fed’s outlook or commentary, especially if the Fed is concerned about the market potentially getting “over its skis” in its pricing of rate cuts in 2024.
FHLBNY Advance Rates Observations
Front-End Rates
- Short-end rates were mixed week-over-week, with 3-week-and-under up a few bps, 1 to 3-month unchanged, and thereafter a few bps lower. The longer tenors dipped owing to the market’s pricing Fed expectations lower again. Net T-bill supply remains positive, given announcements from Treasury regarding upsized auctions and issuance needs. But the supply continues to be absorbed relatively well, as Money Market Funds (MMFs) switch from the Fed’s RRP to T-bills with competitive yields. Moreover, MMFs currently stand at or near all-time high AUM levels.
- The main event this upcoming week should be the December 13th FOMC meeting.
Term Rates
- The longer-term curve, generally mirroring the moves in USTs and swaps, moved lower and flatter. The 2-year dropped ~14 bps, while the 5-year fell ~19 and 10-year ~24 bps.
- On the UST term supply front, the upcoming week serves a pre-FOMC and potentially challenging slate of 3/10/30-year auctions. Note that UST auctions usually occur at 1pm and can occasionally cause volatility around that time. Please contact the Member Service Desk for further information on market dynamics, rate levels, or products.
Grant funding under the FHLBNY 2023 Small Business Recovery Grant (SBRG) Program has begun and some funds are still available. The SBRG Program provides grant funds to benefit FHLB-NY members’ small business and non-profit customers. Please visit the SBRG webpage.
Price Incentives for Advances Executed Before Noon: In effect as of Tuesday, September 5, 2023, the FHLBNY is pleased to now offer price incentives for advances executed before Noon each business day. These pricing incentives offer an opportunity to provide economic value to our members, while improving cash and liquidity management for the FHLBNY. For further details, kindly refer to the Bulletin.
The Symmetrical Prepayment Advance Feature
For those anticipating term funding needs, and with rates on an uptrend, it can be an appropriate juncture to consider our SPA feature. This feature allows the member to capture, at prepayment, changes in the fair value of the advance which are favorable to the member. Contact Member Services Desk to discuss.
Looking for more information on the above topics? We’d love to speak with you!
Questions?
If you wish to receive the MSD Weekly Market Update in .pdf format (includes FHLBNY rate charts) or to discuss this content further, please email the MSD Team.