Member Services Desk
Weekly Market Update
Economist Views
Click to expand the below image.
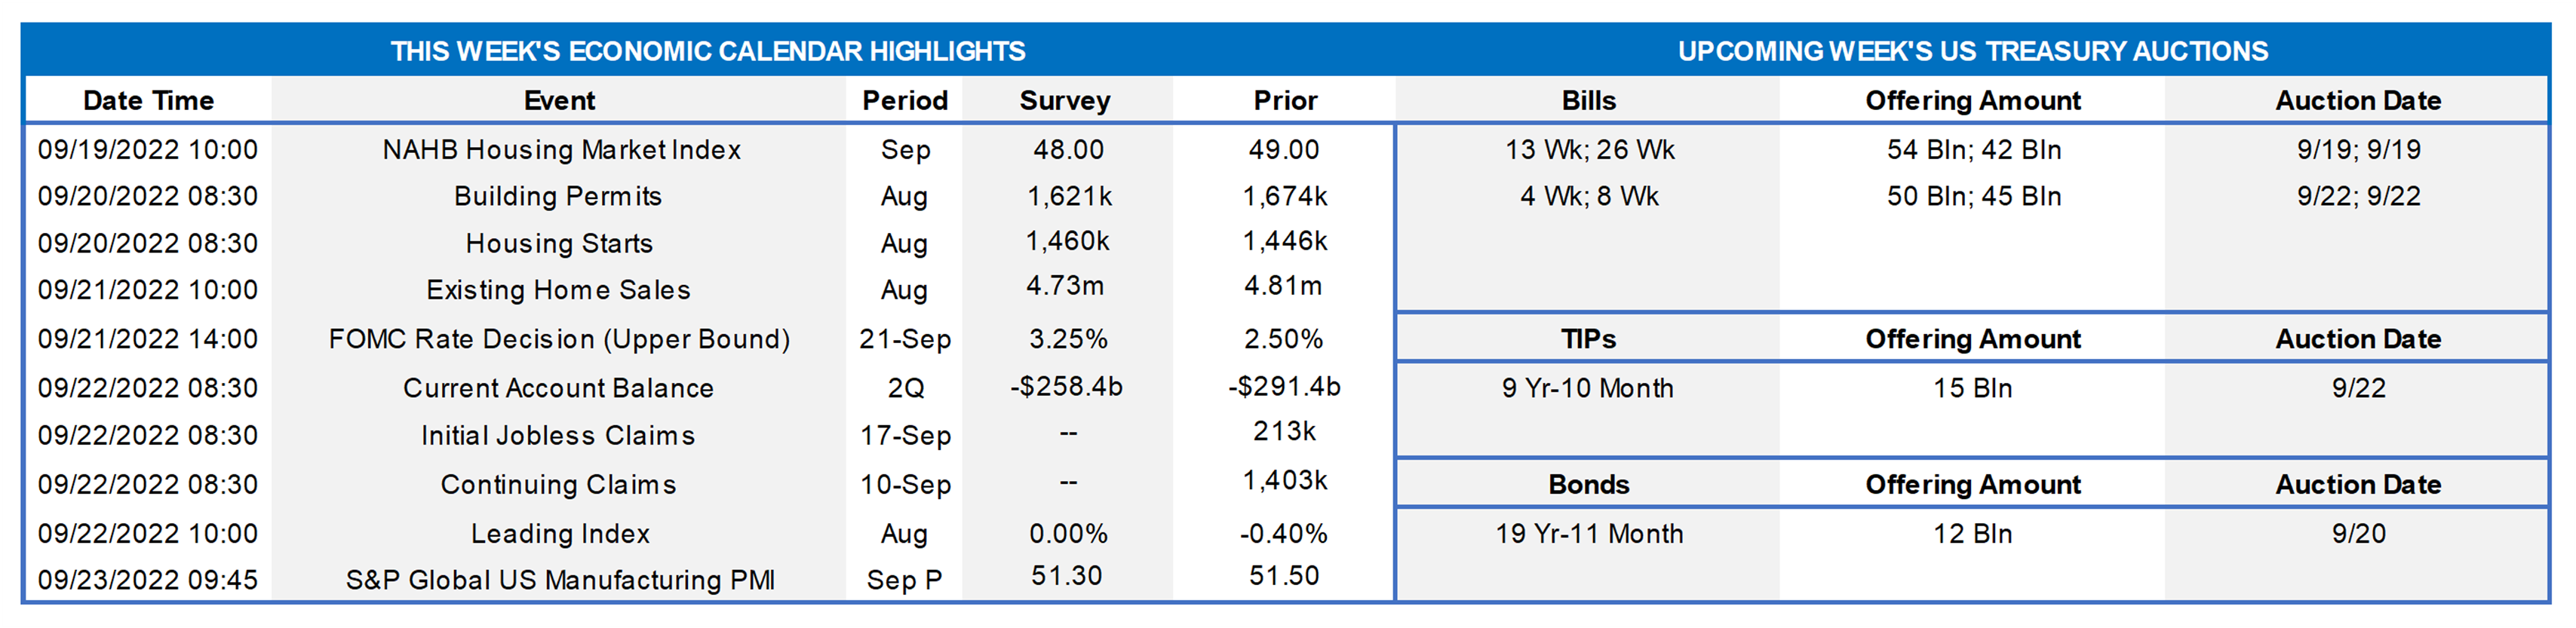
The Federal Open Market Committee meeting is the marquee event of the week. Market participants are certain of another 75-bps increase in the federal funds rate target range to 3% to 3¼% and place the chances of an even-more aggressive hike at ~20%. The post-meeting communiqué likely will note tight labor market conditions and reiterate that inflation remains elevated due to supply and demand imbalances related to the pandemic, higher energy costs, and broader price pressures. Given the tone of recent public appearances, policymakers likely will repeat that ongoing increases in the target range will be appropriate in coming months. The statement may also mention that the FOMC will continue to reduce its holdings of UST and agency debt and MBS, as described in the Plans for Reducing the Size of the Federal Reserve’s Balance Sheet that was issued in May. As part of the plan to reduce the size of the $8.4trn System Open Market Account, the monthly caps for UST and holdings of MBS that the central bank will let mature doubled to $60bn and $35bn, respectively, per month in September.
Per convention, the Fed will also release an updated Summary of Economic Projections (SEP). With the market now expecting the tightening cycle to end next March, the so-called “dot plot” will be scrutinized for changes to policymakers’ rate projections over the year-end 2022-2025 horizon. Turning to the remainder of the SEP, data released since the June FOMC meeting suggest that officials’ median projection for real GDP growth over the course of calendar 2022 will be scaled back considerably and that overall and core PCE inflation estimates for this year will be marked higher.
NAHB/Wells Fargo Housing Market Index: The backup in mortgage interest rates over the past four weeks probably weakened prospective buyer traffic and dampened home-builders’ appraisals of current and future sales during the first half of September, leaving the Housing Market Index below the critical 50-point mark for a second straight month.
Housing Starts & Building Permits: Reported increases in building materials sales and construction hours worked suggest that the number of new housing units started and building permits issued rose in August from their respective seasonally adjusted annual rates of 1.45mn and 1.69mn posted in July.
Existing Home Sales: The accelerated dip in purchase contract signings over the June-July span suggests a decline of 3.3% to a SAAR of 4.65mn in August – the lowest tally since the pandemic-worst of 4.07mn posted in May 2020. With the number of homes on the market expected to decline ~2.3% to 1.26mn during the period, the stock of available homes likely will sit at 3.3 months’ supply.
Current Account Deficit: The narrowing of the merchandise trade gap over the April-June span likely pared the current account deficit to $260bn in Q2 from the record $291.4bn shortfall posted over the first three months of the year.
Jobless Claims: Initial claims for unemployment insurance benefits likely remained in a historically low 210-240K range during the period ended September 16th. Continuing claims are expected to dip below the 1.4mn mark during the week ended September 9th, supporting the view that recently laid-off employees are having little trouble finding work.
Index of Leading Economic Indicators: The Conference Board’s auger of prospective economic activity probably held steady in August, stemming a run of five consecutive monthly declines. Despite that series of disappointing results, the estimated probability that the economy is in recession remains negligible.
Federal Reserve Appearances:
- Sept. 21 Federal Open Market Committee policy statement.
- Sept. 21 Federal Reserve Chair Jerome Powell to hold post-FOMC-meeting Press conference.
- Sept. 23 Federal Reserve Chair Powell to make opening remarks at a Fed Listens event focusing on the pandemic’s effects.
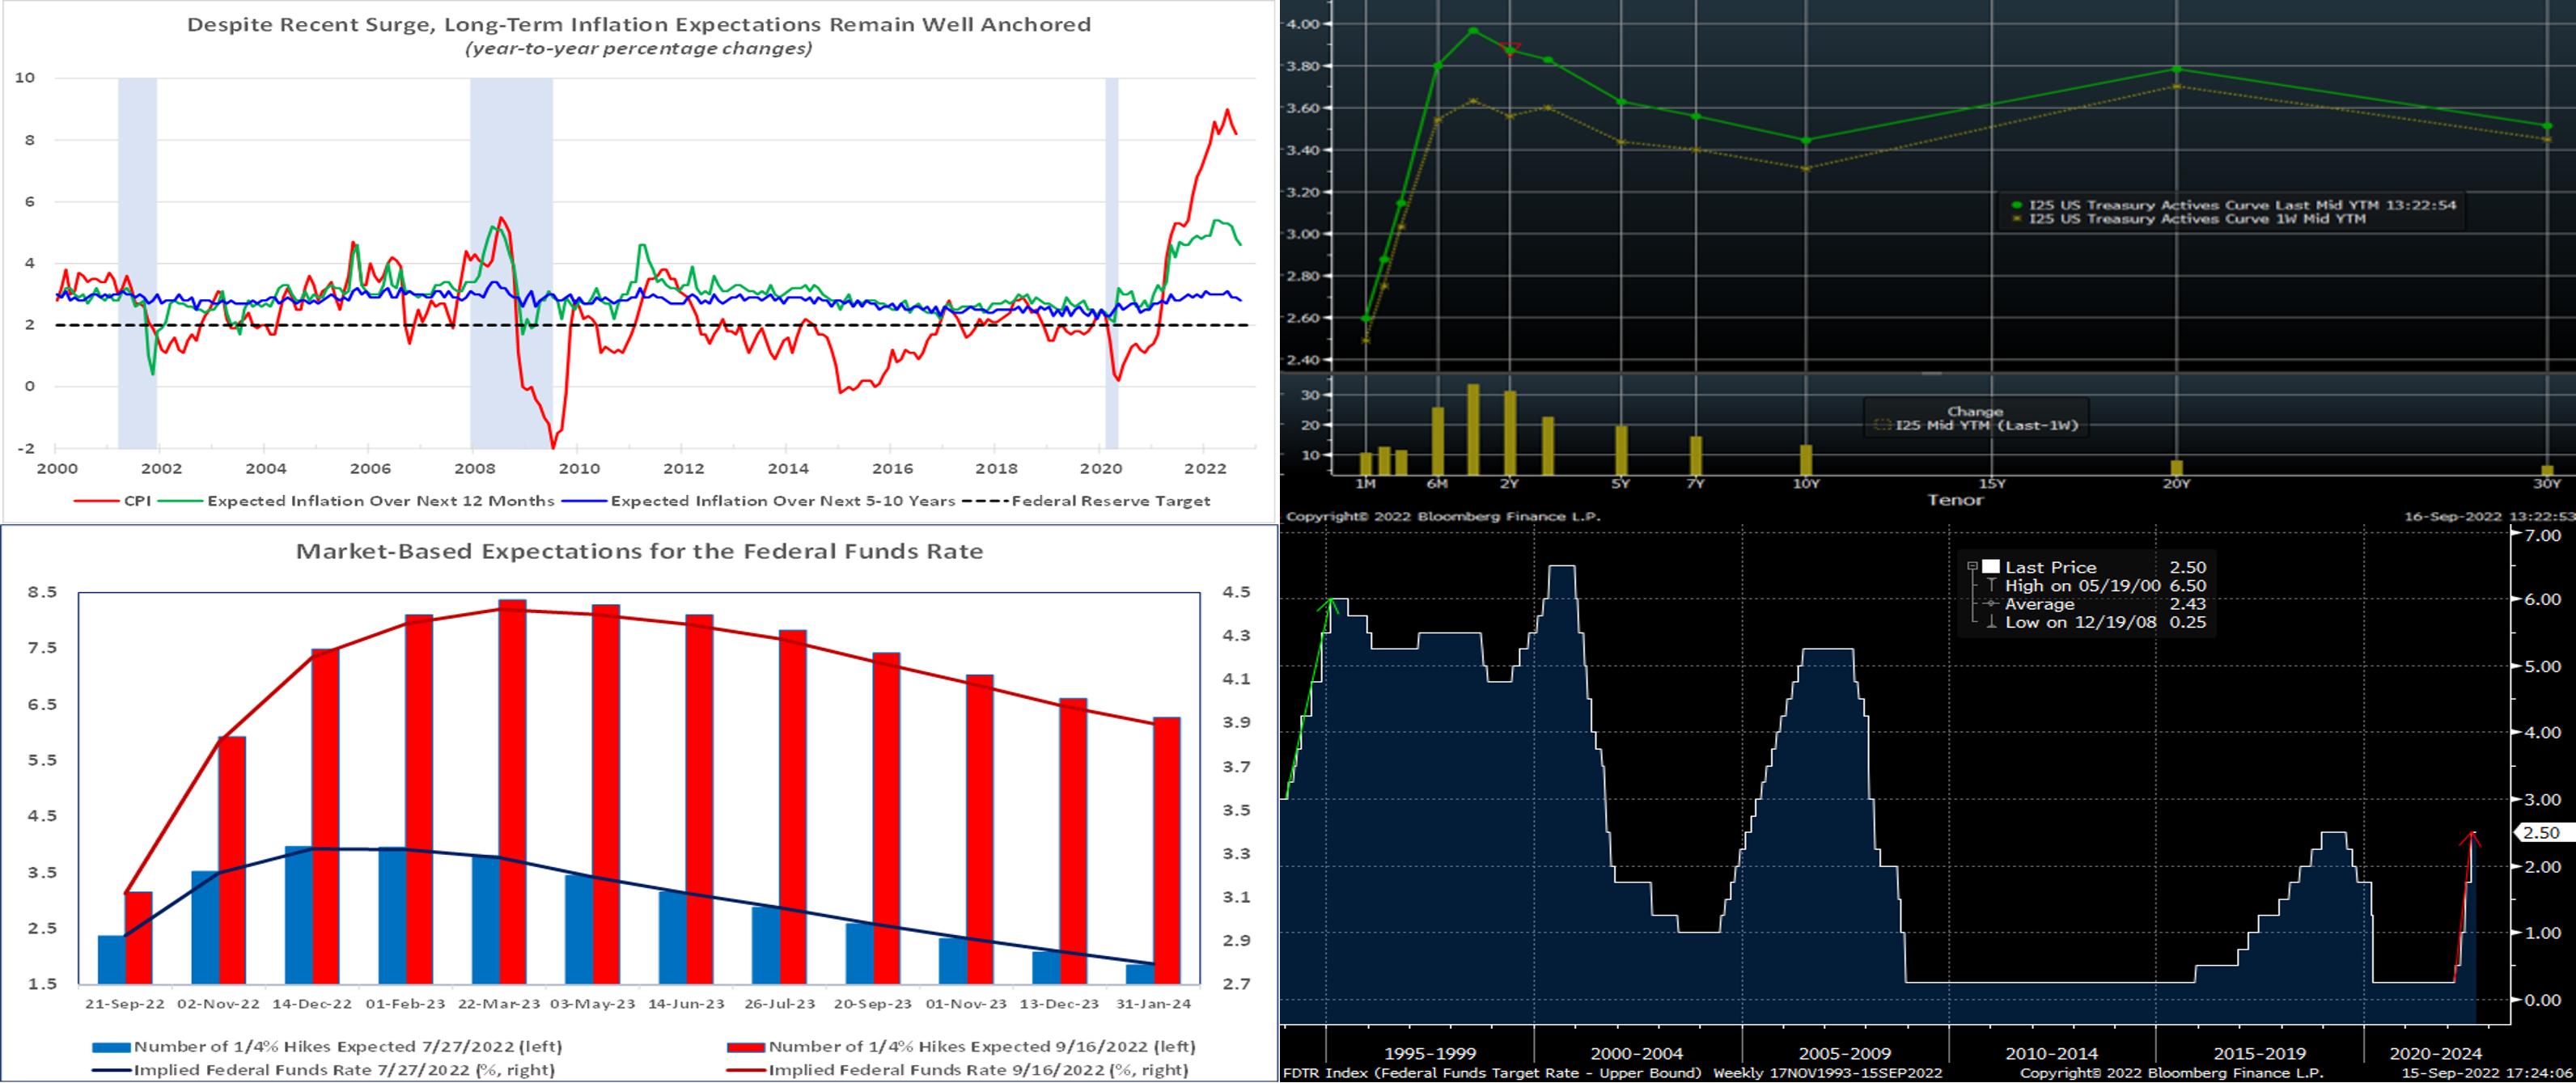
Source: BLS, FRB, NBER, Univ. of Michigan; FHLBNY. Note: Shaded areas denote recession. Federal Reserve officials have emphasized that one of the primary goals of aggressively tightening monetary policy is to ensure that inflation expectations remain well anchored. Responding to the recent surge in retail goods and services costs, year-ahead expectations have risen markedly since the middle of 2021 but have receded by almost a full percentage point since April. Perhaps even more important, the average inflation rate expected by consumers to prevail over the next five to ten years has remained in a very tight band of 2.8% to 3.1% over the past 12 months.
CHART 2 UPPER RIGHT
Source: Bloomberg. Note: Top pane is yield (%), bottom pane is change (bps). The UST curve, as of midday Friday, shot higher and flatter from the week prior; many points now trade at the highest levels in years, and some curve slopes are at or near the flattest levels in decades. For instance, the 2-year/10-year slope, except for a few days early last month, was last this flat in 2000. The past week’s move was led by a rise of ~34 bps in 1-year and ~31 bps in 2-year. Fed-speak was absent, owing to the pre-FOMC blackout, but the higher-than-forecast CPI data spoke loudly and drove the rise in rates. Also adding impetus to higher term yields the past week were a slate of UST auctions and the continuation of a typical early-September surge in corporate bond issuance.
CHART 3 LOWER LEFT
Source: Bloomberg; FHLBNY. Since Fed policy expectation is the primary driving force of the curve at present, we revisit/update this chart of the market’s pricing of the path of the Fed Funds Effective rate. The dynamics cited above led the market to again price larger forthcoming hikes and to pare back pricing of a prospective Fed easing cycle in late-2023. As seen clearly seen in this view of current market pricing vs. that from the July 27th FOMC meeting, the market has notably adjusted expectations upwards in recent weeks. As of this past Friday midday and up significantly from last week, the market priced for a 100% chance of a 75 bps hike for this upcoming week’s FOMC, with ~16% chance of a 100 bps hike. For 2022 cumulatively from now, the market prices ~186 bps of hikes. While the market has pared back the extent and probability of Fed easing in 2023, it nonetheless still prices for it in the latter part of the year; this section of the curve could be the most vulnerable to moves in either direction in response to fresh economic data.
CHART 4 LOWER RIGHT
Source: Bloomberg. For the upcoming FOMC, the market prices for a less than 20% chance of a “shock and awe” hike of 100 bps. But even a 75 bps hike, in historic context over the past few decades, might qualify as one. As seen here (see the steep red vs. green arrow annotations), the Fed has not hiked in such large increments since 1994. A 100 bps hike this week from the Fed might appear overreactive to the CPI data point (a lagging indicator), especially when consumer expectations of future inflation have remained contained, and so it appears more likely that the Fed will try to display steady confidence in its policy path and contain the hike at 75 bps. Another takeaway from this chart is that the path “back down” in rates is notably steep. Granted, some of the downward spikes were in response to crises (Great Financial Crisis and aftermath, pandemic). But it illuminates the reason why the market now prices a possibility of easing, in response to a Fed-induced recessionary threat, in the latter part of 2023.
FHLBNY Advance Rates Observations
Front-End Rates
- Short-end Advance rates, excepting Overnight, finished notably higher week-over-week. Maturities now cross further into expected upcoming Fed hikes, and the market has boosted the odds of more aggressive near-term hikes. Volatility in short-end markets has perked up again, with a greater chance of dynamic moves day-to-day and intraday, a situation likely to persist while the Fed embraces a hawkish and data-dependent posture regarding rate hikes. As of this past Friday midday and up considerably from the week prior, the market priced for a 100% chance of a 75 bps hike at the forthcoming FOMC, with ~16% chance of 100 bps hike. For 2022 cumulatively from now and notably higher as well from the week prior, the market prices for ~186 bps of hikes.
- Given the Fed’s tightening and data-dependent posture, rates will remain highly responsive to economic data and especially the upcoming FOMC result.
Term Rates
- The longer-term curve finished higher and flatter from the week prior, generally mirroring the move in UST and swaps markets. Whereas 1 and 2-year were ~42 and 32 bps higher, respectively, 5-year was ~19 bps and 10-year ~13 bps higher. Kindly refer to the previous section for relevant market color.
- The advance curve is extremely flat overall and inverted at various points, thereby offering opportunities to extend in advance duration for minimal or lower coupon cost.
On the UST term supply front, this upcoming week serves a 20-year nominal and a 10-year TIPS auction. Market focus will be keenly trained on the FOMC meeting. Please call the Member Service Desk for information on market dynamics, rate levels, or products.
Product Alert: FHLBNY is pleased to announce enhancements to our Advance Rebate Program, which provides members an opportunity to receive a cash rebate when prepaying an eligible advance and rebooking a new advance within a 30-day period. Rebate-eligible advances now must have a minimum of 6-months (reduced from 1-year) remaining. Moreover, the potential cash rebate has been increased. This program can be suitable for those wishing to extend their liability duration and/or potentially improve net interest margin.
Forward Start Advance (FSA): For members with upcoming borrowing or refunding plans, consider the FSA as a method to opportunistically “lock in” rates before advance settlement date. Please call the Member Service Desk at (212) 441-6600 for more information.
The Symmetrical Prepayment Advance Feature
With rates at or near multi-year lows, it is a compelling juncture to use the SPA feature on term advances. This feature allows member to capture, at prepayment, changes in the Fair Value of the advance which are favorable to the member. Contact us to discuss.
Looking for more information on the above topics? We’d love to speak with you!
Questions?
If you wish to receive the MSD Weekly Market Update in .pdf format (includes FHLBNY rate charts) or to discuss this content further, please email the MSD Team.