Member Services Desk
Weekly Market Update
This MSD Weekly Market Update reflects information for the week of May 30, 2022.
Economist Views
Click to expand the below image.
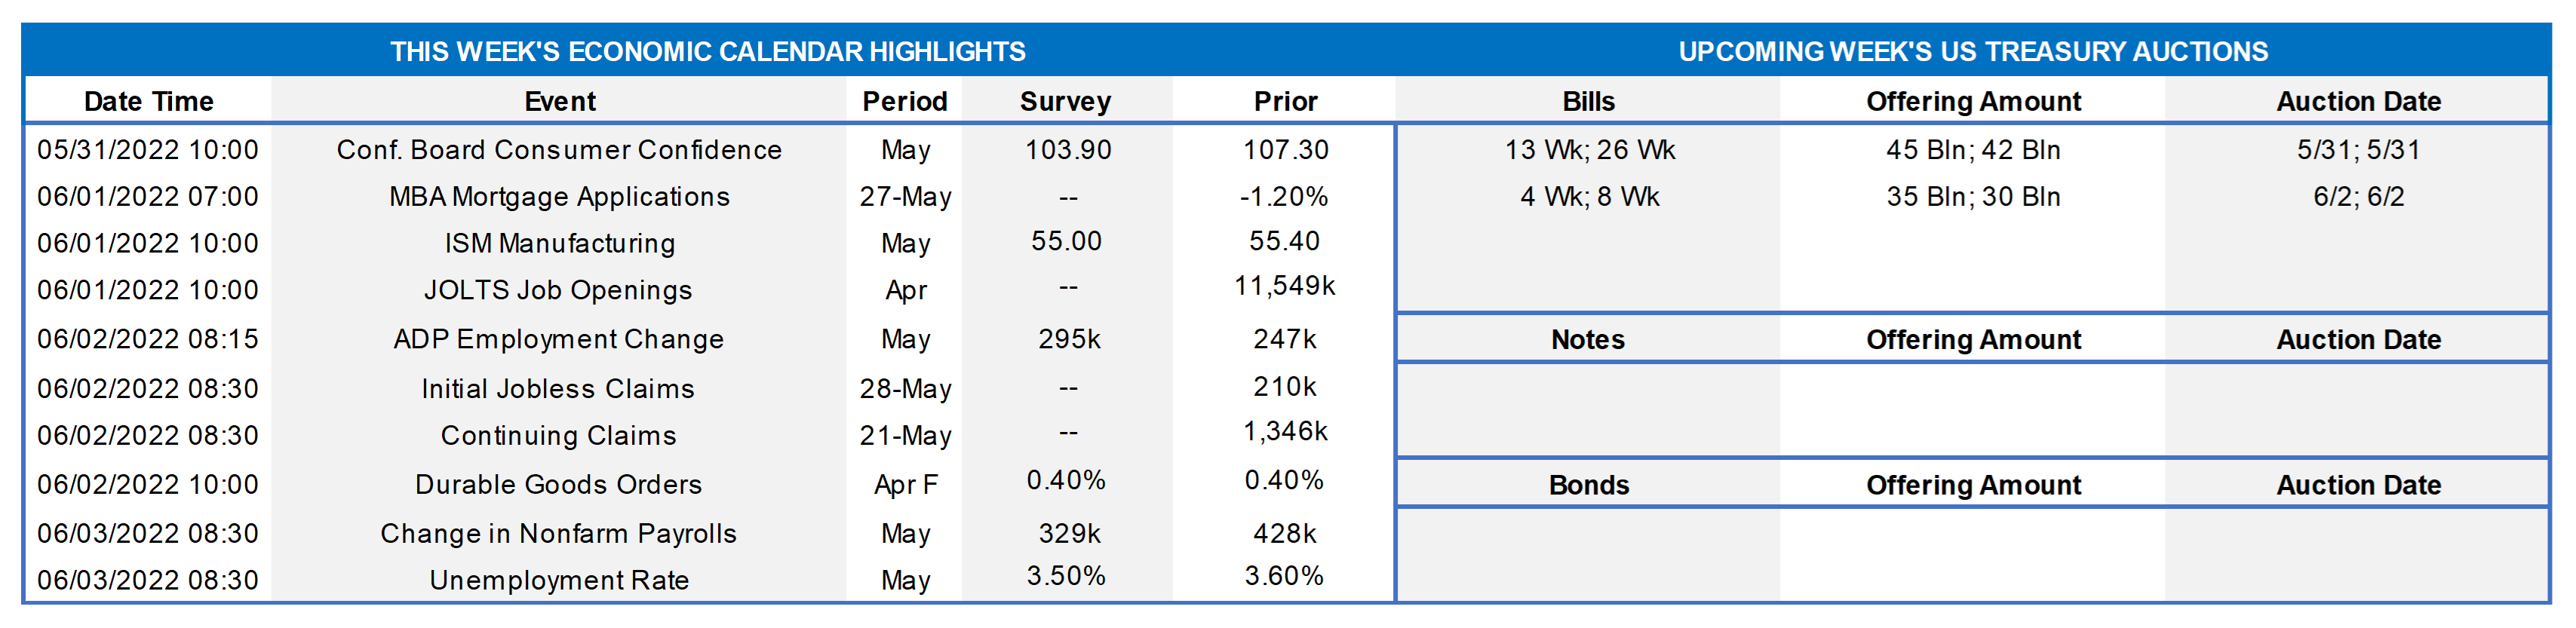
Market participants will contend with a crowded data calendar next week. Upcoming reports are expected to be decidedly mixed. Labor-market soundings likely will be solid, with job openings soaring to a record high and the unemployment rate dipping to a level not seen in half a century. Reflecting challenging supply conditions, home prices probably remained on a tear at the end of Q2. Concerns about rising prices and interest rates are expected to weigh on consumer confidence. Available canvasses suggest that the Institute for Supply Management (ISM) closely followed manufacturing and service-producing activity gauges moved lower in May. The Federal Reserve’s Beige Book will provide useful color on business activity within the FHLB-NY coverage area.
S&P CoreLogic Case-Shiller (SPCLCS) 20-City Home Price Index: Home prices probably climbed at a marginally slower pace across the twenty major metropolitan areas canvassed by SPCLCS in March. The 2% rise anticipated by the Street, after a 2.4% jump in February, would place home selling prices a hefty 20.5% above those recorded 12 months earlier.
Conference Board Consumer Confidence: Surging inflation and rising rates likely weighed on consumers’ appraisals of current and prospective economic conditions, leaving this sentiment gauge at a 15-month low of 101 in May.
Construction Spending: The nominal value of new construction put-in-place probably climbed by .7% in April, boosting the cumulative increase over the latest 12 months to 10.9%.
ISM Manufacturing Index: The nationwide manufacturing expansion likely marked its second anniversary in May, although the pace of activity likely slowed markedly from April’s reported clip. District Federal Reserve Bank canvasses and other surveys suggest that the Purchasing Managers Index retreated to 52.3% from 55.4% in the previous month.
JOLTS Job Openings: A sharp pickup in online help-wanted postings suggests that total job openings soared to a record 11.8mn in April. Given the dip in civilian unemployment last month, that result would leave the gap between available positions and the jobless at an all-time wide of 5.9mn. Put another way, there was an estimated two jobs per unemployed person in April.
Motor Vehicle Sales: Combined purchases of autos are expected to have fallen by 6.9% to a seasonally adjusted annual rate of 13.3mn in May, completely erasing April’s reported gain.
ADP National Employment Report: Street economists expect ADP Employer Services to report that approximately 300K net new jobs were added in the private sector in May, following a 247K increase in April. Given the substantial undershoot from the 406K net positions added in the Bureau of Labor Statistics’ April report, the prospective prior-month revision could be sizable.
Employment Situation Report: Labor-market conditions probably tightened further in May. Fueled by stepped-up hiring at service-producing firms, nonfarm payrolls likely expanded by 375K, after the 428K increase recorded in April. A sharp reduction in the state insured unemployment rate between canvassing periods suggests that the percentage of the civilian labor force without a job shed two ticks to a 53-year low of 3.4%. A comparatively early establishment canvassing period may result in a smaller wage gain than the median .4% Street forecast.
ISM Services Index: Echoing the anticipated deceleration in manufacturing activity, this service-producing gauge probably slipped to a two-year low of 54% in May from 57.1% in the preceding month.
Federal Reserve Appearances:
- Jun 1 St. Louis Fed President Bullard to discuss the economic and policy outlook at the Economic Club of Memphis.
- Jun 1 Federal Reserve to release Beige Book commentary on district economic conditions.
- Jun 2 Cleveland Fed President Mester to discuss the outlook at an event hosted by the Philadelphia Council for Business Economics.
Click to expand the below image.
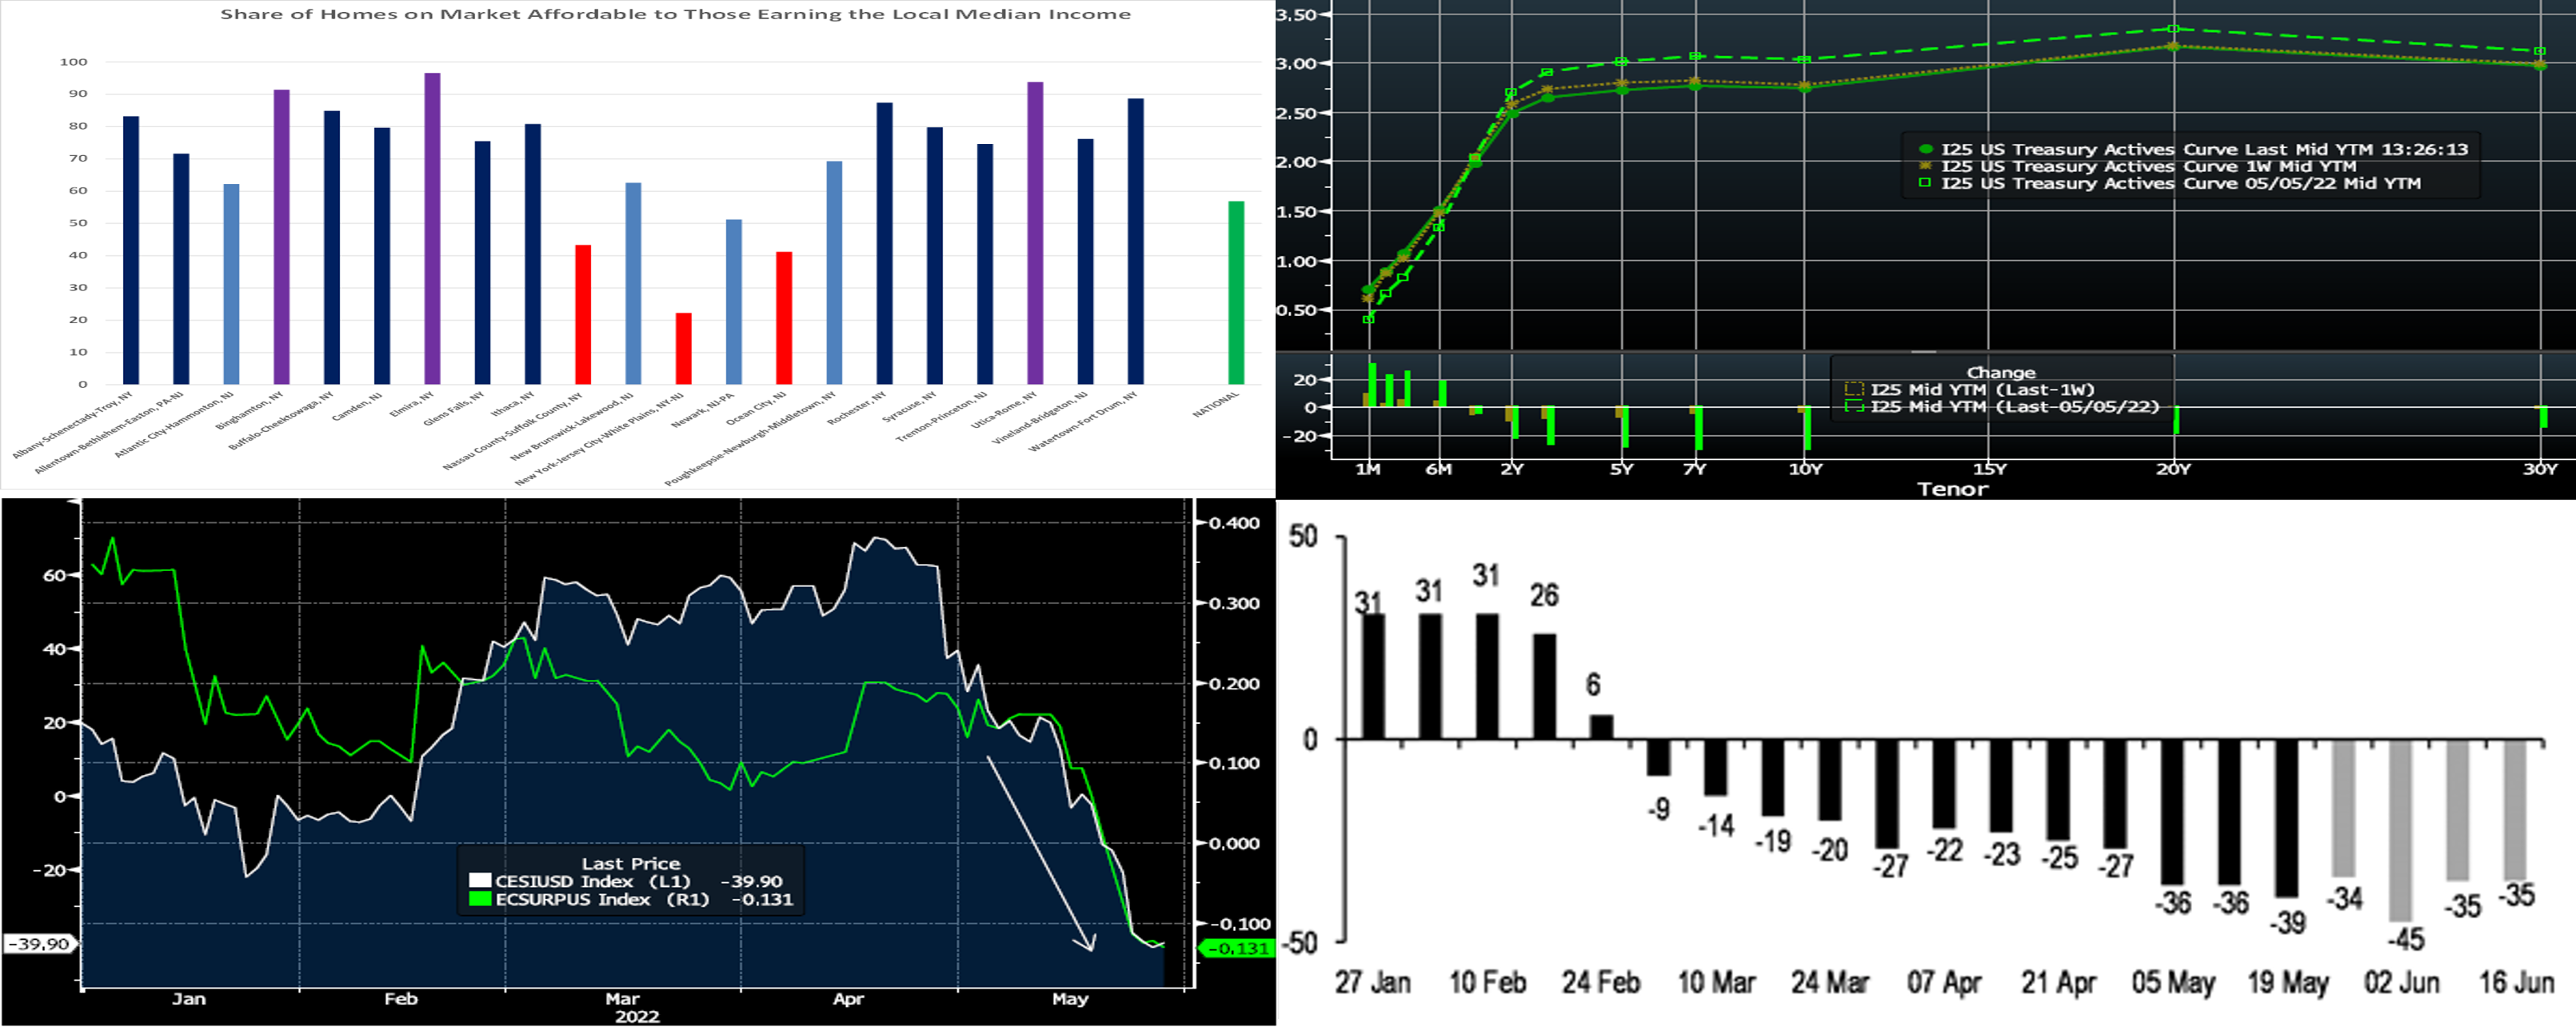
CHART 1 UPPER LEFT
Source: National Association of Homebuilders/Wells Fargo, FHLBNY. Housing opportunity remains challenging both nationally and across most of the FHLB-NY district. The NAHB/Wells Fargo Housing Opportunity Index (HOI) is defined as the share of homes sold in an area that would have been affordable to a family earning the local median income, based on standard mortgage underwriting criteria. Therefore, there are two major components — income and housing cost. Just 56.9% of homes sold countrywide over the Q1 timeframe were affordable to families earning the median income of $90K, down from 63.1% during Q1 2021. And market indicators moving forward point to further worsening of affordability. Available data indicate that housing opportunities have varied widely across our district. While segments of upstate NY boast HOIs near 85%, the median dwelling sold in the NYC metro area was accessible to less than a quarter of those earning the median local income. HOIs for selected portions of NJ ranged from a high of 76.2% for the Vineland-Bridgeton area to a low of just 41.2% for Ocean City. Given these affordability challenges, we encourage our members to utilize our community lending and housing programs.
CHART 2 UPPER RIGHT
Source: Bloomberg. Note: Top pane is yield (%), bottom pane is change (bps). While short-rates ticked a bit higher, intermediate and long-term yields were lower week-over-week, with 2 and 3-year yields leading the mild “bull steepening” move. After the runup in yields of recent months, the market experienced continued short-covering from trading-oriented investor types. Also, longer yields declined partly owing to the market’s building view that the tightening of financial conditions may now serve to quell the pace of inflationary forces and spur an economic slowdown. Indeed, the market’s pricing of Fed hikes past the next few meetings has receded in recent weeks. Moreover, Atlanta Fed President Bostic mentioned this past week that a pause may be sensible post the two widely expected near-term 50 bps hikes. As seen in the chart, intermediate and longer yields have retraced lower by ~20-25 bps since the May 4 FOMC meeting. The market remains volatile, albeit notably less so than a month ago, and so we continue to encourage members to engage with the desk for information and color.
CHART 3 LOWER LEFT
Source: Bloomberg. A contributor to the recent tempering of Fed hike expectations beyond this year, and the consequent decline in yields of recent weeks, has been economic data underperforming expectations. In other words, recent data releases have been weaker than market consensus forecasts, as is evident here in the notable downward move in both the Citibank Economic Surprise Index and the Bloomberg Economic Surprise Index. Note that economic data can influence markets and our advance rates. This past Tuesday morning, for instance, a release of weaker-than-expected data prompted a quick decline of ~10 bps in term yields that, in turn, moved advance rates to notably lower levels than were published on that morning’s Daily Rate Sheet. We highly encourage members to engage with the desk and to monitor such potential opportunities.
CHART 4 LOWER RIGHT
Source: JP Morgan, US Treasury. Depicted here is the trend, both historical and JP Morgan projections, of weekly net issuance ($bn) of T-bills. Clearly, net issuance has been declining for months, with less issuance vs. what has matured. A primary reason for lower issuance has been strong tax receipts at Treasury and a smaller budget deficit. This trend has helped sustain the ongoing dynamic of strong demand but limited supply in the short-end and money markets sector. T-bills trade extremely rich to other instruments (OIS, RRP, SOFR). In turn, these dynamics can impact our advance rates. For instance, our short-term (3 to 9-mo) SOFR ARC advance levels have been at historically low/attractive levels. Please call the desk for more information.
FHLBNY Advance Rates Observations
Front-End Rates
- Short-end Advance rates finished higher by 2 to 7 bps week-over-week, with 1-month and further leading the move. Short-end market flows have been volatile in recent weeks, thereby leading to dynamic intraday and day-to-day moves in rates. Meanwhile, the market’s pricing of near-term Fed rate hikes continues to trend advance rates higher. As of this past Friday midday, the market priced for just shy of a cumulative 100 bps of hikes for the next two FOMC meetings on June 15th and July 27th. This pricing, and the fact that maturities are crossing further into the timeline of the Fed hiking cycle, contributed to the moves.
- Given the Fed tightening posture and upcoming FOMC meetings, rates will remain highly responsive to the market’s moves and pricing of the Fed.
Term Rates
- Longer-term rates finished lower and steeper, week-over-week, mirroring and slightly outpacing moves in the UST market. While 2-year was ~13 bps lower, 5 and 10-year were ~9 and 7bps lower on the week. Kindly refer to the previous section for further color on relevant market dynamics.
- On the UST term supply front, this upcoming week brings a reprieve in auctions. Given dynamic markets, members should monitor conditions for potentially more optimal timing on transactions. Please call the Member Service Desk for information on market dynamics, rate levels, or products.
Product Alert: FHLBNY is pleased to announce enhancements to our Advance Rebate Program, which provides members an opportunity to receive a cash rebate when prepaying an eligible advance and rebooking a new advance within a 30-day period. Rebate-eligible advances now must have a minimum of 6-months (reduced from 1-year) remaining. Moreover, the potential cash rebate has been increased. This program can be suitable for those wishing to extend their liability duration and/or potentially improve net interest margin. Please call the Member Service Desk at (212) 441-6600 for more information.
Forward Start Advance (FSA): For members with upcoming borrowing or refunding plans, consider the FSA as a method to opportunistically “lock in” rates before advance settlement date. Please call the Member Service Desk at (212) 441-6600 for more information.
The Symmetrical Prepayment Advance Feature
With rates at or near multi-year lows, it is a compelling juncture to use the SPA feature on term advances. This feature allows member to capture, at prepayment, changes in the Fair Value of the advance which are favorable to the member. Contact us to discuss.
Looking for more information on the above topics? We’d love to speak with you!
Questions?
If you wish to receive the MSD Weekly Market Update in .pdf format (includes FHLBNY rate charts) or to discuss this content further, please email the MSD Team.