Member Services Desk
Weekly Market Update
Economist Views
Click to expand the below image.
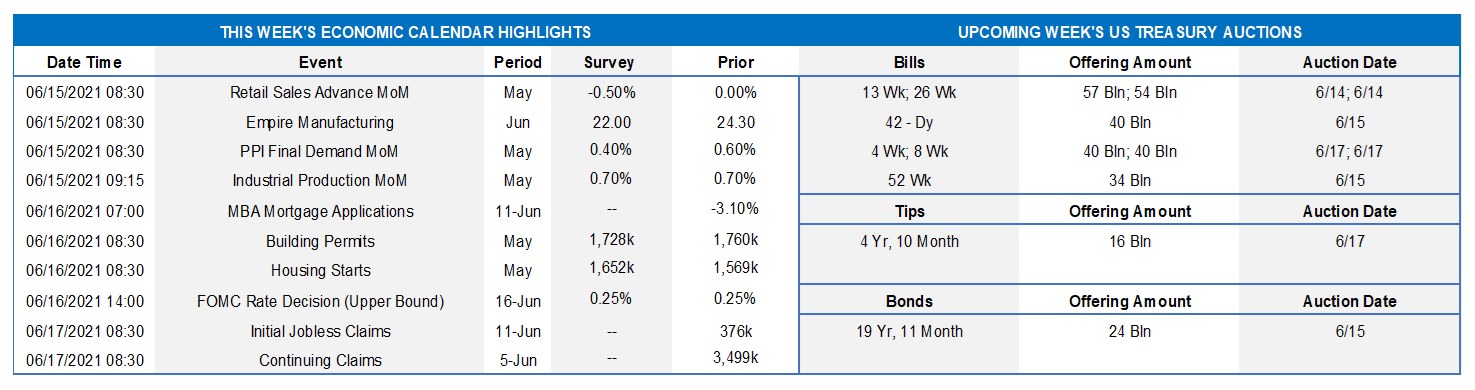
The Federal Open Market Committee (FOMC) meeting will headline a very hectic week. Acknowledging recent positive developments on the economic and healthcare fronts, the FOMC is expected to reiterate that it expects to maintain an accommodative stance on monetary policy, with a federal funds rate target range of 0 to .25%, until it achieves maximum employment and inflation at a rate of 2% over the longer run. The communiqué issued following the upcoming gathering of policymakers probably will likely repeat that the Fed will continue to increase its holdings of Treasury securities by at least $80bn per month and of agency mortgage-backed securities by at least $40bn per month until substantial further progress has been made toward the Committee’s goals. On the economic data front, reports on retail sales, industrial production, and new residential construction will allow economists to update their Q2 real GDP tracking estimates.
Retail & Food Services Sales: The Census Bureau’s update on retail activity in May will provide valuable information on consumer spending growth during the current quarter. Pared by a reported pullback in motor vehicle purchases, retail and food services sales likely dipped by .4%, after no change in April. As always, market participants will pay particular attention to so-called control sales excluding auto, building materials and gasoline purchases. Barring any prior-month revisions, the .6% increase anticipated by the Street would place core purchases over the April-May span a respectable 9.9% annualized above their Q-1 average.
Empire State Manufacturing Survey: The expansion in NYS probably reached the one-year mark in June, although the pace of growth likely slowed from that of May. The general business conditions diffusion index – the gap between the percentage of firms experiencing an improvement in activity less those witnessing a decline – probably retreated to 22% from 24.3% in the previous month.
Industrial Production & Capacity Utilization: Output of the nation’s factories, mines, and utilities is expected to have risen by .6% in May, marginally eclipsing the .5% prior-month gain. With output likely outpacing additions to productive capacity by a wide margin during the reference period, the overall operating rate probably climbed by one-half percentage point to 75.1% – the highest reading since the pandemic forced the shuttering of the economy in March 2020.
NAHB Housing Market Index: Home-builder sentiment probably remained at a historically high level in June. The National Association of Home Builders’ composite barometer of current and future sales and prospective buyer traffic likely was unchanged at 83% – well above the 50% mark associated with stable housing-market conditions.
Housing Starts & Building Permits: The number of new housing units started probably climbed by 5.2% to a seasonally adjusted annual rate of 1.65mn in May, reversing almost half of the surprising 9.5% drop suffered in April. The number of residential building permits issued – a leading indicator of prospective groundbreakings – likely edged .4% higher to 1.74mn.
Jobless Claims: Initial and continuing claims under regular state unemployment insurance programs likely moved lower during the latest period. These figures continue to overstate the healing of the labor market from the pandemic, however. Indeed, as of May 22, slightly more than 15.3mn persons were still receiving assistance, down from the pandemic peak of 32.4mn reached last June but still well above the 2.1mn before COVID-19 struck in March 2020.
Index of Leading Economic Indicators: This barometer of prospective economic activity is expected to have risen by 1.1% in May, boosting the cumulative increase since February to 4.1%.
Federal Reserve Appearances:
- June 16: Federal Open Market Committee statement.
- June 16: Federal Reserve Chair Powell post-FOMC meeting virtual press conference.
Click to expand the below images.
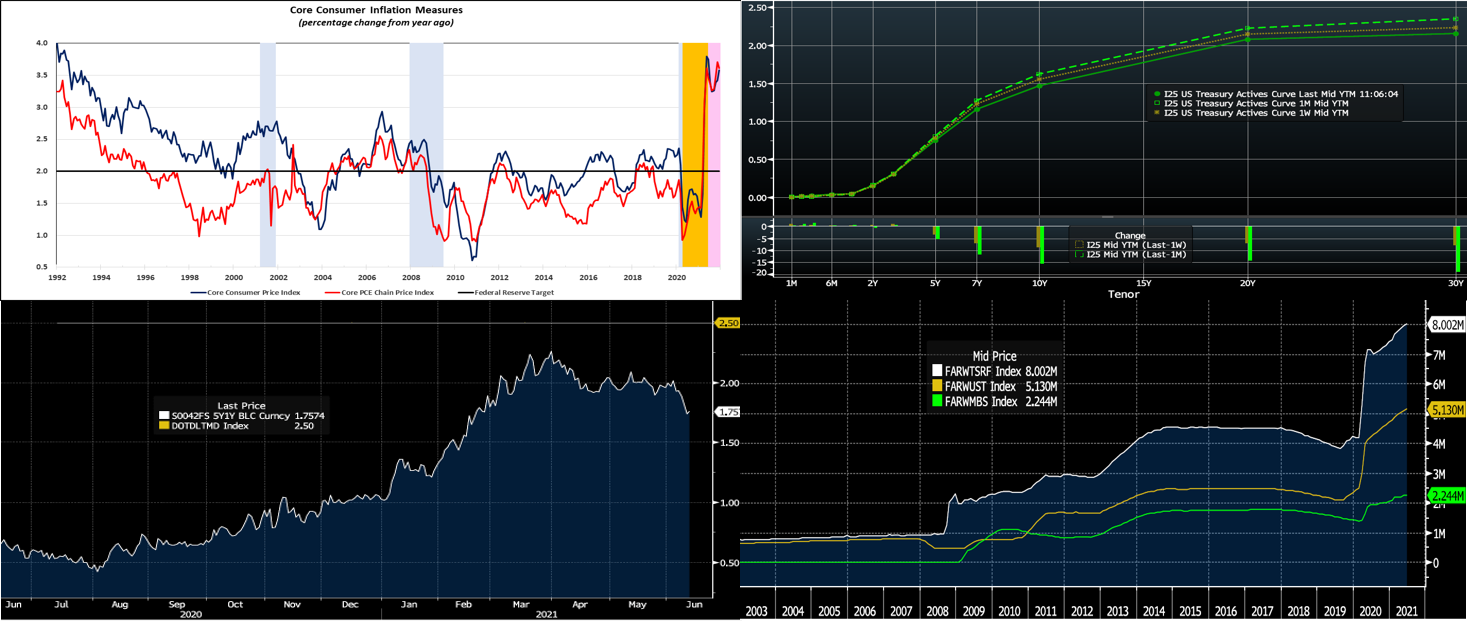
CHART 1 – UPPER LEFT
Source: BLS; BEA; FRB St. Louis; FHLBNY. Notes: Blue-shaded areas denote recession, orange-shaded area period beyond April 2020 when probability of recessionary economy dipped below 1%, pink-shaded area projections. CPI climbed by .6% in May, following a .8% jump in April. Widespread increases in core consumer goods and services costs, excluding volatile food and energy items, powered the gain. Indeed, the core CPI rose by a larger-than-expected .7%, after an outsized .9% prior-month gain. This data left the overall and core CPIs up a notable 5% and 3.8% from their respective year-ago levels. With consumer demand expected to improve further as the economy recovers, core inflation metrics likely will remain above the Fed’s 2% target for some time. Base effects were expected to propel the Y-o-Y rise in core inflation gauge above that level this spring, yet recent outsized increases may prove a challenge to policymakers’ forecasts. The Fed has indicated that it will tolerate above-target inflation for a period, in the wake of significant undershoots, and will be in no rush to remove accommodation. Yet, further unexpectedly large hikes in core consumer prices could easily alter market monetary policy expectations and pricing.
CHART 2 UPPER RIGHT
Source: Bloomberg. Note: top pane is yield (%), bottom pane is change (bps). UST yields again moved lower on the week, led by the 5-year and longer sector, while the shorter maturities remain pinned in tight ranges. Notably, the drop occurred despite a heavy slate of UST issuance and Thursday’s stronger-than-forecast inflation report. The Fed, as well as foreign and real money (such as banks and pension funds) investor buying, continues to provide a steady demand backdrop for bonds. The market behavior also prompted short-covering, especially as the 10-year slipped and held below the 1.50% level. In recent weeks, the market has essentially expressed confidence in the Fed and its outlook/strategy; indeed, “breakeven inflation rates” from TIPS have declined in these past few weeks. Yields in the 4-year and out sector now trade a few bps below the prevailing range of the prior 3 months. The market will monitor this week’s FOMC for fresh clues on the direction of rates.
CHART 3 LOWER LEFT
Source: Bloomberg. Depicted here is the 1-year, 5-year Forward Overnight Index Swap (RHS, white, %), a proxy for Fed Funds curve, vs. the Fed’s longer-run projection of the Fed Funds rate (RHS, gold, %) from its “Dot plot”. Given the latter is 2.5%, current OIS curve pricing at ~1.75% is well below that level. From this perspective, and as/if data portrays further economic recovery, the belly of the yield curve would seem vulnerable to a backup in yields. For those in need of a hedge to higher term rates, current levels are certainly more attractive than a few weeks ago; note that our Symmetrical Advance special (see details on last slide) runs through June 30th.
CHART 4 LOWER RIGHT
Source: Bloomberg. Depicted here is the Fed’s total balance sheet (RHS, white), along with two of its components, namely UST holdings (RHS, gold) and MBS (RHS, green); please note that all figures are in $trn. This week the total holdings crossed the $8trn mark. Meanwhile, in the past month, a few Fed members have begun to express that “the time to talk about tapering” of its asset purchase program is drawing nearer. The FOMC is likely to reveal something along the lines of “tapering was discussed but that it was still too early and want to be patient and see further economic progress”. Nonetheless, this aspect of the meeting warrants close attention, given that tapering will be the first step in the removal of accommodation.
FHLBNY Advance Rates Observations
Front-End Rates
- Short-end Advance rates finished flat to a bp higher week-over-week. Money Market Funds’ AUM declined by ~$6bn on the week, but ample demand persists for short paper. Meanwhile, the GSEs continue to invest larger sums into money markets, and the US TGA continues its decline. In a more recent development, state and local governments are receiving federal disbursements from the most recent relief bill and are parking funds in short-term investment “placeholders”. For any members experiencing such municipal deposit inflows, consider our Refundable Municipal Letter of Credit product; please call your Relationship Managers to discuss. From a bigger-picture vantage point, the overall moderation in the supply of short paper, relative to high cash levels in the market, is expected to keep short-end rates relatively steady and under downward pressure in the year’s first half.
- UST issuance overall is now net positive supply in that more is being issued than what the Fed is buying in its programs. However, with short UST rates at rock-bottom levels and the Fed on hold for a long period, rates are likely to persist in a near-term sideways to softer pattern. Importantly, weekly net T-bill issuance has been lower since 2020 and negative in recent months, and Treasury intends to shift issuance out the curve. Further legislative packages and related borrowing may lead to an eventual increase of T-bill auction sizes and positive net supply, but for now overall market supply/demand dynamics should keep short rates in check on the upside.
Term Rates
- On the week, medium and longer-term Advance rates were flat to lower by 9 bps, in progressive fashion led by the 4-year and longer sector, in a “bull flattener” move. Kindly refer to the previous section for further color on relevant market dynamics.
- On the UST supply front, this week holds a 5-year TIPS and a 20-year nominal auction. There has been strong investor demand for recent auctions. The market will apply close attention to this week’s FOMC meeting for any changes in guidance on rates and asset-purchases.
New Product Alert: In order to satisfy member needs and provide greater product flexibility to match bond and derivative market conventions, FHLB-NY now offers SOFR-linked advances based on SOFR-index compounding. Note that this product is in addition to SOFR-linked advances based on SOFR-index averaging which have been offered since November 2018.
The Symmetrical Prepayment Advance Feature
With rates at or near multi-year lows, it is a compelling juncture to use the SPA feature on term advances. This feature allows member to capture, at prepayment, changes in the Fair Value of the advance which are favorable to the member. Contact us to discuss.
Looking for more information on the above topics? We’d love to speak with you!
Questions?
If you wish to receive the MSD Weekly Market Update in .pdf format (includes FHLBNY rate charts) or to discuss this content further, please email the
MSD Team.
Special Member Alert
The FHLBNY recently announced a newly expanded and flexible Disaster Relief Funding (DRF) advance program which offers discounted rate advances with maturities 1-mo and greater. Additionally, we have announced that PPP loans will be accepted as eligible collateral. Please contact us with any questions.