Member Services Desk
Weekly Market Update
This MSD Weekly Market Update reflects information for the week of January 10, 2022.
Economist Views
Click to expand the below image.
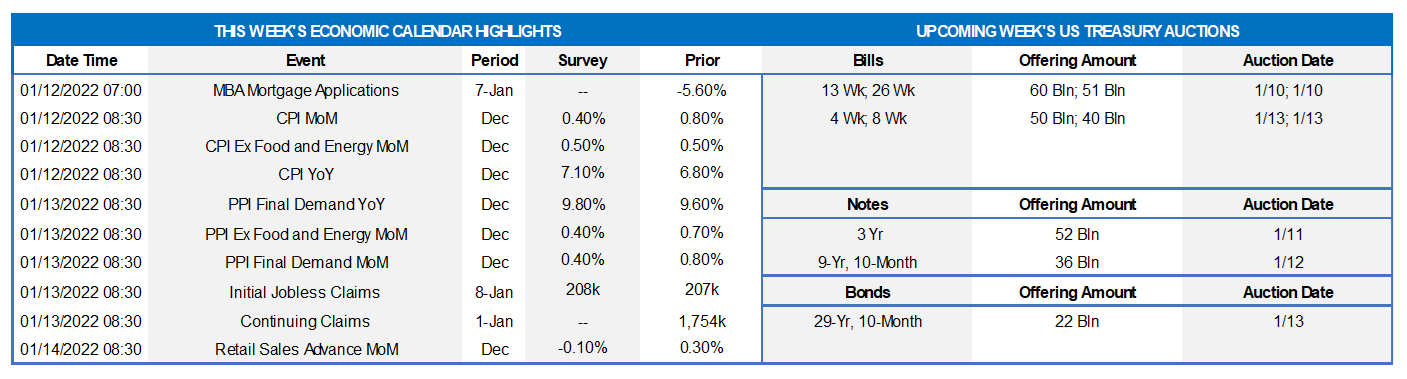
NFIB Small Business Optimism Index: To be released on the 11th, this index probably rose in December from the 98.4 reading recorded in the preceding month.
Consumer Price Index: Capped by anticipated reductions in retail energy costs, the Consumer Price Index (CPI) likely climbed by .4% in December, after a .8% jump in November. Buoyed by further hikes in airline fares and motor vehicle costs, the core CPI excluding volatile food and energy prices probably continued apace during the reference period, rising by .5%. Those forecasts, if realized, would place the overall and core CPIs 7.1% and 5.4% above their respective year-ago levels, both well above the Federal Reserve’s desired 2% target.
Jobless Claims: Highlighting tight labor-market conditions, initial and continuing claims under regular state unemployment insurance programs likely moved lower.
Retail and Food Services Sales: Retail and food services sales are expected to have stalled in December, ending a string of four consecutive monthly gains. Net of an anticipated dip in auto-dealership revenues during the reference period, retail sales likely moved .2% higher, after a .3% increase in November. As always, market participants will be paying particular attention to so-called control sales excluding auto, building materials and gasoline purchases in this week’s report. Barring any prior-month revisions, the .3% gain anticipated by the Street would leave core purchases over the final three months of 2021 a healthy 12% annualized above their July-September average, after a comparatively modest 2.9% Q3 gain.
Industrial Production & Capacity Utilization: To be released on the 14th — Production at the Nation’s factories, mines and utilities probably expanded by .3% last month, following a .5% rise in November. With output likely eclipsing additions to capacity during the reference period, the overall operating rate probably climbed by .2 percentage point to 77% – the highest level since September 2019.
Michigan Consumer Sentiment Index: Consumer confidence likely improved at the beginning of the New Year, lifting this barometer, to be announced on the 14th, to a three-month high of 71.
Federal Reserve Appearances:
- Jan. 11 Cleveland Fed President Mester to be interviewed on Bloomberg Television.
- Jan. 11 Kansas City Fed President George to discuss her outlook for the economy and monetary policy.
- Jan. 11 Senate Banking Committee to hold hearing into renomination of Fed Chair Powell.
- Jan. 11 St. Louis Fed Pres. Bullard to discuss the economy and monetary policy with Mid-Sized Bank Coalition of America.
- Jan. 12 Federal Reserve to release Beige Book summary of district economic conditions.
- Jan. 13 Senate Banking Committee to hold hearing into nomination of Fed Governor Brainard appointment as vice chair.
- Jan. 13 Richmond Fed President Barkin to discuss the economic outlook with local chamber of commerce.
Click to expand the below image.
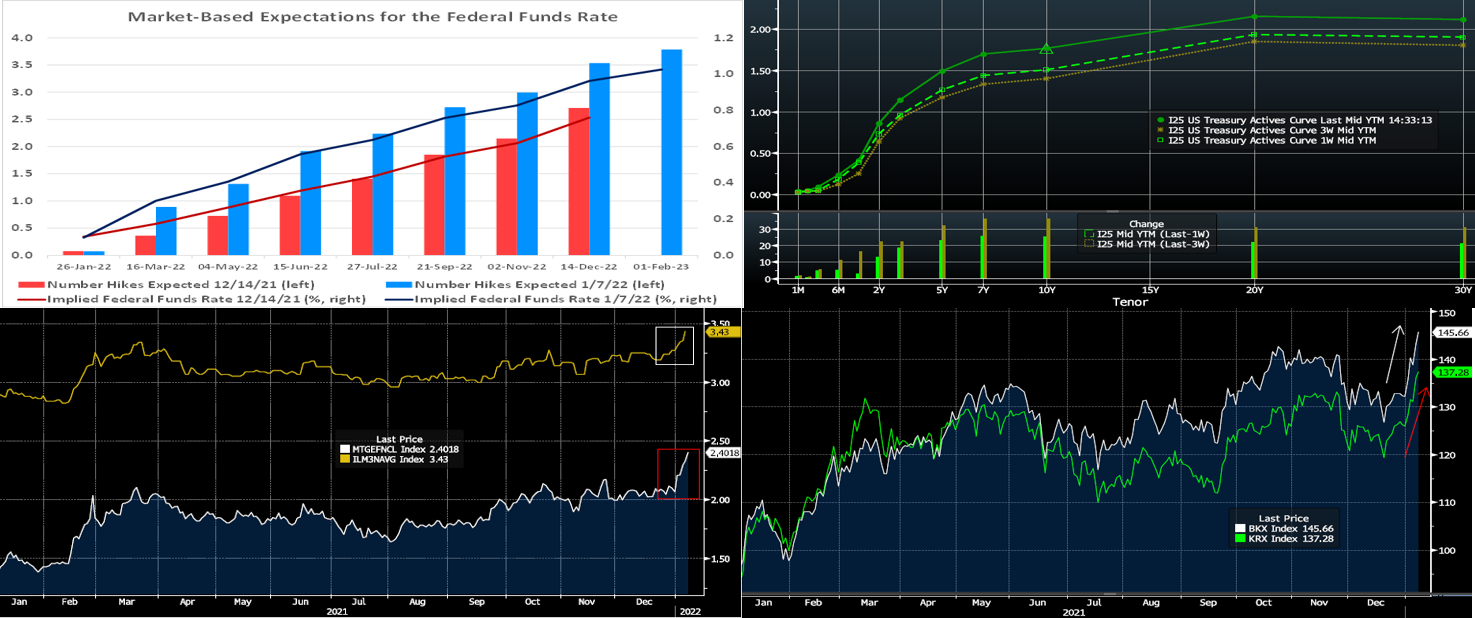
CHART 1 UPPER LEFT
Source: Bloomberg; FHLBNY. Since our last report three weeks ago, market participants have notably adjusted upwards their expectations of Fed hikes this year. Last month, the market priced for “liftoff” to occur at the June 14-15 FOMC meeting. Now the market prices with almost complete certainty of an initial hike at the March 16th meeting. Over the course of this year, three and one half 25 bps increases are projected, slightly ahead of the Fed’s “dot plot” released after the December 15 FOMC meeting; this re-pricing has been significant to begin the new year.
CHART 2 UPPER RIGHT
Source: Bloomberg. Note: Top pane is yield (%), bottom pane is change (bps). Relative to both our last edition three weeks ago and to year-end levels, UST yields are significantly higher. The 2 and 3-year points are ~22 bps higher from three weeks ago, while yields beyond that are up to an even greater degree. Various drivers have contributed to the move. The pandemic persists, but the Omicron variant has thus far proved less lethal than prior variants, thereby leading the market to perceive it as less of an economic threat. Meanwhile, various Fed members have vocalized support for both earlier rate hikes and even balance sheet runoff (not reinvesting principal payments). This past week’s release of the FOMC December Minutes reinforced a brewing hawkish mindset, as notable tidbits were that members now anticipate rate hikes earlier than previously expected and that hikes could be appropriate before maximum employment goals were met. Additionally, some members expressed support for balance sheet runoff beginning as soon as this spring. Topping off the instigators of higher yields was the past week’s surge in corporate bond supply, and next week brings a set of 3/10/30-year UST auctions.
CHART 3 LOWER LEFT
Source: Bloomberg. Depicted here is the Agency MBS 30-year Current Coupon (computed yield of a par-priced passthrough security, RHS, %, white) and the Bankrate.com 30-year mortgage rate index ( RHS, %, gold). As the latter tracks the former, both have risen sizably in the past two weeks. For banks, this trend can have mixed impacts. On the negative side, higher mortgage rates may dent mortgage refi and origination business and fees, especially given that 2021 was a record year for mortgage purchase originations. On the positive side and potentially beneficial to NII/NIM figures, higher market yields and a continued slowing trend in refinancing will lead to less prepays and premium amortization expense in bank portfolios while also providing more attractive yields to invest cash. It should be noted that higher mortgage rates, along with already high housing prices, can make homeownership more challenging. In this regard, we encourage our members to engage with FHLB-NY affordable housing programs; please see information on the last slide herein about upcoming informational events.
CHART 4 LOWER RIGHT
Source: Bloomberg. In terms of the above and any net impacts of rates on banks, the equity market is currently viewing it as decidedly net-positive. Shown here is the KBW Bank stock index (RHS, white) and the KBW Regional Bank stock index (RHS, green); both have surged ~15% in the past few weeks and well out-paced broader stock market indices such as the S&P 500. Recent evidence of improving loan growth, in tandem with an economy “fighting off” pandemic impacts, has also boosted the market’s view on the bank sector.
FHLBNY Advance Rates Observations
Front-End Rates
- Short-end Advance rates 6-month and shorter are higher and steeper from three weeks ago. With the debt ceiling now resolved, net bill issuance has turned positive, as Treasury aims to rebuild their TGA cash balances. While this trend somewhat changes the short-end’s supply/demand dynamic, there is still ample demand for short paper. Demand for the Fed’s RRP, which stands last at ~$1.53trn, remains strong. Money market funds’ AUM is ~65bn higher than three weeks ago. These dynamics can serve to limit changes in the very short maturities. However, with a high probability of a Fed hike now priced into the curve for the mid-March FOMC meeting, maturities crossing this timeframe have adjusted upwards. While rates through 1-month are only 1 bp higher from three weeks ago, the 3-month is 7 bps higher and 6-month 10 bps higher.
- T-bills are expected to experience an issuance increase, but this uptick should not alter the overall money markets paradigm of strong demand amidst limited supply, especially in the extreme front-end. To reiterate, however, as time ensues and maturities cross into or further past March, a timeframe the market prices a strong probability of rate hikes, these maturities’ rates are likely to experience more upward drift.
Term Rates
- The advance curve mimicked the UST curve over the past three weeks and is notably higher. For instance, while 2-year is ~19 bps higher, the 5 to 10-year sector finished ~32 to 35 bps higher. Kindly refer to the previous section for further color on relevant market dynamics.
- On the UST supply front, this week brings 3/10/30-year supply. Key data for the week will be the CPI release. With the Fed “in play”, close attention is warranted on the various Fed appearances this coming week.
Happy New Year – For your early-year calendars, please note that FHLBNY will conduct a webinar and virtual training sessions on our community and housing programs. The kickoff webinar on January 19th is designed to provide our member institutions and valued housing partners with pertinent updates on the FHLBNY’s community investment products (Affordable Housing Program (AHP), Homebuyer Dream Program® “HDP®”, and Community Lending Plan “CLP”), events and deadlines for 2022. Subsequently, in February, FHLB-NY will conduct a series of virtual trainings. Please visit our event’s page for pertinent details.
The Symmetrical Prepayment Advance Feature
With rates at or near multi-year lows, it is a compelling juncture to use the SPA feature on term advances. This feature allows member to capture, at prepayment, changes in the Fair Value of the advance which are favorable to the member. Contact us to discuss.
Looking for more information on the above topics? We’d love to speak with you!
Questions?
If you wish to receive the MSD Weekly Market Update in .pdf format (includes FHLBNY rate charts) or to discuss this content further, please email the MSD Team.