Member Services Desk
Weekly Market Update
This MSD Weekly Market Update reflects information for the week ending March 10, 2023.
Economist Views
Click to expand the below image.
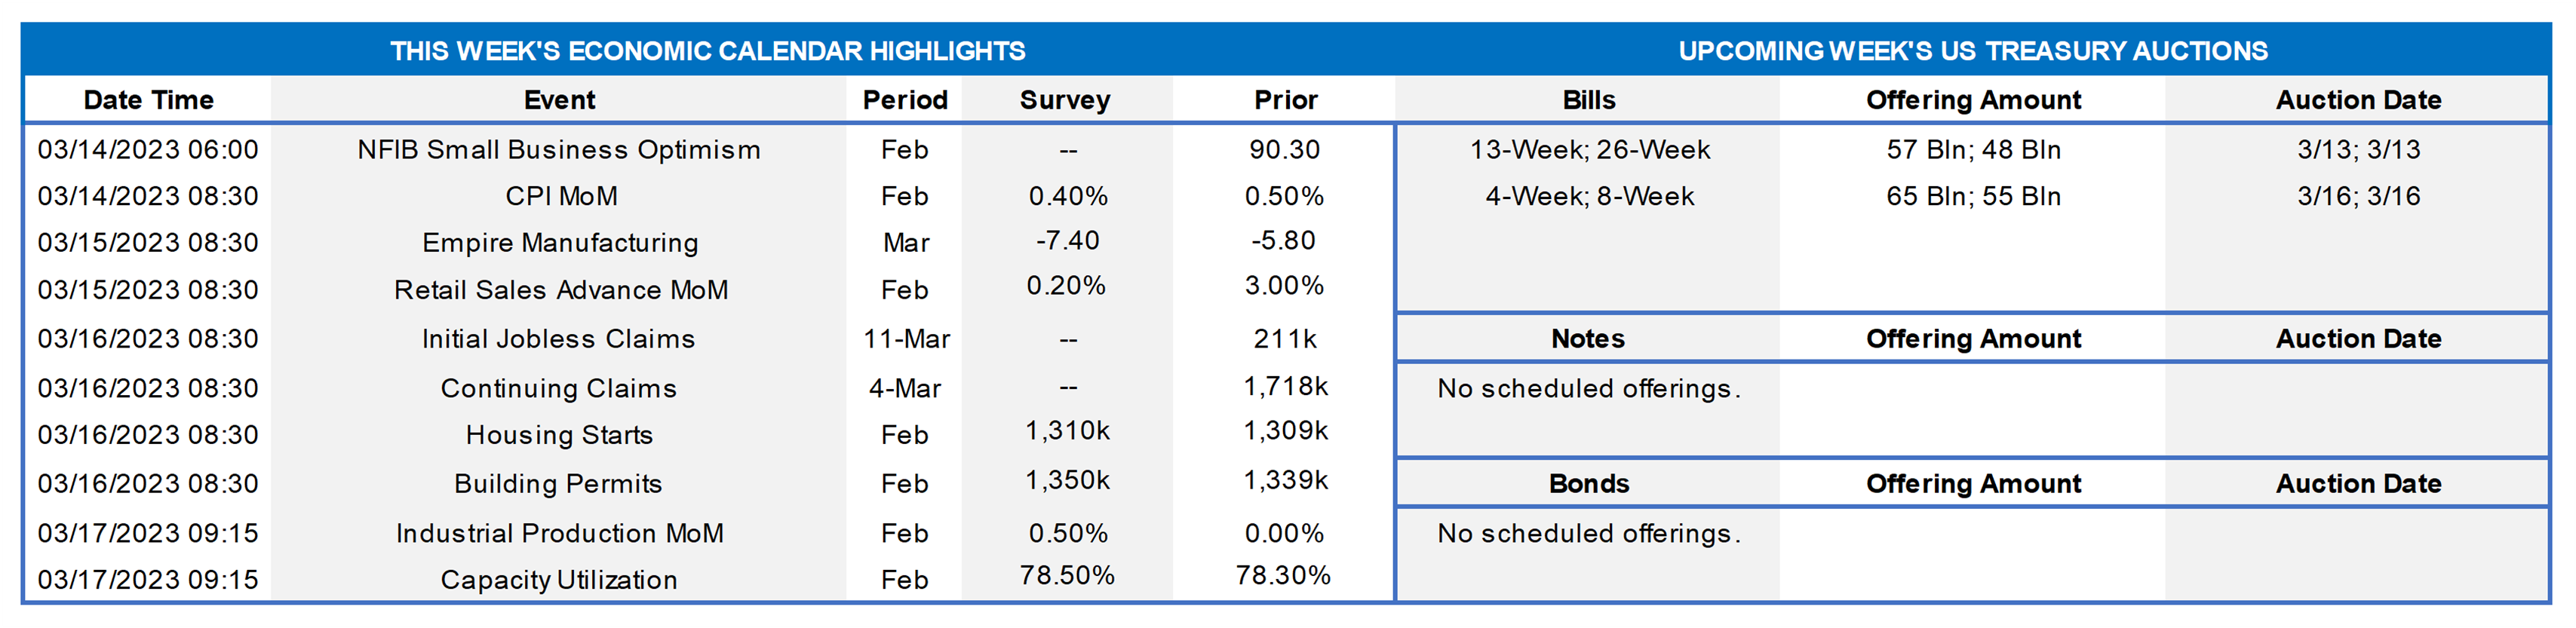
With Federal Reserve officials observing the traditional blackout period ahead of the March 21-22 FOMC meeting, market focus will be squarely on the data calendar. Given its potential to influence the upcoming FOMC decision, the BLS update on consumer prices last month will be the key release. Also on tap, February soundings on retail sales, industrial production, and home-building activity could materially alter tracking estimates for current-quarter real GDP growth. The current median Street projection calls for a sharp slowdown to just .6% annualized, following the fall’s above-trend 2.7% advance.
NFIB Small Business Optimism Index: Mimicking canvasses of large manufacturing and service-producing firms, the National Federation of Independent Business’ sentiment barometer probably was little changed in February from the 90.3 reading recorded in January.
Consumer Prices: Increases likely continued apace last month, with both the headline and core excluding food and energy gauges posting .4% gains. With larger hikes during the corresponding period of 2022 dropping out, the year-to-year growth of the CPI probably moved two ticks lower to 6%, while the 12-month advance of the core measure retreated to 5.4% from 5.6% in January.
Empire State Manufacturing Survey: Manufacturing activity in New York State probably contracted for a fourth straight month in March, with the net percentage of survey respondents witnessing a pickup in business less those experiencing a decline falling to -7.4% from -5.8% in February.
Retail & Food Services Sales: Retail and food services sales probably climbed by a comparatively modest .2% in February, following a solid 3% jump in January. This report will allow market participants to get a more accurate handle on current-quarter consumer spending.
NAHB Housing Market Index: The ongoing backup in mortgage rates likely weighed on home-builder sentiment in early March, reversing a portion of the improvement recorded in the prior month.
Jobless Claims: This week’s report will be watched closely after new filings climbed by 21K to 211K during the period ended March 3. Keep an eye on continuing claims, which have clocked in above the 1.7mn mark for the first time since mid-December, for signs that recently furloughed employees may be having a more challenging time finding work.
Housing Starts & Building Permits: Unusually warm temperatures during the reference period suggest that both new starts and the number of building permits issued will register above consensus expectations in February.
Industrial Production & Capacity Utilization: Powered by anticipated increases in manufacturing and mining output, industrial production probably climbed by .5% in February after no change in the previous month. With production expected to outpace additions to capacity during the reference period, the overall operating rate likely edged two ticks higher to 78.5%.
University of Michigan Sentiment Index: Solid labor market conditions and signs of ebbing inflation likely propelled the consumer confidence gauge to 68.4 in early March – the rosiest reading since the 70.6 posted at the end of 2021.
Federal Reserve Appearances: Federal Reserve officials to observe the traditional blackout period ahead of the March 21-22 FOMC meeting.
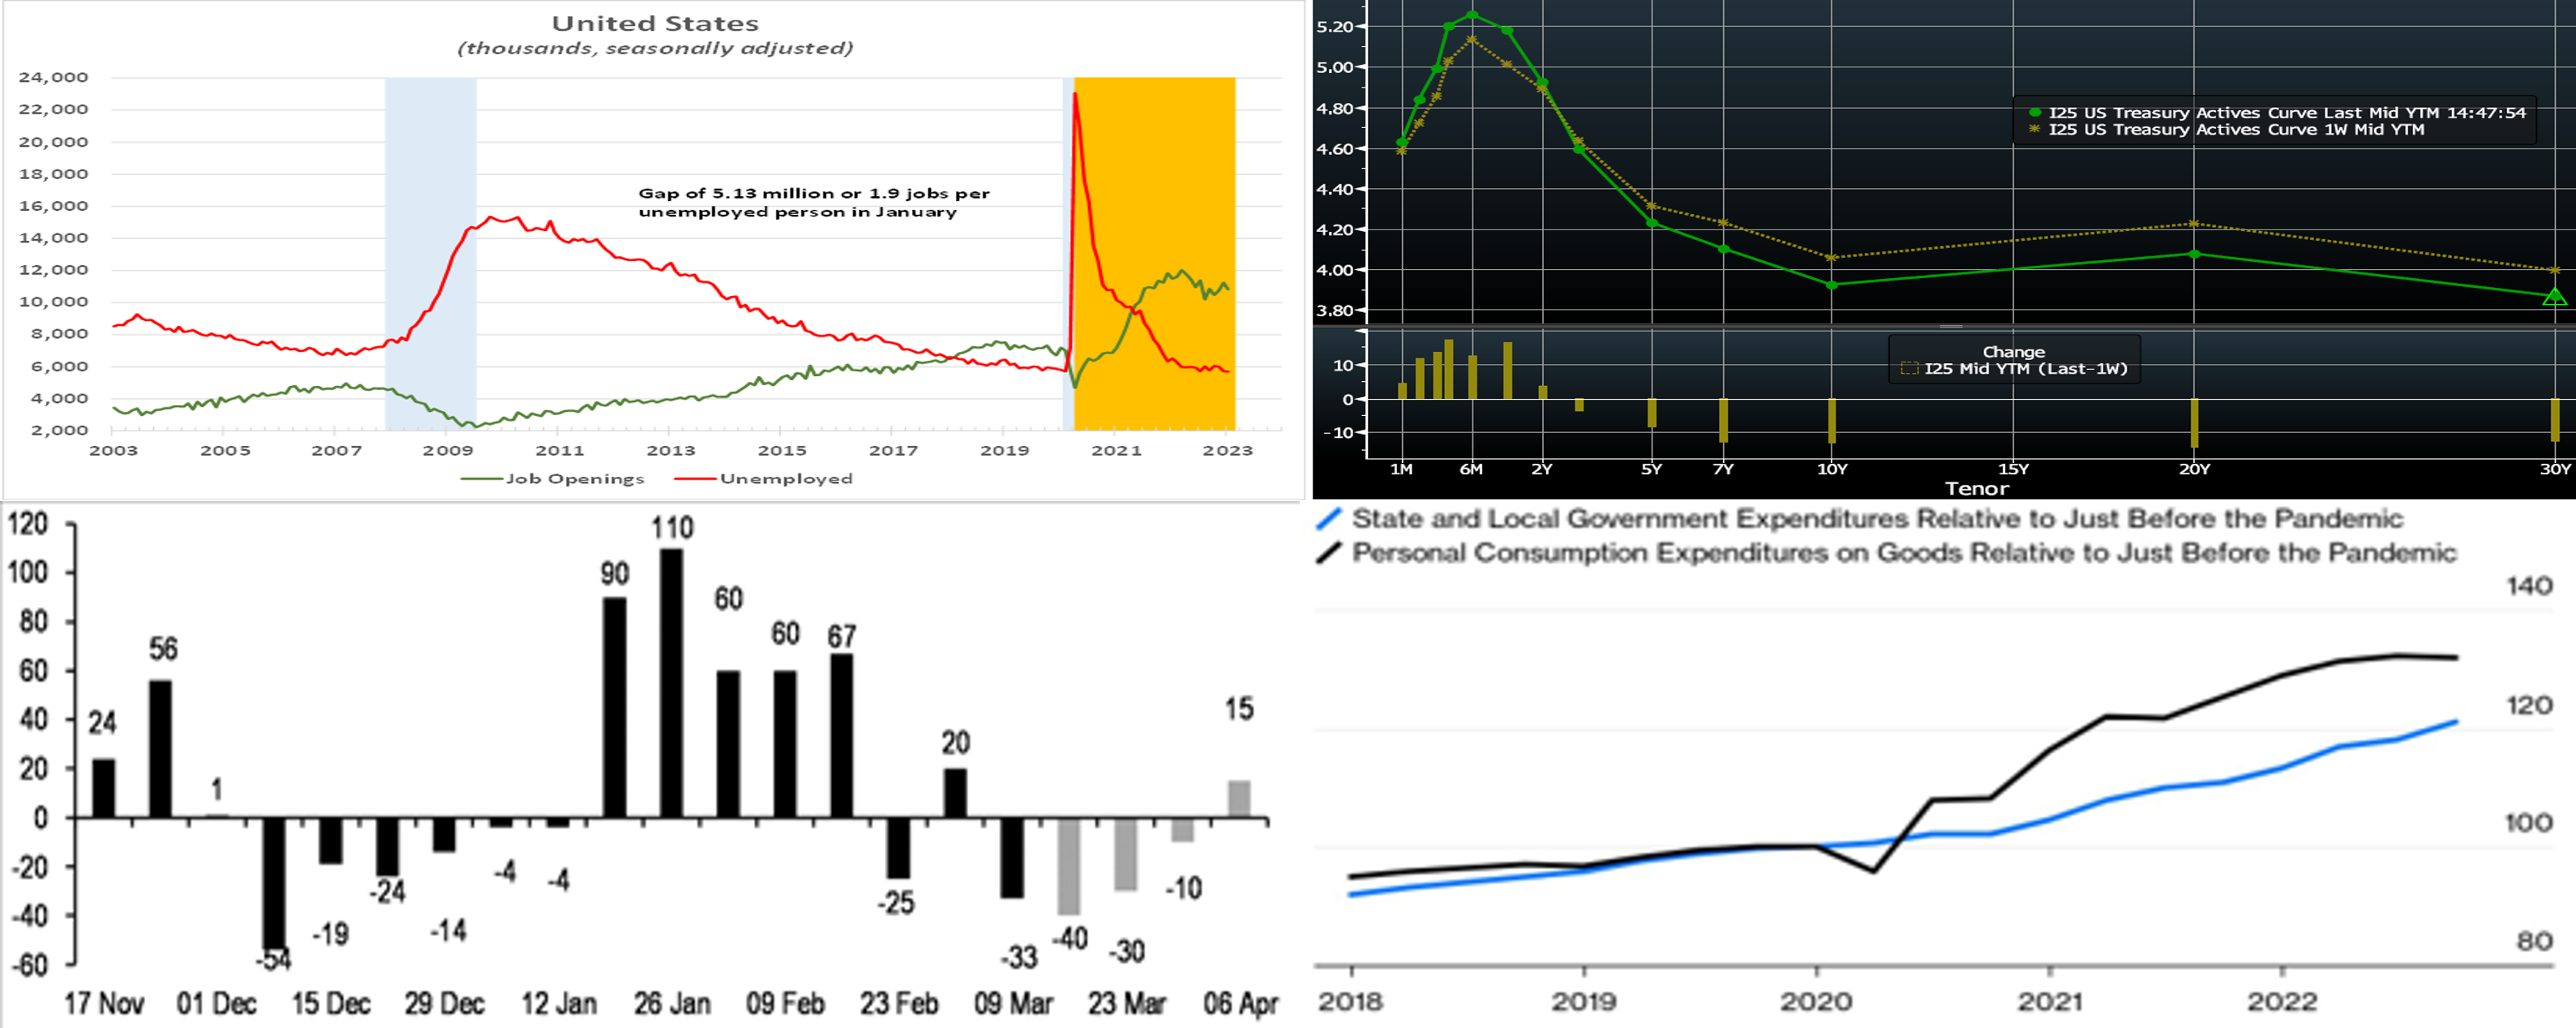
CHART 1 UPPER LEFT
Source: Bureau of Labor Statistics, National Bureau of Economic Research, FHLBNY estimates. Notes: Blue-shaded areas denote recession; orange-shaded area highlights current economic expansion. As pointed out by Federal Reserve Chair Powell at his semiannual testimony to Congress, demand for workers continues to outstrip available supply by a wide margin. The total number of job openings nationwide contracted by 410K to a little over 10.8mn in January yet eclipsed those unemployed at the beginning of the year by a staggering 5.13mn. Looked at another way, the latest figures revealed that there were 1.9 jobs per unemployed person two months ago. While this past Thursday’s jobless claims data was a bit weaker than expectations, the jobs market overall remains healthy, and so the March 8th jobs report could prove to be a market-moving event if it significantly veers from market forecasts.
CHART 2 UPPER RIGHT
Source: Bloomberg. Top pane is yield (LHS, %), bottom pane is change (bps). From last Thursday afternoon to this, and after reversing a significant upward move from days prior, UST yields finished higher in the 2-year-and-in sector but lower thereafter. The main market-mover of the week was Fed Chair Powell’s appearance before Congress on Tuesday morning in which he essentially cited, “if the totality of data indicate that more hikes are warranted, then the Fed will increase the pace and be restrictive for some time.” In reaction, the market repriced higher and longer the prospective path of Fed hikes, and the 2-year yield hit its highest level since 2007. Subsequently on Thursday, yields retraced notably lower, as the higher levels appeared to attract real money and short-covering buyers before Friday jobs data; there was also equity market weakness in the banking sector that may have spurred safe-haven buying in USTs. For the March 22nd FOMC, the market now prices a 100% probability of a 25 bps hike, with ~65% chance of a 50 bps hike. The market’s pricing for end-2023 is now ~5.44%, up from last week’s 5.33%. The market has also priced higher/later the peak rate to ~5.60% for this October, up from ~5.50% a month later compared to a week ago.
CHART 3 LOWER LEFT
Source: JP Morgan; US Treasury. Shown here is the weekly net issuance (LHS, $bn) of T-bills, both historical (black bars) and JP Morgan projections (gray bar). In the near-term, the path for T-bill issuance should be closely tied to debt ceiling developments or lack thereof. Recently, net issuance has declined and gone negative, as Treasury navigates special measures to remain under the ceiling. Later this year, assuming the debt ceiling is resolved/raised, T-bill issuance is expected to markedly rise again. In the immediate timeframe, the lower bills supply has benefited FHLB paper on a relative basis. Consequently, our shorter-term SOFR ARC (floaters) advance spreads have notably tightened to the lowest levels of the past year; indeed, this product can be an attractive alternative to rolling Overnights. Kindly call the desk for further information.
CHART 4 LOWER RIGHT
Source: Bloomberg; Bureau of Economic Analysis. Notes: Data series indexed (100 is baseline) to January 2020, unadjusted for inflation. Shown here is the trend in consumer expenditures vs. that of state & local governments. The money flowing into the latter’s coffers from sales taxes grew 50% faster than the money flowing out. Given this trend and that many state & local governments may still be holding as-yet unused pandemic and/or infrastructure legislation funds, the sector likely remains a source of deposits. For those members interested in this sector but unfamiliar with our municipal letters of credit products, please visit our Letters of Credit page.
FHLBNY Advance Rates Observations
Front-End Rates
- Short-end rates were higher, week-over-week. While very short rates were only up a few bps, 3-week-and-out tenors increased by 13 to 21 bps in steepening fashion. The move higher was essentially further upwardly revised pricing of the Fed’s hiking path. Please see the previous section for more specific Fed-pricing color.
- Given the Fed’s ongoing tightening and data-dependent posture, rates will be most responsive near-term to the data calendar, especially given the Fed blackout mode prior to the March 22 FOMC. This upcoming week’s CPI and PPI reports are likely to be influential events.
Term Rates
- The longer-term curve flattened Thursday-to-Thursday, with shorter tenors higher but 3-year-and-out lower and generally mirroring moves in USTs and swaps. While 1 and 2-year were up ~13 and 3 bps, respectively, the 3. 5, and 10-year were down ~2, 8, and 16 bps. Kindly refer to the previous section for relevant market color. The advance curve remains inverted out to 5-year, thereby offering opportunities to extend in advance duration at lower coupon cost.
- On the UST term supply front, this upcoming week serves a reprieve from auctions. Data releases will be prominent, especially the CPI report. Kindly call the Member Services Desks for information on market dynamics, rate levels, or products.
Product Alert: FHLBNY is pleased to announce the reintroduction, after a temporary suspension owing to Libor-cessation, of the Putable Advance, Fixed-Rate with SOFR Cap Advance, and ARC with SOFR Cap/Floor Advance. The Callable Advance continues to be offered. This expansion of the product menu will provide members with more options and flexibility for the management of funding and/or hedging needs.
Forward Start Advance (FSA): For members with upcoming borrowing or refunding plans, consider the FSA as a method to opportunistically “lock in” rates before advance settlement date. Please contact the Member Services Desk at (212) 441-6600 for more information.
The Symmetrical Prepayment Advance Feature
For those anticipating term funding needs, and with rates on an uptrend, it can be an appropriate juncture to consider our SPA feature. This feature allows the member to capture, at prepayment, changes in the fair value of the advance which are favorable to the member. Contact Member Services Desk to discuss.
Looking for more information on the above topics? We’d love to speak with you!
Questions?
If you wish to receive the MSD Weekly Market Update in .pdf format (includes FHLBNY rate charts) or to discuss this content further, please email the MSD Team.