Member Services Desk
Weekly Market Update
This MSD Weekly Market Update reflects information for the week ending April 5, 2024.
Economist Views
Click to expand the below image.
Please note that the monthly employment situation report to be released on Friday April 5th at 8:30 a.m. may impact markets and any rate levels referred to herein.
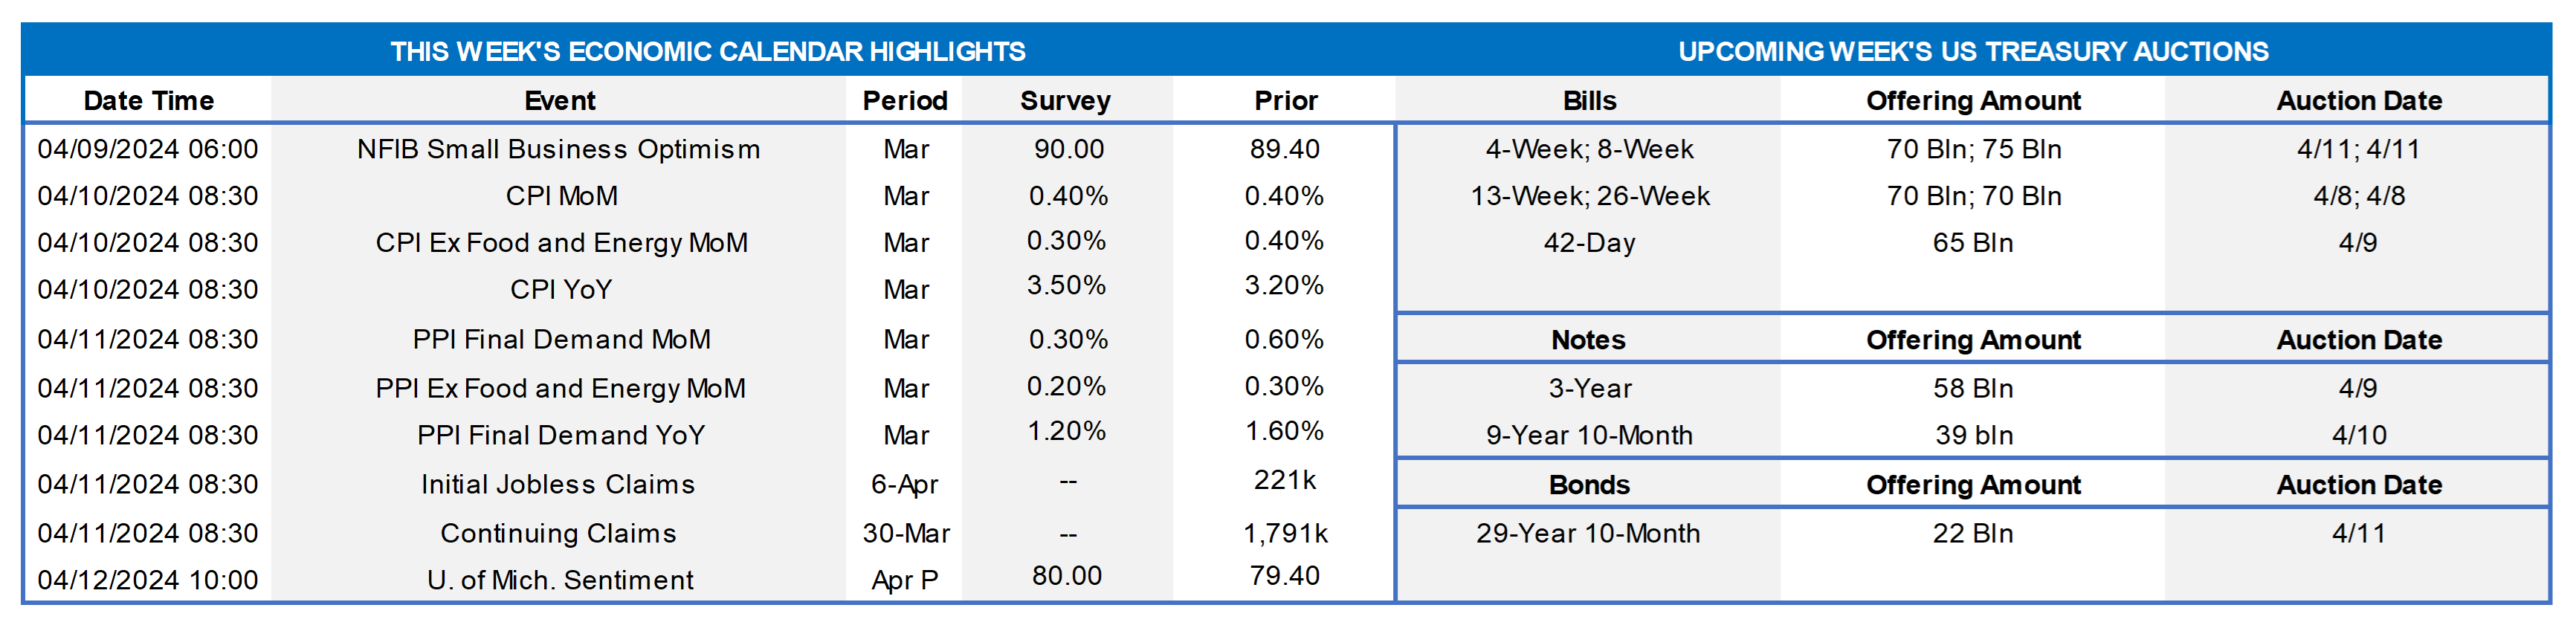
With the March employment report in the rear-view mirror, market focus will turn to the inflation side of the Federal Reserve’s dual mandate. The median Street projection calls for yet another .4% rise in the headline Consumer Price Index (CPI) last month, but waning beginning-of-the-year residual seasonality in core goods and services costs hints that a more favorable result may be in store. Away from the Bureau of Labor Statistics’ updates on consumer and producer price inflation, the economic calendar will be quiet. The latest soundings on small business and consumer confidence likely will show significant improvement, while jobless claims probably remained confined to recent ranges. A quintet of Fed officials, including two current FOMC voters, will provide their thoughts on the economy and monetary policy. Of note, New York Fed President John Williams will provide the keynote address and participate in a Q & A session at the FHLB-NY 2024 Member Symposium. The minutes from the March 19-20 FOMC meeting will provide useful color on meeting participants’ views of the economy and policy prospects.
NFIB Small Business Optimism Index: Echoing reported improvements in business and consumer sentiment, the National Federation of Independent Business’ barometer likely rebounded to an 18-month high of 92 in March from 89.4 in the preceding month.
Consumer Prices: A broad-based deceleration in core goods and services costs probably capped the rise of the CPI at .2% last month, after a larger-than-expected .4% hike in February. The CPI excluding volatile food and energy costs likely edged .2% higher as well during the reference period – the smallest increase since last October. Those projections, if accurate, would place the overall and core CPIs 3.3% and 3.6% above their respective year-ago levels, still well above the Federal Reserve’s desired 2% target.
Producer Prices: Inflation is expected to have slowed at the producer level in March. The Producer Price Index for final demand (PPI-FD) – a measure of prices received by domestic producers of goods, services, and construction sold for personal consumption, capital investment, government, and export – probably edged .3% higher last month, after a .6% rise in February. That result, if realized, would place the PPI-FD 2.2% above the level recorded 12 months earlier.
Jobless Claims: Initial claims for unemployment insurance benefits probably remained in the recent 210-220K range during the filing period ended April 6. Continuing claims – the total number of persons collecting benefits – likely hovered near the 1.8mn mark during the week ended March 22 – a sign that the recently unemployed are having few difficulties finding work.
Michigan Sentiment Index: Buoyed by sharp improvements in consumers’ appraisals of current and prospective economic activity over the latter half of March, the University of Michigan gauge likely rose to a nearly three-year high of 83 from 79.4 in the prior month.
Federal Reserve Appearances:
- Apr. 8 Minneapolis Fed President Kashkari to host a townhall discussion at the University of Montana.
- Apr. 10 Chicago Fed President Goolsbee to participate in a panel discussion at the Social Finance Institute.
- Apr. 10 Federal Reserve to release minutes of March 19-20 FOMC meeting.
- Apr. 11 New York Fed President Williams to give keynote remarks at the FHLB-NY 2024 Member Symposium.
- Apr. 11 Boston Fed President Susan Collins to speak at the Economic Club of New York.
- Apr. 12 San Francisco Fed President Daly to participate in a fireside chat at the 2024 Fintech Conference.
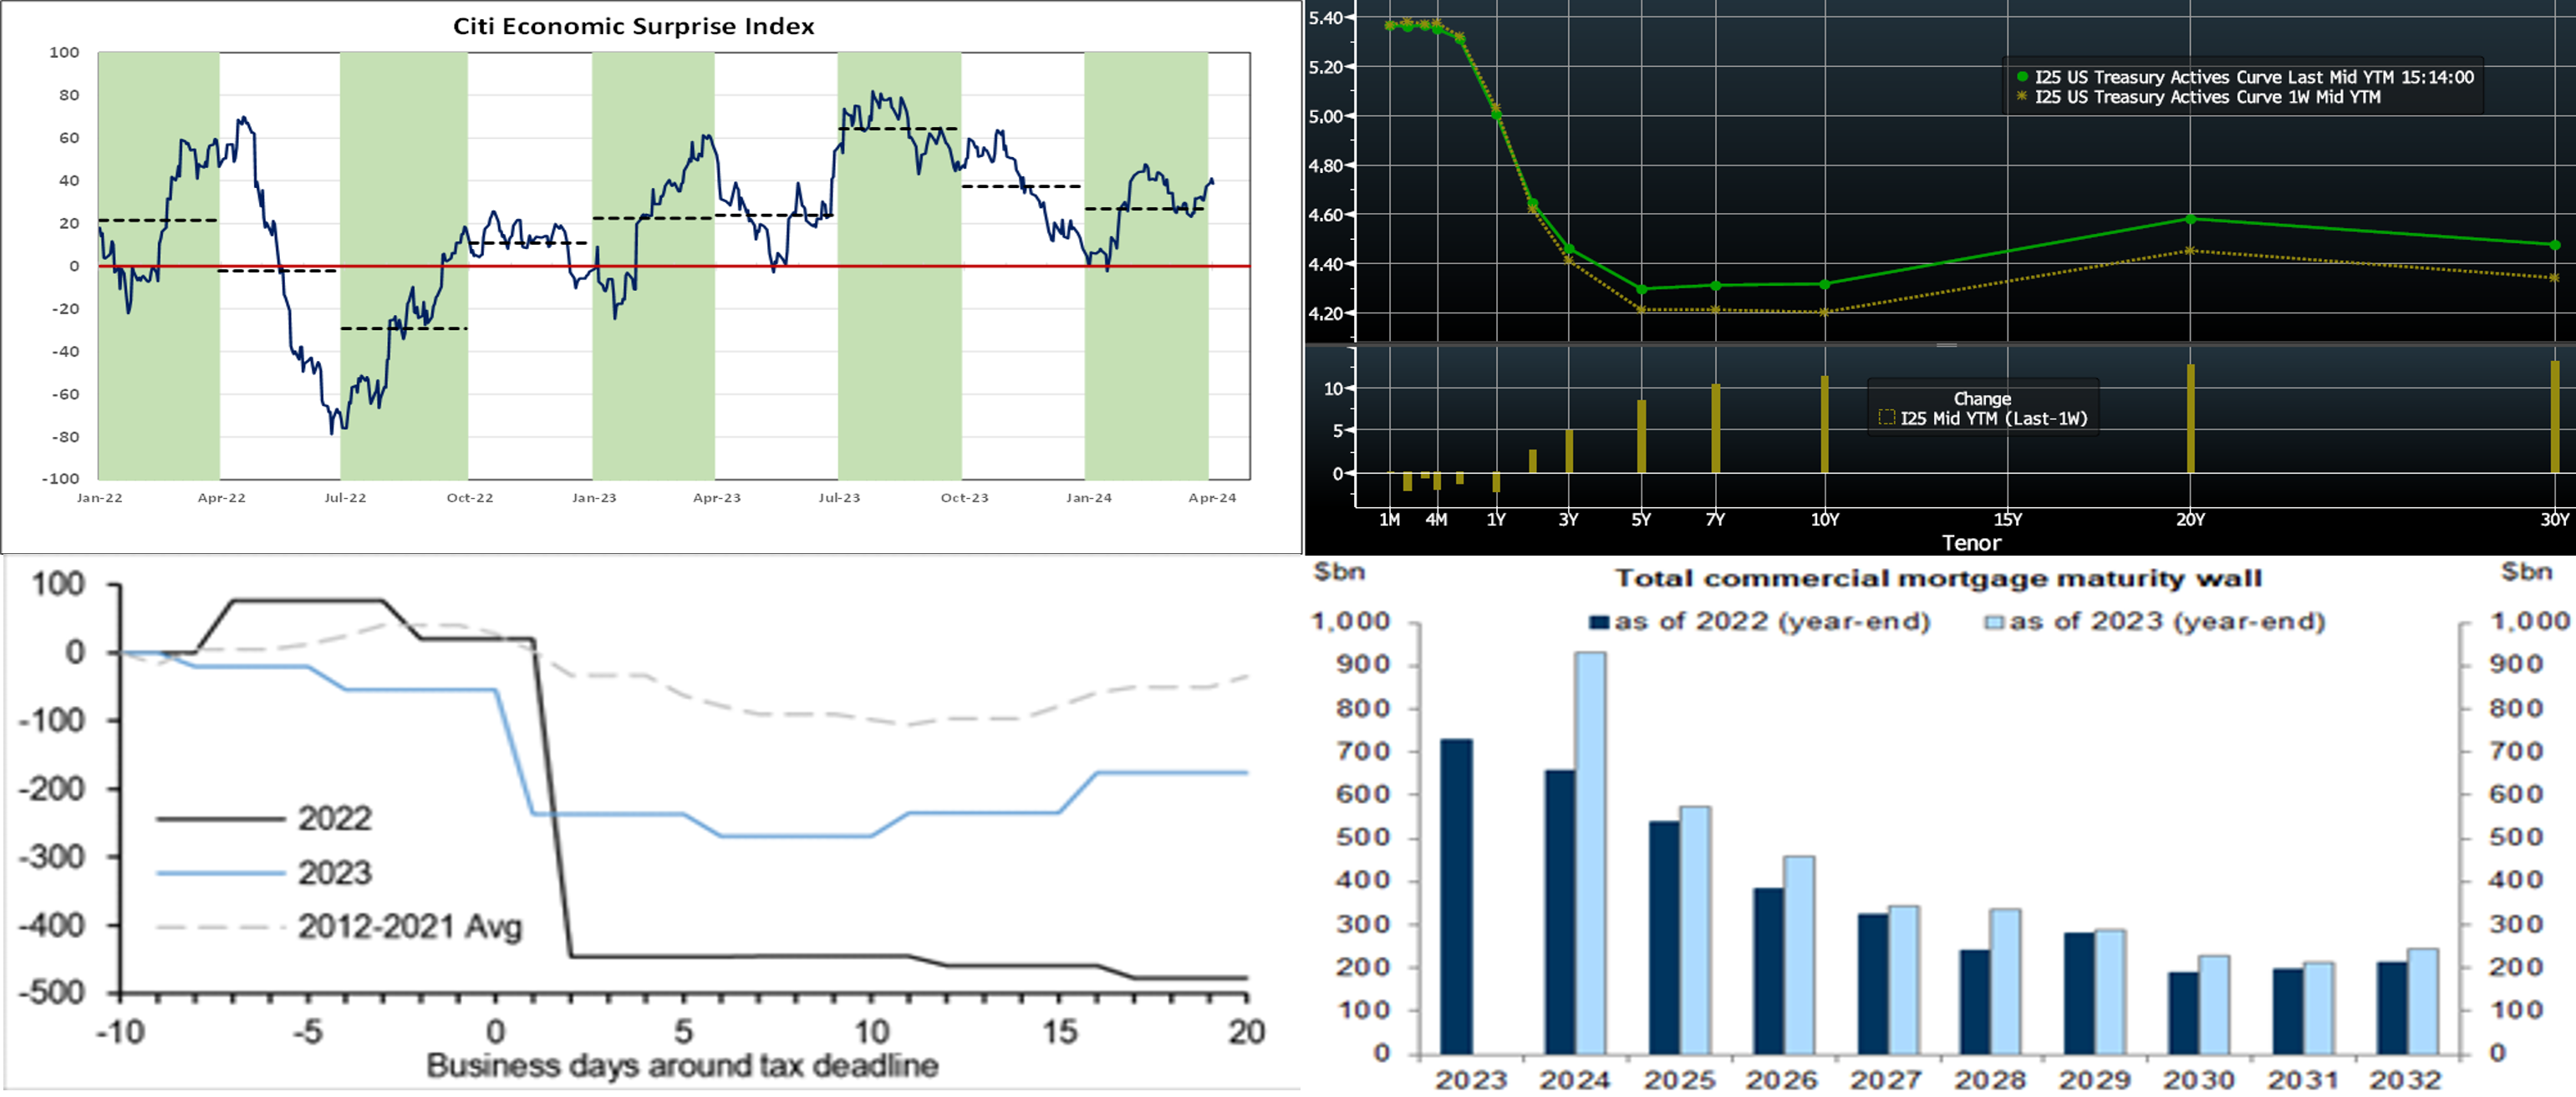
CHART 1 UPPER LEFT
Source: Citibank; FHLB-NY. Note: Green-shaded areas used to highlight calendar quarters; black-dotted lines denote quarterly average. While the consumer inflation reports for January and February were admittedly disappointing, recent reductions in market-based probabilities of forthcoming rate cuts have had more to do with the realization that economic activity has shown few, if any, signs of buckling. Indeed, the median economist projection calls for real GDP growth to have slowed to 2% annualized in Q1 from Q4 2023’s 3.4% clip, but that would mark the seventh straight quarter at an above-trend pace. Moreover, recent activity readings have continued to eclipse Street expectations by a wide margin. Indeed, as of this past mid-week, the Citi Economic Surprise Index stands at 38.6, well above the zero reading that is associated with economic data matching market consensus projections.
CHART 2 UPPER RIGHT
Source: Bloomberg. Top pane is yield (LHS, %), bottom pane is change (LHS, bps). From last Thursday afternoon to this, the UST curve pushed higher and steeper. While 1-year was a few bps lower, the 2- to 10-year zone was 3 to 10 bps higher. Rates had been higher during the week, but fresh geopolitical concerns generated UST demand on Thursday afternoon. Data, as noted above, and Fedspeak continue to support a “rate cuts are likely this year but waiting/monitoring for now” mode for the Fed. In terms of market-implied pricing of the Fed, a full 100% probability of a 25 bps cut is still August 1st, with the June 13th FOMC priced at ~76% chance, up from ~65% last week. The year-end 2024 forward is ~4.58%, or ~3 bps lower than last week, implying a cumulative total of ~75 bps of cuts by the end of this year.
CHART 3 LOWER LEFT
Source: JP Morgan. This month’s tax season could provide volatility in money flows among various sectors. Typically, tax season results in a decline in the Fed’s Reverse Repurchase Program (RRP) and bank reserves as entities withdraw funds from Money Market Funds (MMFs) and bank deposits to fund taxes owed. Shown here is the cumulative change in total reserve balances (LHS, $bn) around Tax Day; the years 2022 and 2023 are shown as well as the average for 2012-2021. The declines of the past two years were more severe than those of prior years, with 2022 being a particularly sharp decline, partly a result of notable capital gains in the prior year. With a strong jobs market plus capital gains in tax-year 2023, this month’s tax-related outflows, according to JP Morgan, could reasonably fall in the $40 to $140bn range for MMFs and $215 to $465bn range for reserves. As always, the FHLB-NY is here to help our members manage any liquidity volatility spurred by these dynamics.
CHART 4 LOWER RIGHT
Source: Mortgage Bankers Association; Goldman Sachs Global Investment Research. Fed Vice-Chair of Supervision Michael Barr this week noted that Commercial Real Estate (CRE), especially in offices and/or concentrated portfolios, remains a risk to monitor. Shown here is that the amount of outstanding commercial mortgages set to mature by year-end 2024 has grown from $658bn at the start of last year to $929bn today. Of this $270bn increase, $114bn is currently held by banks while the remaining $156bn is held by non-bank entities. The primary driver of this material increase has been the willingness of lenders and borrowers to modify and extend maturing loans rather than refinancing or forcing a foreclosure. In other words, a decent portion of the loans that were set to mature last year were modified and extended to 2024. Unsurprisingly, office loans have held a disproportionate share of modifications. High refinancing rates and challenged property prices have underpinned this dynamic. While overall CRE risk appears contained by many measures, it should remain an area to monitor.
FHLBNY Advance Rates Observations
Front-End Rates
- Short-end rates were unchanged to a few bps lower week-over-week, with the 3- to 6-month sector lower by two bps, owing to stronger demand for paper in the post-holiday week. Net T-bill supply, after a long spell in positive territory and in timing with the upcoming Tax Day when Treasury receives cash inflows, has turned negative in recent weeks. This development, all else equal, can help tighten spreads on FHLB paper. Having said that, the looming April tax date is an item to monitor, as it can also spur withdrawals from MMFs.
- The data highlight in the upcoming week will be the inflation releases; market participant will also monitor the ongoing plethora of Fed speakers.
Term Rates
- The longer-term curve, week-on-week and generally mirroring moves in USTs and swaps, was higher and steeper. The 2-year was a few bps lower, but the 2- to 10-year sector was 4 to 12 bps higher, in steepening fashion. Please refer to the previous section for color.
- On the UST term supply front, the upcoming week serves a slate of 3/10/30-year auctions. Note that UST auctions usually occur at 1pm and can occasionally cause volatility around that time. Please contact the Member Services Desk for further information on market dynamics, rate levels, or products.
The FHLBNY is pleased to announce the 2024 0% Development Advance (ZDA) Program, now available with a new streamlined submission process. This program provides members with subsidized funding in the form of interest rate credits to assist in originating loans or purchasing loans/investments that meet the eligibility criteria under the Business Development Advance (BDA), Climate Development Advance (CDA), Infrastructure Development Advance (IDA), or Tribal Development Advance (TDA). Please contact the Member Service Desk for information and/or visit our ZDA information page.
Price Incentives for Advances Executed Before Noon: In effect as of Tuesday, September 5, 2023, the FHLBNY is pleased to now offer price incentives for advances executed before Noon each business day. These pricing incentives offer an opportunity to provide economic value to our members, while improving cash and liquidity management for the FHLBNY. For further details, kindly refer to the Bulletin.
The Symmetrical Prepayment Advance Feature
For those anticipating term funding needs, and with rates on an uptrend, it can be an appropriate juncture to consider our SPA feature. This feature allows the member to capture, at prepayment, changes in the fair value of the advance which are favorable to the member. Contact Member Services Desk to discuss.
Looking for more information on the above topics? We’d love to speak with you!
Questions?
If you wish to receive the MSD Weekly Market Update in .pdf format (includes FHLBNY rate charts) or to discuss this content further, please email the MSD Team.