Member Services Desk
Weekly Market Update
This MSD Weekly Market Update reflects information for the week of August 3, 2020.
Economist Views
Click to expand the below image.
As widely expected, the Federal Open Market Committee voted unanimously to maintain the current accommodative stance of monetary policy. Policymakers left the federal funds rate target range at 0 to .25% and plan to maintain the Central Bank’s holding of Treasury securities and Agency residential and Commercial mortgage-backed securities at least at the current pace to ensure smooth market functioning. Looking ahead, Fed officials reiterated that they remain committed to using the full range of tools to support the U.S. economy in this challenging time. While real GDP contracted by a whopping 32.9% annualized during Q2, a wide range of indicators suggest that activity bottomed in April and that an expansion is now under way. This week, business activity surveys, employment measures and motor vehicle purchases are all expected to portray that the economy gathered further steam in July.
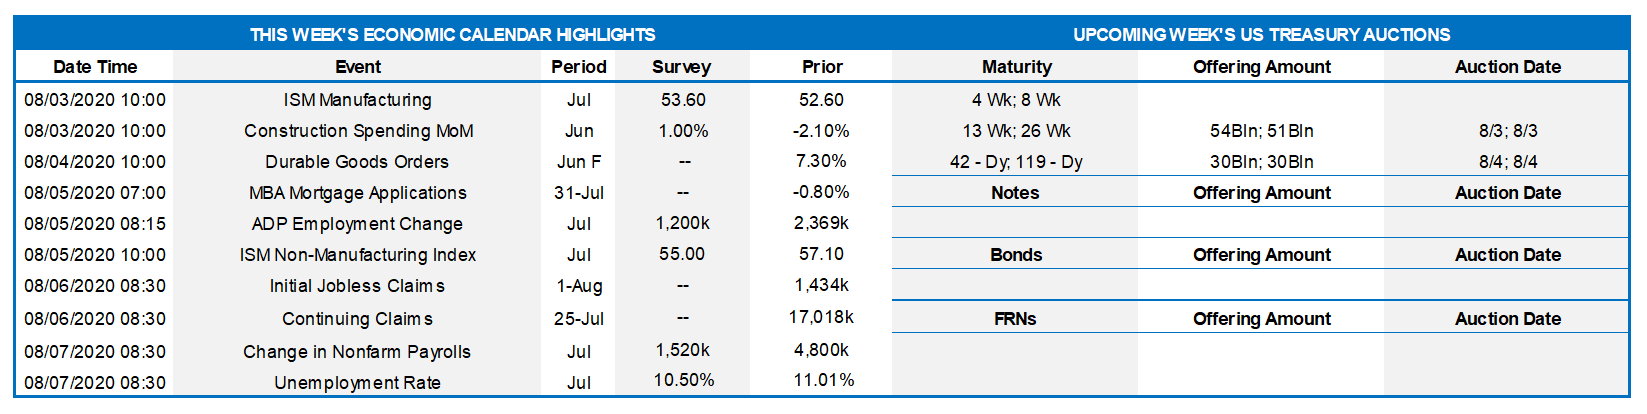
ISM Manufacturing Index: Across-the-board improvements in regional factory activity gauges suggest that the Institute for Supply Management’s closely followed barometer climbed from 52.6 in June to 56.8 in July – the highest reading since November 2018.
Motor Vehicles Sales: Industry experts expect unit motor vehicle sales – a direct input into government statisticians’ estimates of consumer spending – to jump by 9.6% to a seasonally adjusted annual rate of 14.3mn. While the most purchases since the 16.8mn cars and light trucks bought in February, that tally would remain ~15% below that of July 2019.
ADP National Employment Report: Setting the tone heading into the Bureau of Labor Statistics’ (BLS) official release, ADP Employer Services probably will report that 1.725mn net new jobs were created in the private sector in July. Be on the lookout for another sizable upward adjustment to the preliminary prior-month tally. ADP estimated that 2.4 million employees were added in June, well shy of the BLS’ 4.8-million count.
ISM Non-Manufacturing Activity Index: District Federal Reserve Bank canvasses suggest that the recovery in non-manufacturing activity likely widened in July, improving on the 57.1 reading posted in June.
Employment Situation Report: Labor-market soundings since the BLS’ June survey period suggest that roughly 3.1mn workers were added in July. Rising by a projected 10.6mn over the latest three months, nonfarm payrolls likely will have recouped almost half of the 22.2mn jobs lost in the wake of the COVID-19 crisis. The reported decline in the State insured unemployment over the past five weeks hints that the civilian jobless rate will move back into single-digit territory from June’s 11.1%. With the composition of job gains once again likely skewed toward lower-paid positions, be on alert for a third straight decline in average hourly earnings in next week’s report.
Key Market Trends
Click to expand the below images.
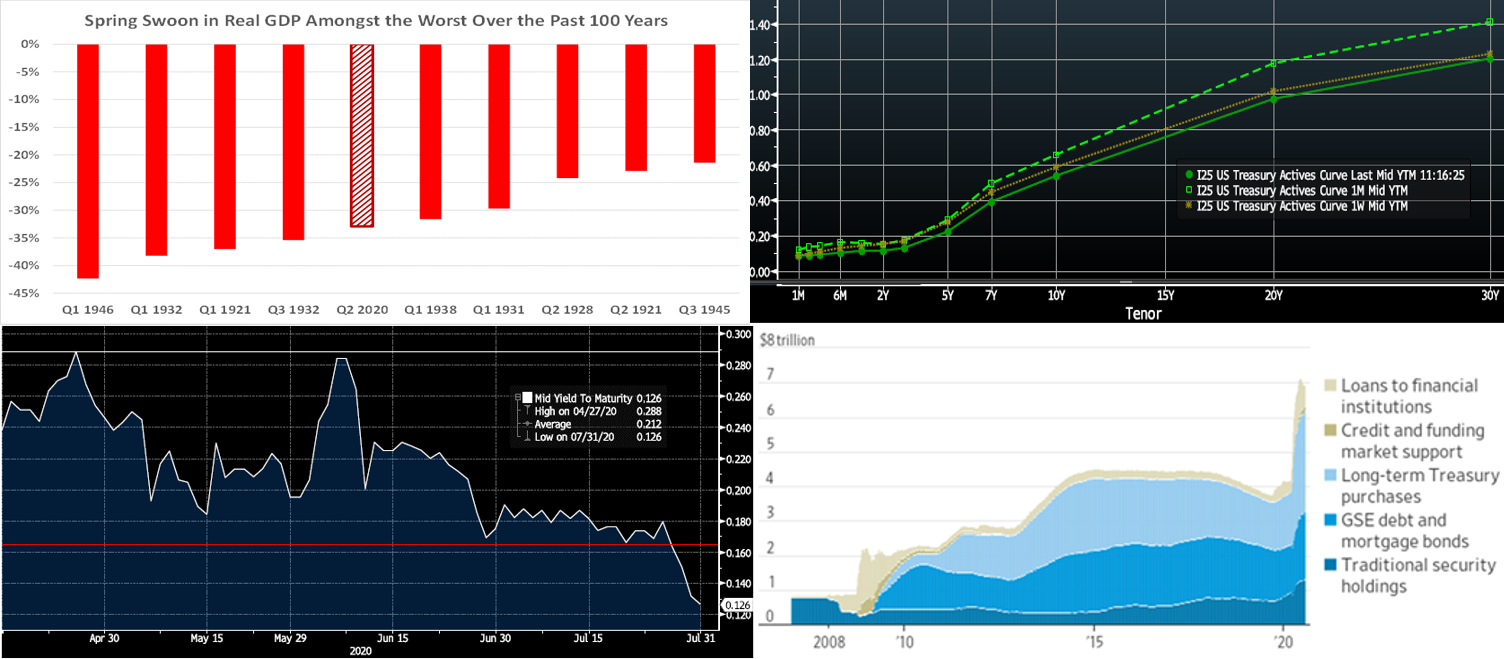
CHART 1 – UPPER LEFT
Source: FHLBNY. This past Thursday’s release of Q-2 GDP data was not much of a surprise, in terms of expectations, but it was nonetheless a stark reminder of the impact of the pandemic and economic crisis. The GDP dip of 32.9% annualized was among the worst in US history. Across the Atlantic, Germany likewise announced a historically large and staggering decline in GDP. Despite the economic recovery underway from the depths of a few months ago, the Fed again this week stressed that downside risks remain to the economy. Chairman Powell declared, in effect, that the Fed is not even “thinking about thinking about” if/when rates may be increased. The Fed has also continued to advocate for fiscal relief, including for states. Talks continue among legislators on a new package.
CHART 2 – UPPER RIGHT
Source: Bloomberg. Fed programs and guidance have served to keep the front end of the UST yield curve, especially 5-year and in, contained in a relatively tight range. As seen here, most of the downward move in rates over the past month has been in longer maturities. This tendency of the curve to “bull-flatten” or “bear-steepen”, depending on fresh data and/or news, seems likely to continue for the immediate future. However, this past week, shorter maturities managed to break a few bps lower from their recent ranges. Indeed, post the FOMC, GDP, and jobless claims data, yields reached fresh all-time record lows across the curve.
CHART 3 – LOWER LEFT
Source: Bloomberg. This chart reflects the trading range of the 3-Year UST yield since mid-April; as mentioned above, it has broken below its prior “support” levels and now trades ~.125%. For those considering term funding, it may be an opportune juncture to monitor this range and “pick your spot” to lock in record low rates. This strategy would especially be appropriate for those with available capacity in our discounted Community Lending and/or Disaster Relief Funding programs.
CHART 4 – LOWER RIGHT
Source: FRB Cleveland; WSJ. Here is a snapshot of the Fed’s asset portfolio. It has skyrocketed in response to the crisis to well above that of the financial crisis of the late 2000’s period. The programs have served to restore liquidity to markets and drive rates, credit spreads, and volatility all lower. Given this massive effort, it is perhaps not surprising that the Fed has indicated that it has put forth a massive effort and that further fiscal measures will need to help prolong and broaden a recovery.
FHLBNY Advance Rates Observations
Front-End Rates
Short-end advance rates were 2 to 4 bps lower week-over-week. Heavy T-bill issuance was a feature, as usual, but net supply has been slowing and thereby allowing for easier market absorption. Government-only and Prime MMF AUM experienced declines on the week but not large enough to disrupt conditions. Increased liquidity and demand in the market again allowed for our short-term advance rates to post a decline for the week.
Heavy T-Bill issuance will remain a theme; UST issuance overall is now net positive supply in that more is being issued than what the Fed is buying in its programs, and so this scenario could prove a small challenge. However, with short UST rates at rock-bottom levels, and the Fed likely on hold for a long period, rates may trade in a sideways-to-lower pattern. Net T-bill issuance is forecast by street dealers to notably slow in the months ahead, but a new fiscal relief package may complicate/alter this forecast.
Term Rates
Medium and longer-term advance rates were 5 to 10 bps lower week-over-week, led by longer maturities in a “bull flattening” move. As detailed on the previous slide, the curve has remained in a relatively tight range, especially in shorter maturities, and volatility has been low. But rates broke lower and through previous floors this week, post-FOMC and economic data.
The upcoming week brings a reprieve in UST term supply. Corporate supply might witness a pickup post a bevy of recent earning reports, but it appears that most institutions may have “gotten their fill” in the record issuance period of the past Q-2. Attention will be on further relief legislation and certainly remain on COVID-19 and the question of whether or not it is being managed effectively enough to avoid further pauses in reopening. A key data highlight will be Friday’s jobs report.
Looking for more information on the above topics? We’d love to speak with you!
Questions?
If you wish to receive the MSD Weekly Market Update in .pdf format (includes FHLBNY rate charts) or to discuss this content further, please email the
MSD Team.
Special Member Announcement
The FHLBNY recently announced a newly expanded and flexible Disaster Relief Funding (DRF) advance program which offers discounted rate advances with maturities 1-mo and greater. Additionally, we have announced that PPP loans will be accepted as eligible collateral. Please contact us with any questions.
Disclaimer: Notwithstanding any language to the contrary, nothing contained in these disclosures is intended to constitute an offer, inducement, promise, or contract of any kind. Any product descriptions and pricing may be subject to change without notice.
The content provided in these disclosures is presented as a courtesy to be used only for informational purposes and is not represented to be error free. The FHLBNY makes no representations or warranties of any kind with respect to the content contained herein, such representations and warranties being expressly disclaimed. The FHLBNY is not a financial or investment advisor.
Moreover, the FHLBNY does not represent or warrant that the content of these disclosures is accurate, complete or current for any specific or particular purpose or application. It is not intended to provide nor should anyone consider that it provides legal, accounting, tax or other advice. Such advice should only be rendered in reference to the particular facts and circumstances appropriate to each situation. The FHLBNY encourages you to contact appropriate professional(s) and consultant(s) to assess your specific needs and circumstances and to render such advice accordingly. In addition, the FHLBNY is not endorsing or recommending the use of the means or methods contained in or through these disclosures for any special or particular purpose.
It is solely your responsibility to evaluate the risks or merits of any funding or investment strategy. In no event will FHLBNY or any of its officers, directors or employees be liable for any damages — whether direct, indirect, special, general, consequential, for alleged lost profits, or otherwise – that might result from any use of or reliance on these materials.