Member Services Desk
Weekly Market Update
This MSD Weekly Market Update reflects information for the week of August 1, 2022.
Economist Views
Click to expand the below image.
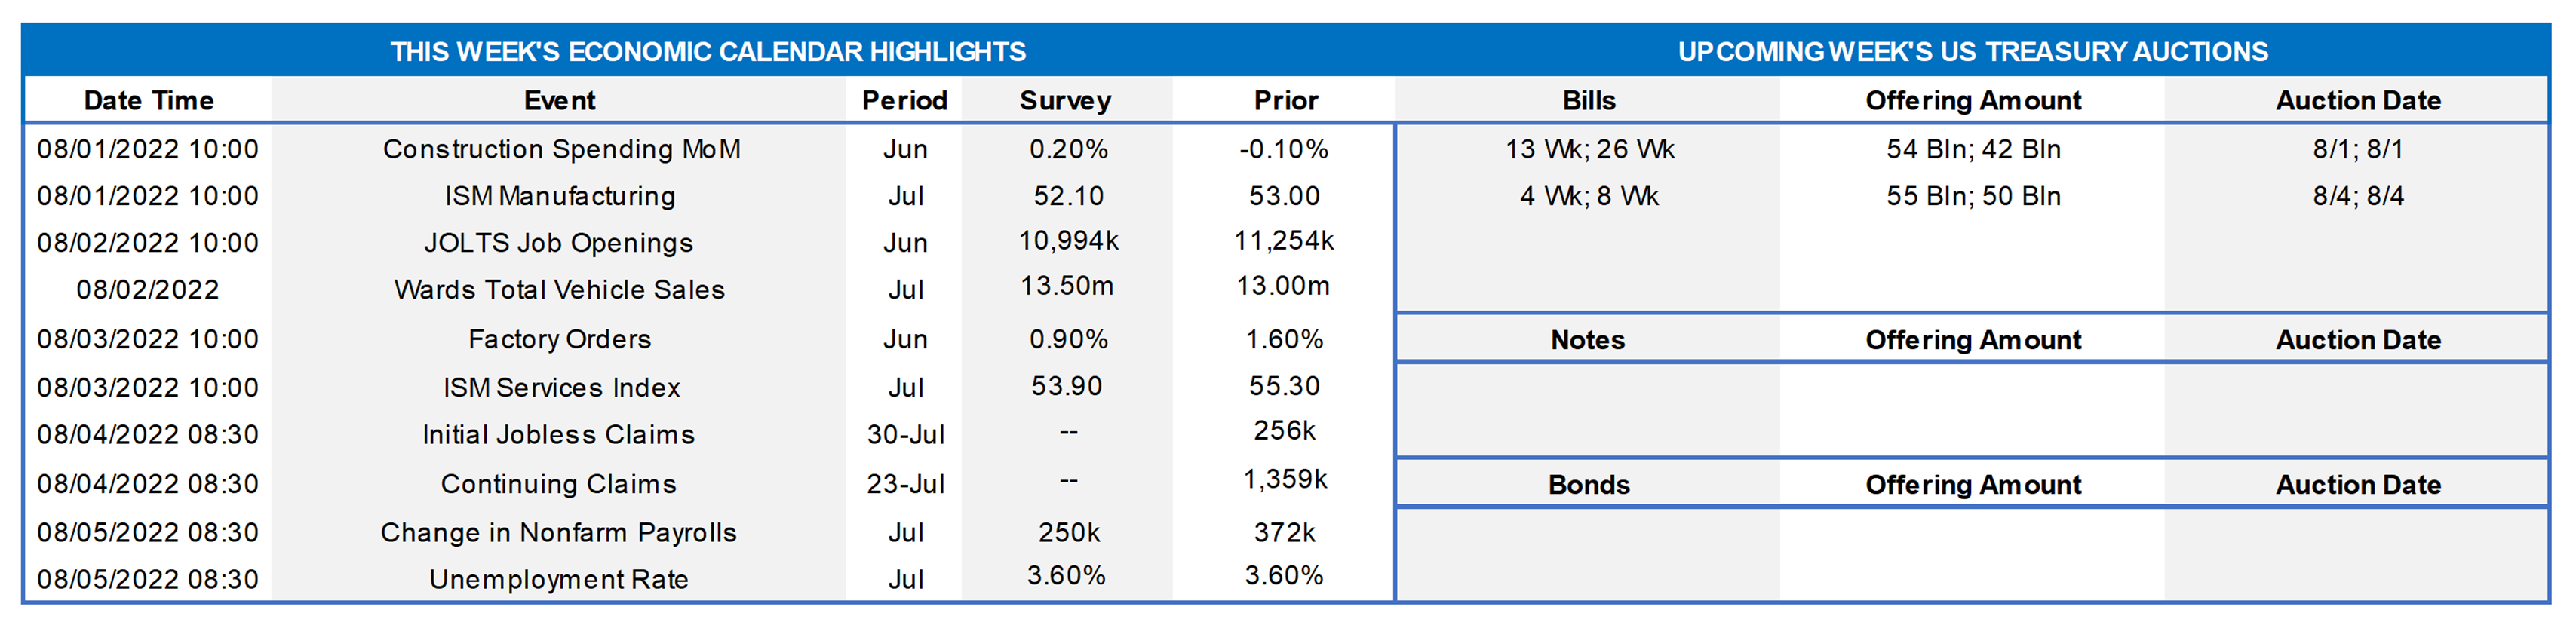
Having weathered yet another sizable increase in the federal funds rate target, market participants will turn their attention back to the economic release calendar. Policymakers will have two complete data cycles in hand before they gather for the next Federal Open Market Committee meeting on September 20-21. Labor market soundings will be the key metrics to watch this week. Consistent with continued economic expansion, nonfarm payrolls likely expanded by 300K in July, while the civilian jobless rate held steady at 3.6%. Labor demand likely remained solid, with the number of available job openings rebounding in May. Closely followed gauges produced by the Institute for Supply Management probably dipped last month but remained in expansionary territory.
Construction Spending: The nominal value of new construction put-in-place is expected to have edged .3% higher in June, after a modest .1% dip in the previous month. If that projection is on the mark, construction spending rose by 7.8% annualized during the second quarter, down sharply from the winter’s 22.3% pace.
ISM Manufacturing Index: The nationwide manufacturing expansion likely continued as the summer began, albeit at a slightly slower pace. District Federal Reserve Bank canvasses and other surveys suggest that the Purchasing Managers Index moved one-half percentage point lower to 52.5% – the lowest reading since the pickup began in June 2020.
JOLTS Job Openings: A reported snapback in online help-wanted postings suggests that total job openings rebounded by 200K to 11.5mn in June, roughly 400K shy of the 11.9mn all-time high set in March. Given the dip in civilian unemployment last month, that result would leave the gap between available positions and the jobless at 5.5mn. Put another way, there was an estimated 1.9 jobs per unemployed person available in June.
Motor Vehicle Sales: Combined purchases of autos are expected to have risen by 3.1% to a seasonally adjusted annual rate of 13.4mn in July, a touch above the 13.3mn posted over the April-June span.
Factory Orders: Powered by a defense-led surge in transportation equipment bookings, factory orders probably edged .5% higher in June, boosting the cumulative gain since last September to 11%.
ISM Services Activity Index: Available soundings suggest that service-producing activity rose in July but at the slowest pace since the expansion began two years ago. Indeed, the Institute for Supply Management Services Purchasing Managers Index probably declined to 51.5% from 55.3% in the previous month.
International Trade Deficit: Released on 8/4 – Reflecting an already reported narrowing of the merchandise trade gap, the international trade deficit on goods and services likely closed by $6.4bn to $79.2bn in June – the smallest shortfall since the $78.9bn posted in December.
Employment Situation Report: The uptrend in initial and continuing jobless claims since the June establishment period suggests that payroll employment growth likely slowed to 300K in July from the 375K pace set over the April-June span. The civilian unemployment rate is expected to remain at 3.6% for a fifth straight month. Average hourly earnings are expected to edge .3% higher, matching June’s reported gain. That increase, if realized, would place the closely followed nominal compensation measure 5% above the pay received a year ago.
Federal Reserve Appearances:
- Aug. 2 Chicago Fed President Charles Evans will host reporters for an on-the-record breakfast conversation.
- Aug. 2 St. Louis Fed President Bullard to discuss the economy and monetary policy with the Money Marketeers of NYU.
- Aug. 4 Cleveland Fed President Mester to discuss the economic and policy outlook with the Economic Club of Pittsburgh.
Click to expand the below image.
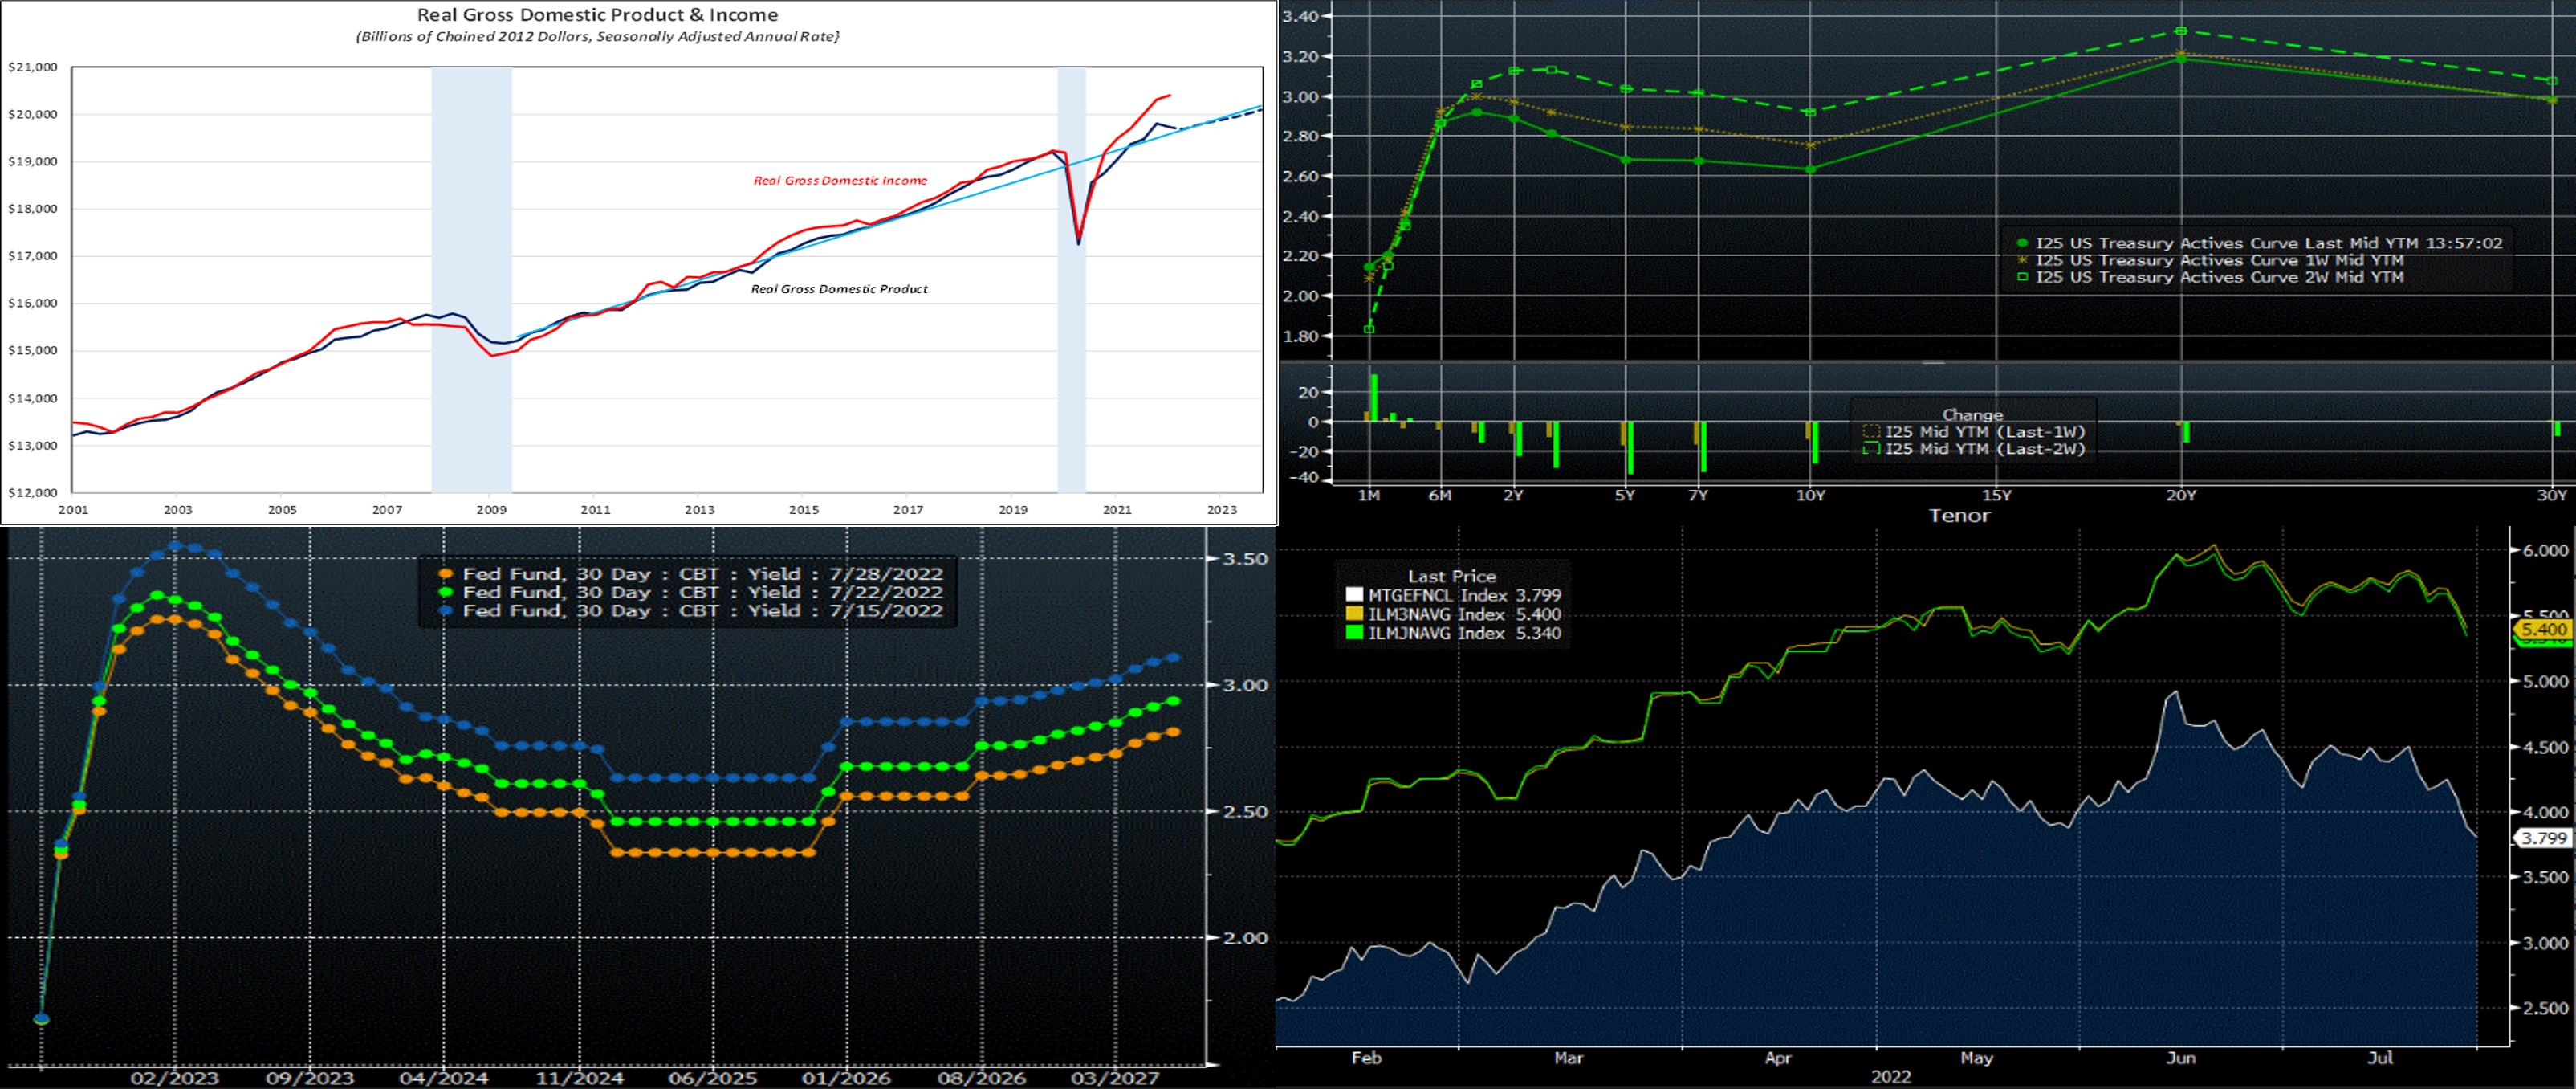
CHART 1 UPPER LEFT
Source: Bloomberg; BEA; NBER; FHLB-NY. Notes: Shaded areas denote recessions; dotted line represents consensus projections. The record gap between real gross domestic income (GDI) and real gross domestic product (GDP) suggests that the apparent weakness in the latter will prove illusory when the Bureau of Economic Analysis (BEA) releases annual adjustments in September. Real GDI is the total income received by all sectors of the economy, adjusted for inflation. It includes the sum of all wages, profits, and taxes minus subsidies. Since all income is derived from production (including services), real GDI should exactly equal real GDP. The difference at any given time is known as the statistical discrepancy (note that real GDI data for Q2 will not be released until the end of August when corporate profit figures become available.) Historically, the BEA has adjusted real GDP closer to real GDI upon revision, and so this observation provides context to the latest weak GDP data. Of special note and for further information on both the national and regional economies, please register for the FHLB-NY’s upcoming webinar (Thursday, Aug.4, 11 a.m.) featuring Financial Economist, Brian Jones. Please contact the desk and/or visit https://register.gotowebinar.com/register/6413203259565634317.
CHART 2 UPPER RIGHT
Source: Bloomberg. Note: Top pane is yield (%), bottom pane is change (bps). The UST yield curve finished lower from a week prior, led by the belly (5 to 7-year), as the market priced for a less aggressive Fed hiking cycle (see further color below in next chart) post the FOMC meeting as well as some weaker-than-forecast economic data releases which sparked further concern about potential recession. The 1-year-and-in maturities were 5 to 7 bps lower. While 2-year was ~8 bps lower, 5-year finished ~16 bps lower week-over-week. As seen in the chart, yields are notably lower than two weeks ago. Market volatility, while lower than in previous months, remains high, and so we encourage members to remain in touch with the desk for information and color.
CHART 3 LOWER LEFT
Source: Bloomberg. Shown here is the Fed Funds futures curve (RHS, %) both pre (1 and 2 weeks ago) and post-FOMC. Clearly, the market has shaved/lowered its pricing of the Fed’s hiking cycle, especially compared to mid-July. This past week’s FOMC was perceived as somewhat dovish, at least in respect to Chair Powell’s references to the policy rate now being near neutral and that the Fed will be in data-dependent mode. Weaker-than-expected economic data, most prominently the past week’s GDP release, also spurred the market repricing. With nearly two full economic data cycles before the next FOMC on September 21st, the curve could experience ongoing shifts and volatility.
CHART 4 LOWER RIGHT
Source: Bloomberg. Perhaps homebuyers will see further mild relief from rising mortgage rates, given the moves of the past month. Depicted here is the 30-year Current Coupon (RHS, White, %, representing the market yield of a par-priced agency MBS), the Bankrate.com 30-year conventional mortgage rate (RHS, Green, %), and the Bankrate.com 30-year Jumbo mortgage rate (RHS, GOLD, %). The Current Coupon’s decline has outpaced that of the end-user mortgage rates, and so possibly the latter will “catch up”. Such a development would be welcome news for persistently declining mortgage application numbers. Note that jumbo rates, at 5.40%, are 6 bps higher than that of conventional, thereby indicating ongoing strong demand from banks and other investors.
FHLBNY Advance Rates Observations
Front-End Rates
- Short-end Advance rates finished mixed and the curve flatter week-on-week. For instance, while 1-week was up 55 bps, the 6-month was down 17 bps. Essentially, the Fed’s 75 bps hike pushed the very short rates higher, whereas the market’s pricing of less aggressive hikes going forward led to the longer maturities subsiding from prior levels. Short-end markets remain volatile, thereby leading to some dynamic moves in rates both day-to-day and intraday, and this situation may persist while the Fed embraces a “data-dependent” posture regarding future hikes. As of this past Friday midday, the market priced for a 100% chance of a 50 bps hike at the Sept.21st FOMC, with ~25% chance of another 75 bps hike.
- Given the Fed’s tightening and data-dependent posture, rates will remain highly responsive to economic data and Fed-speak.
Term Rates
- The longer-term curve finished lower week-over-week, generally mirroring the move in UST and swaps markets. While the 2-year was ~10 bps lower, 5-year finished ~20 bps lower. Kindly refer to the previous section for further color on relevant market. The curve is extremely flat and even inverted at various points, thereby offering opportunities to extend in advance duration for minimal, if any (and, at some points, potentially less), coupon cost.
- On the UST term supply front, this upcoming week offers a reprieve from auctions. Market focus will return to data, particularly the jobs report. Please call the desk for information on market dynamics, rate levels, or products.
Product Alert: FHLBNY is pleased to announce enhancements to our Advance Rebate Program, which provides members an opportunity to receive a cash rebate when prepaying an eligible advance and rebooking a new advance within a 30-day period. Rebate-eligible advances now must have a minimum of 6-months (reduced from 1-year) remaining. Moreover, the potential cash rebate has been increased. This program can be suitable for those wishing to extend their liability duration and/or potentially improve net interest margin. Please call the Member Service Desk at (212) 441-6600 for more information.
Forward Start Advance (FSA): For members with upcoming borrowing or refunding plans, consider the FSA as a method to opportunistically “lock in” rates before advance settlement date. Please call the Member Service Desk at (212) 441-6600 for more information.
The Symmetrical Prepayment Advance Feature
With rates at or near multi-year lows, it is a compelling juncture to use the SPA feature on term advances. This feature allows member to capture, at prepayment, changes in the Fair Value of the advance which are favorable to the member. Contact us to discuss.
Looking for more information on the above topics? We’d love to speak with you!
Questions?
If you wish to receive the MSD Weekly Market Update in .pdf format (includes FHLBNY rate charts) or to discuss this content further, please email the MSD Team.