Member Services Desk
Weekly Market Update
This MSD Weekly Market Update reflects information for the week of February 7, 2022.
Economist Views
Click to expand the below image.
The January employment report was a major positive surprise. Hiring at the beginning of the New Year eclipsed Street expectations by a wide margin. Moreover, the uptick in the unemployment rate was deceiving and was the result of all but a fraction of the almost 1.4mn persons entering the labor force finding work. Not only were wage gains larger than projected but were also once again widely spread across private industries. Last month’s report will be taken as a sign that the Federal Reserve is further behind in removing monetary accommodation than is desirable and likely will prompt a growing chorus of market participants to call for a one-half percentage-point hike in the federal funds rate target range at the March 15-16 meeting. Whether that ultimately happens probably rests on market pricing giving policymakers an opening heading into that gathering.
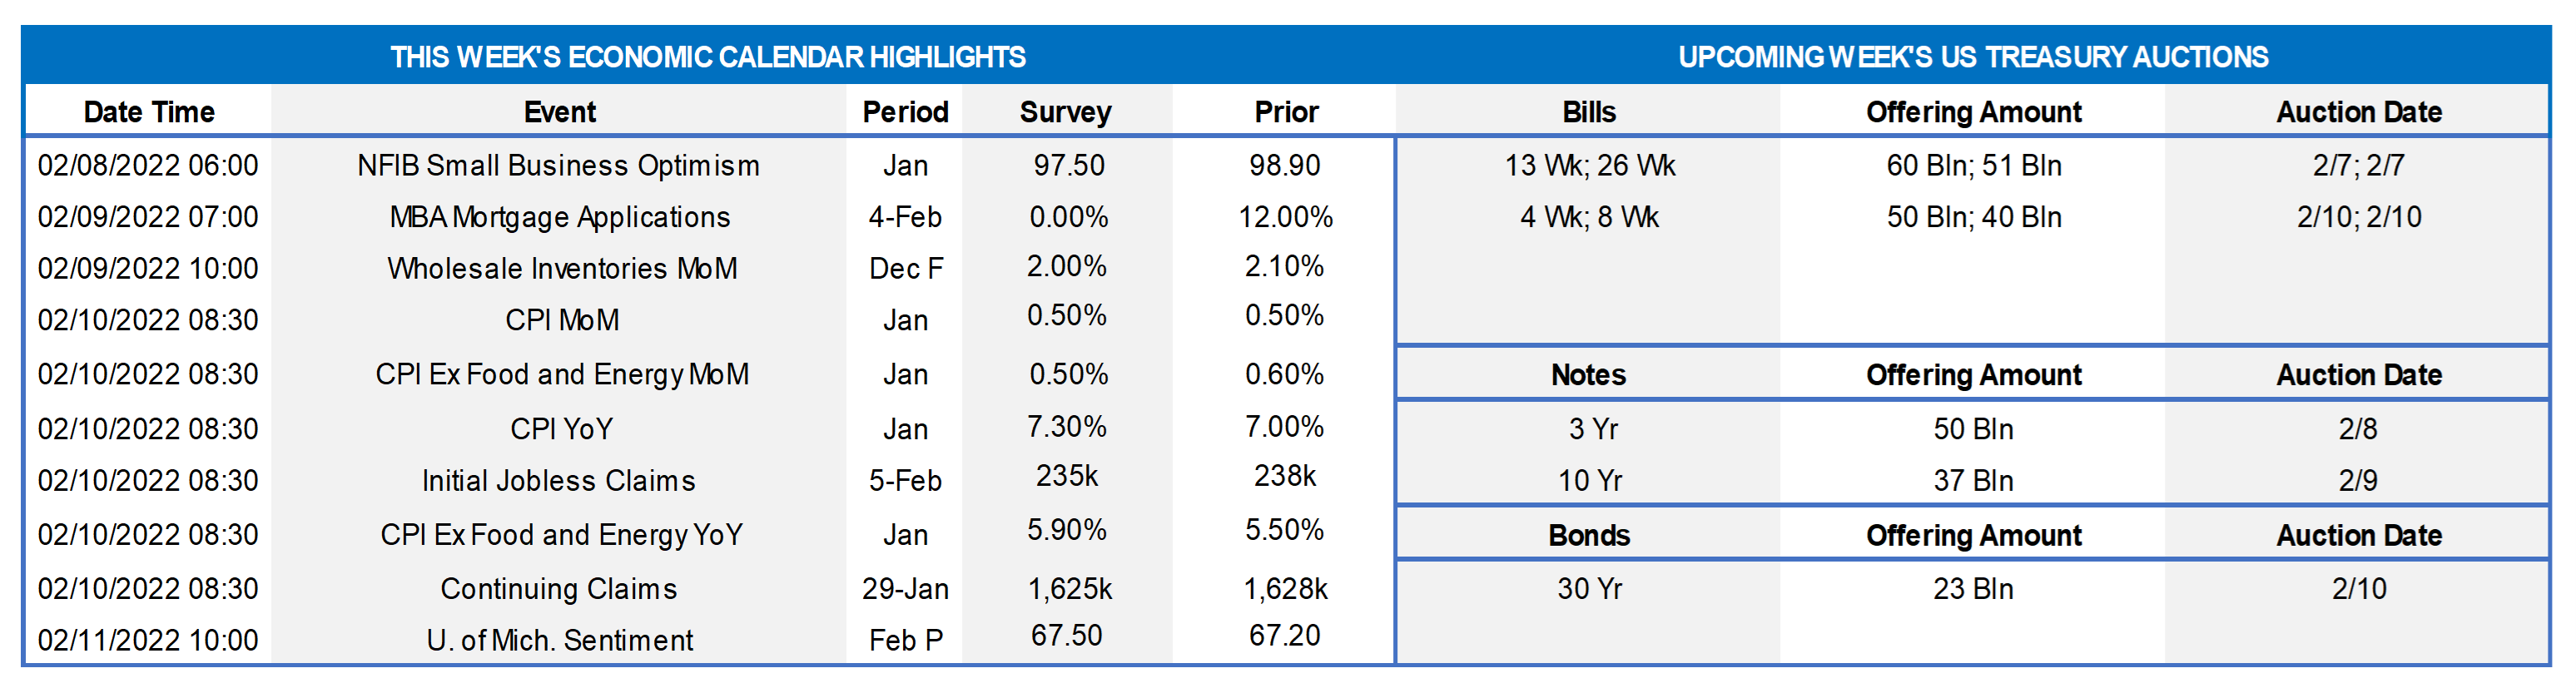
NFIB Small Business Optimism Index: Modest pullback in the labor market gauges in the National Federation of Independent Business’ monthly survey suggests that the Small Business Optimism Index retreated slightly from 98.9 in December.
Merchandise Trade Balance: The merchandise trade deficit is expected to have widened to a record $83bn in December from $81.2bn in the preceding month.
Jobless Claims: Initial and continuing state unemployment insurance claims likely moved lower in their respective reporting periods as the Nation weathers the Omicron variant outbreak.
Consumer Price Index: The Street expects the Consumer Price Index (CPI) to climb by .5% in January, matching the increase recorded in December. Smaller hikes in airline fares and motor vehicle costs probably capped the rise in the core CPI excluding volatile food and energy prices at .5% during the reference period, following a .6% year-end gain. Those forecasts, if realized, would place the overall and core CPIs 7.3% and 5.9% above their respective year-ago levels, both well above the Federal Reserve’s 2% target.
Michigan Consumer Sentiment Index: Consumer confidence likely was little changed from January’s 67.2 reading. Market participants will pay particular attention to inflation expectations in this week’s report. Last month’s canvass revealed that respondents anticipated a 4.9% rise in consumer prices over the year ahead, but a more moderate 3.1% pace over the next five to ten years.
Federal Reserve Appearances:
- Feb. 9 Federal Reserve Governor Michelle Bowman to speak to the Independent Community Bankers of America.
- Feb. 9 Cleveland Fed President Loretta Mester to give speech on economic and monetary policy outlooks.
Click to expand the below image.
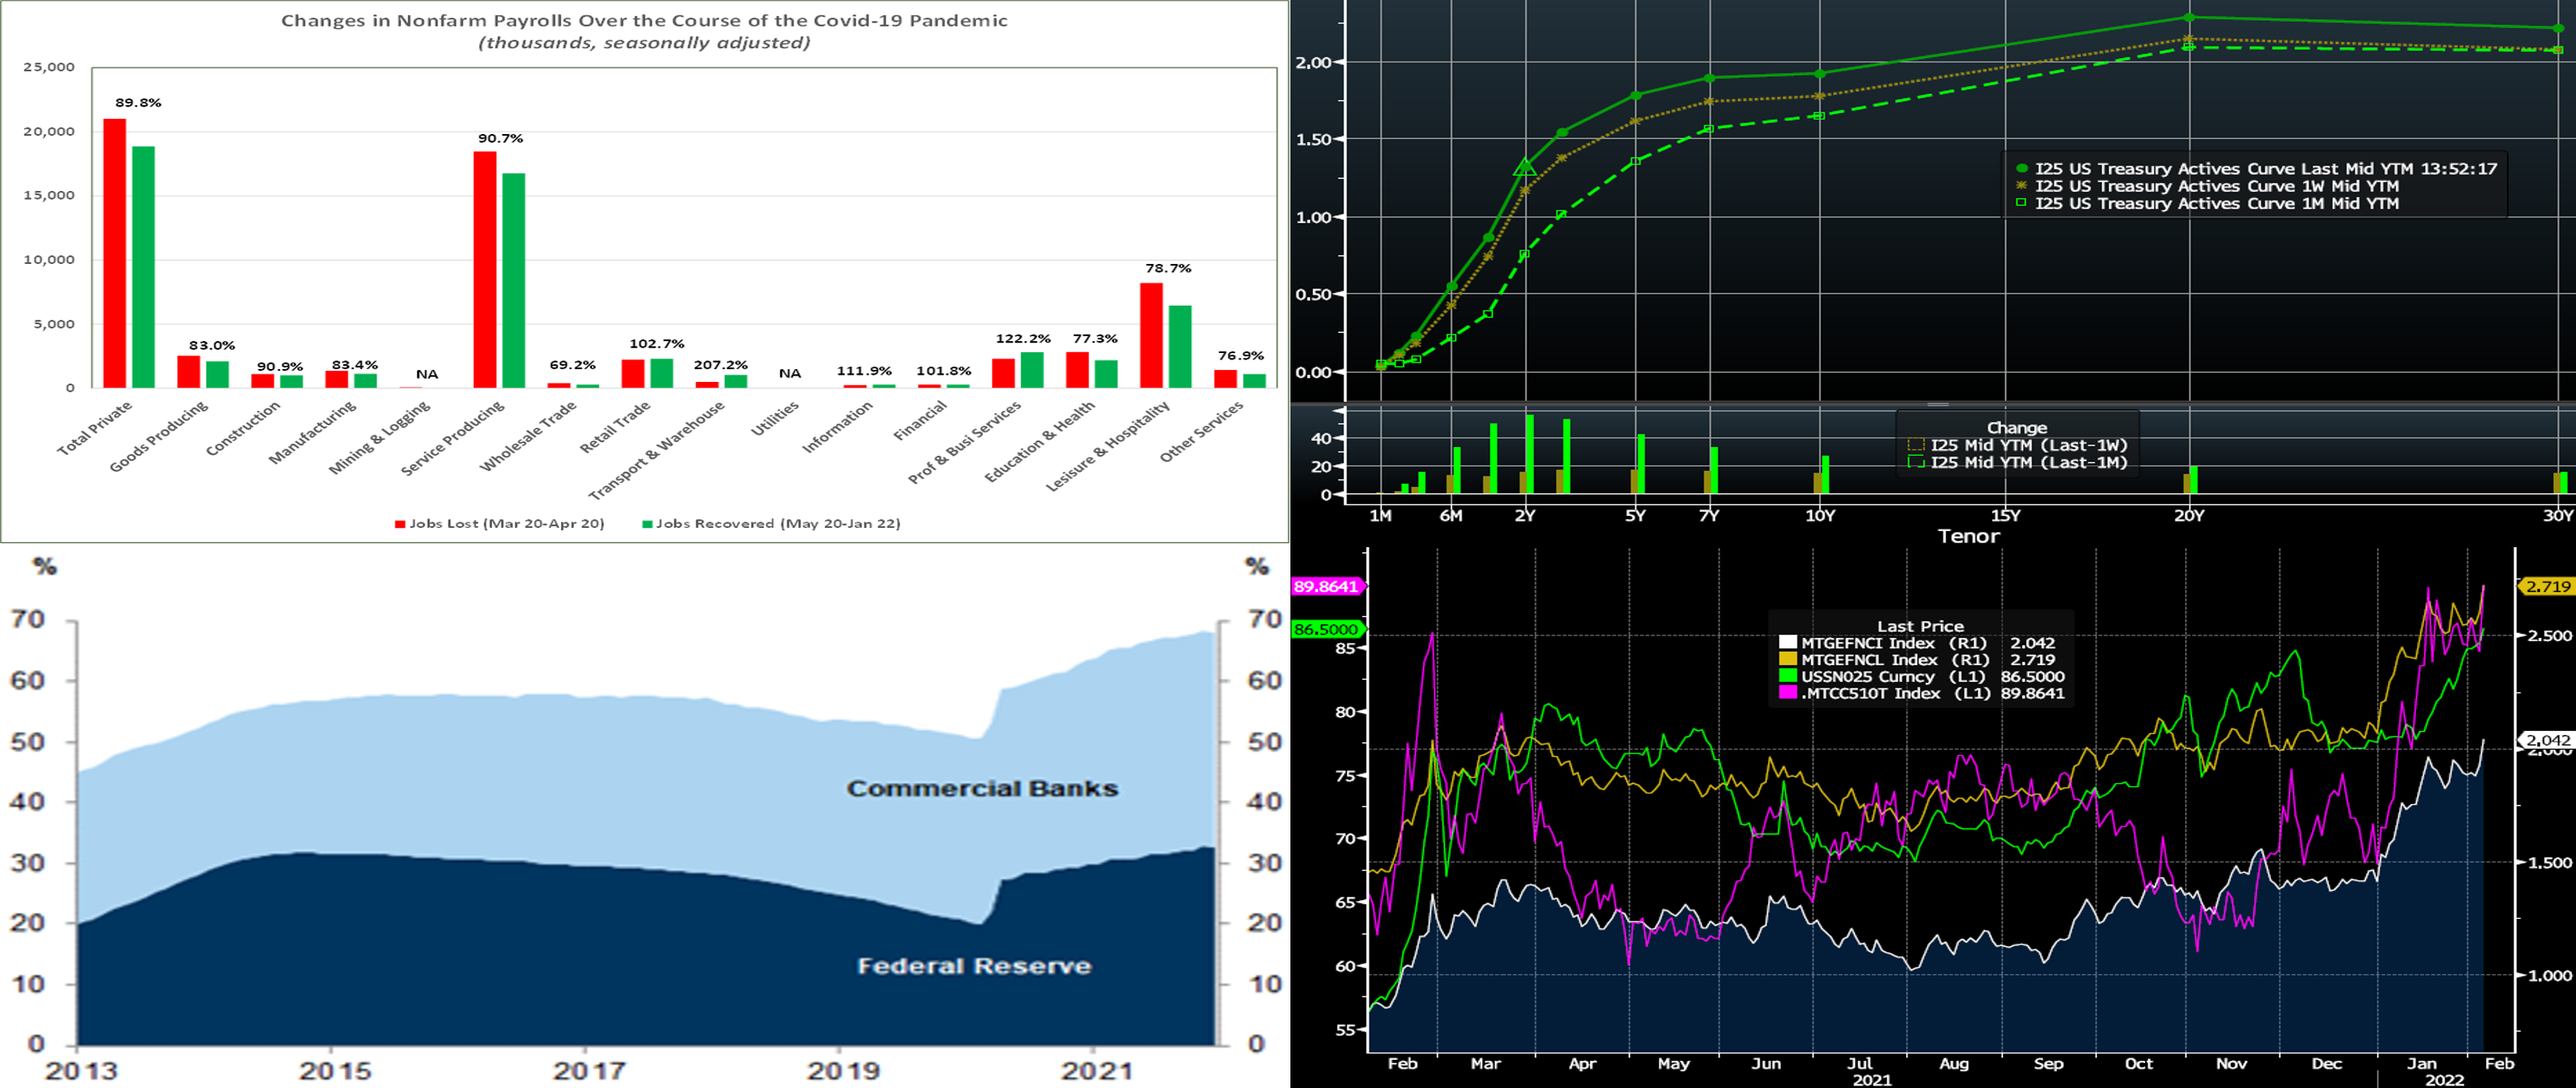
CHART 1 UPPER LEFT
Source: Bureau of Labor Statistics; FHLBNY. The BLS reported that nonfarm payrolls swelled by 467K in January, following upwardly revised increases of 510K (was 199K) in December and 647K (was 249K) in November. To date 19.1mn, or almost 87%, of the 22mn nonfarm jobs lost over the March-April 2020 span have been recovered. Indeed, headcounts in many private-service producing industries are currently well above their February 2020 levels.
CHART 2 UPPER RIGHT
Source: Bloomberg. Note: Top pane is yield (%), bottom pane is change (bps). As of midday Friday, the UST yield curve rose again, with the bulk of the move occurring on Friday post the strong jobs report. Yields were ~13 to 17 bps higher from the week prior, with the 3 to 7-year leading the rise. Yields remain notably higher than a month ago, in reaction to economic data and Fed-related dynamics. Volatility, both day-to-day and intraday, in markets has markedly risen in the past month. Members should monitor conditions for potentially more optimal entry points on funding or securities purchases. Market focus this upcoming week will likely focus on Thursday’s CPI report, given the current importance of the inflation topic and the Fed’s response to it. Market-based expectations now price for an over 40% chance of a 50 bps increase at the March 16 meeting, to be followed shortly thereafter with a subsequent 25 bps hike. The market now prices the equivalent of ~5.4 hikes of 25 bps for the year.
CHART 3 LOWER LEFT
Source: eMBS, Federal Reserve, Goldman Sachs Research. Inspired by a member question regarding the outlook for agency MBS from the past week’s FHLBNY-hosted webinar “What’s on Tap for Investments in 2022?” (for more information, please visit https://www.fhlbny.com/financial_intelligen/whats-on-tap-2022/), we explore a few conditions in this sector in the next two charts. Shown here is the share of outstanding agency MBS owned by the Federal Reserve and commercial banks. The Fed owns 33% of outstanding agency MBS, and so it is no wonder that market participants are concerned about the impact of the Fed’s tapering and ever-increasing odds of a soon-to-come runoff of their holdings. Essentially, a large source of demand for agency MBS will depart the market.
CHART 4 LOWER RIGHT
Source: Bloomberg. Here can be seen that many metrics of the agency MBS market have already priced in Fed tightening and tapering/runoff. The Current Coupon (computed yield on a par-priced security) of both 30-year (Gold, RHS, %) and 15-year (White, RHS, %) are well above levels of 2021. Given that MBS contains optionality, implied volatility plays a part in pricing. Shown here is the implied annual volatility (Green, LHS, bps) of a “2-year expiry into 5-year” swaption; it too is at a high for the past year. Consequently, mortgage spreads trade at the widest of the past year as well, reflected here by the 30-year’s spread (Purple, LHS, bps) to the average of the 5 and 10-year UST yield. For those with high cash levels and capacity to “layer cash to work”, these metrics reveal agency MBS to be at much more compelling levels than a few months ago. Granted and as a caveat, if the market prices even more aggressively on Fed action, then agency MBS yields and spreads could widen further. Nonetheless and especially since banks generally are not “total return, mark-to-market” investors, this sector may deserve to be on the investment radar.
FHLBNY Advance Rates Observations
Front-End Rates
- Short-end Advances are again higher from the prior week, as the market prices for Fed tightening and maturities cross into the timeframe of hikes. Net T-bill issuance has been positive in recent weeks, as Treasury aims to rebuild their TGA cash balances, a trend that somewhat impacts the short-end’s supply/demand dynamic. High cash levels persist in the short-end, as demand for the Fed’s RRP, which stands last at ~$1.64trn, remains strong. Money market fund AUM remains high, although falling by ~$17.4bn in the past week. However, with now over a 40% chance of a 50 bps hike priced into the curve for the mid-March FOMC meeting and then a 100% chance of a 25 bps hike for the May FOMC, investors demand higher yield for anything but the shortest paper. While 3-month was only 5 bps higher from a week prior, the 4 to 6-month sector, given that it crosses over the May FOMC meeting too, was 6 to 7 bps higher.
- To reiterate, as time ensues and maturities cross into or further past upcoming FOMC meetings, these maturities’ rates are likely to experience further upward drift.
Term Rates
- The advance rates curve generally mimicked the UST curve week-over-week and finished notably higher, with most of the move occurring on Friday. Levels rose by ~14 to 17 bps, with the 3 to 7-year zone leading the increases. Kindly refer to the previous section for further color on relevant market dynamics.
-
On the UST supply front, this week brings UST auctions of 3/10/30-year. Rates could be prone to a move on Thursday, depending on the surprise level in either direction of the CPI data release. Given market volatility, members should monitor conditions for potentially more optimal entry points on funding or securities purchases. Please call the desk for information on market dynamics, rate levels, or products.
FHLBNY is pleased to announce enhancements to our Advance Rebate Program, which provides members an opportunity to receive a cash rebate when prepaying an eligible advance and rebooking a new advance within a 30-day period. Rebate-eligible advances now must have a minimum of 6-months (reduced from 1-year) remaining. Moreover, the potential cash rebate has been increased. This program can be suitable for those wishing to extend their liability duration and/or potentially improve net interest margin. Please call the Member Service Desk at (212) 441-6600 for more information.
The Symmetrical Prepayment Advance Feature
For those anticipating term funding needs, and with rates on an uptrend, it can be an appropriate juncture to consider our Symmetrical-feature advance. This feature allows the member to capture, at prepayment, changes in the fair value of the advance which are favorable to the member. Please contact our Member Service Desk to discuss.
Looking for more information on the above topics? We’d love to speak with you!
Questions?
If you wish to receive the MSD Weekly Market Update in .pdf format (includes FHLBNY rate charts) or to discuss this content further, please email the MSD Team.