Member Services Desk
Weekly Market Update
This MSD Weekly Market Update reflects information for the week of October 31, 2022.
Economist Views
Click to expand the below image.
The Federal Open Market Committee (FOMC) meeting will be the marquee event of the week. Market participants currently price for yet another 75 bps hike in the target range of the federal funds rate to 3.75% to 4% with complete certainty. The post-meeting communiqué likely will note the rebound in real economic activity during the summer and acknowledge that labor market conditions are tight. The statement probably will also reiterate that prices remain elevated and that policymakers are highly attentive to inflation risks. The FOMC likely will repeat that future increases in the target range will be appropriate in coming months. On the data front, labor-market soundings are expected to be solid. Motor vehicle purchases probably began the fall quarter on a high note. On a down note, manufacturing activity likely dipped in October.
JOLTS Job Openings: A reported bounce-back in online help-wanted postings suggests that total job openings rebounded by 540K to 11.06mn in September, reversing almost half of August’s surprising dive. Given the 261K decline in civilian unemployment during the reference period, that result leave would leave the gap between available positions and the jobless at 4.84mn. Put another way, there likely were a little over 1.8 jobs available per unemployed person nationwide in September.
Construction Spending: Reflecting a projected dip in residential building activity, new construction put-in-place probably dipped by .5% in September, after a .7% decline in the previous month. If realized, this decline would leave construction spending over the July-September span 2.3% annualized below the Q2 average, following a solid 10.3% annualized gain during the spring.
ISM Manufacturing Activity Index: Nationwide manufacturing activity likely dipped for the first time since May 2020. District Federal Reserve Bank canvasses and other surveys suggest that the Purchasing Managers Index slipped to 49.5% in October from 50.9% in the preceding month.
Motor Vehicle Sales: Industry watchers expect sales to register at a six-month high seasonally adjusted annual rate of 14.2mn in October, up a solid 5.3% from September’s 13.5mn clip.
Jobless Claims: New claims for unemployment insurance benefits likely remained in a historically low 210-230K range during the week ended October 29. Pay focus to continuing claims in the upcoming report. The 55K rise to 1.44mn tallied during the period ended October 14 may have been an early indication that recently furloughed employees are having a harder time finding work.
Nonfarm Productivity & Costs: With the rise in real output expected to match the reported increase in total hours worked, nonfarm business sector productivity likely remained stable in Q3, after a 4.1% annualized decline during the spring. The growth of unit labor costs is expected to slow to 3.9% during the reference period, following a 10.2% leap in Q2.
Employment Situation Report: Recent soundings on initial and continuing jobless claims suggest that employment growth continued apace in October, with approximately 250-275K net new positions created. The performance of the state insured unemployment rate between survey periods points to no change in the national jobless rate from the half-century low of 3.5% posted in September. With the October canvass ending precisely on the 15th of the month, average hourly earnings likely climbed by an above-consensus .5%, placing last month’s nominal pay 4.9% above the $31.11 received by private workers a year ago.
Federal Reserve Appearances:
- Nov. 2 FOMC monetary policy decision
- Nov. 2 Federal Reserve Chair Jerome Powell to hold post-FOMC meeting press conference.
- Nov. 4 Boston Fed President Collins to discuss the outlook at an event hosted by the Brookings Institution
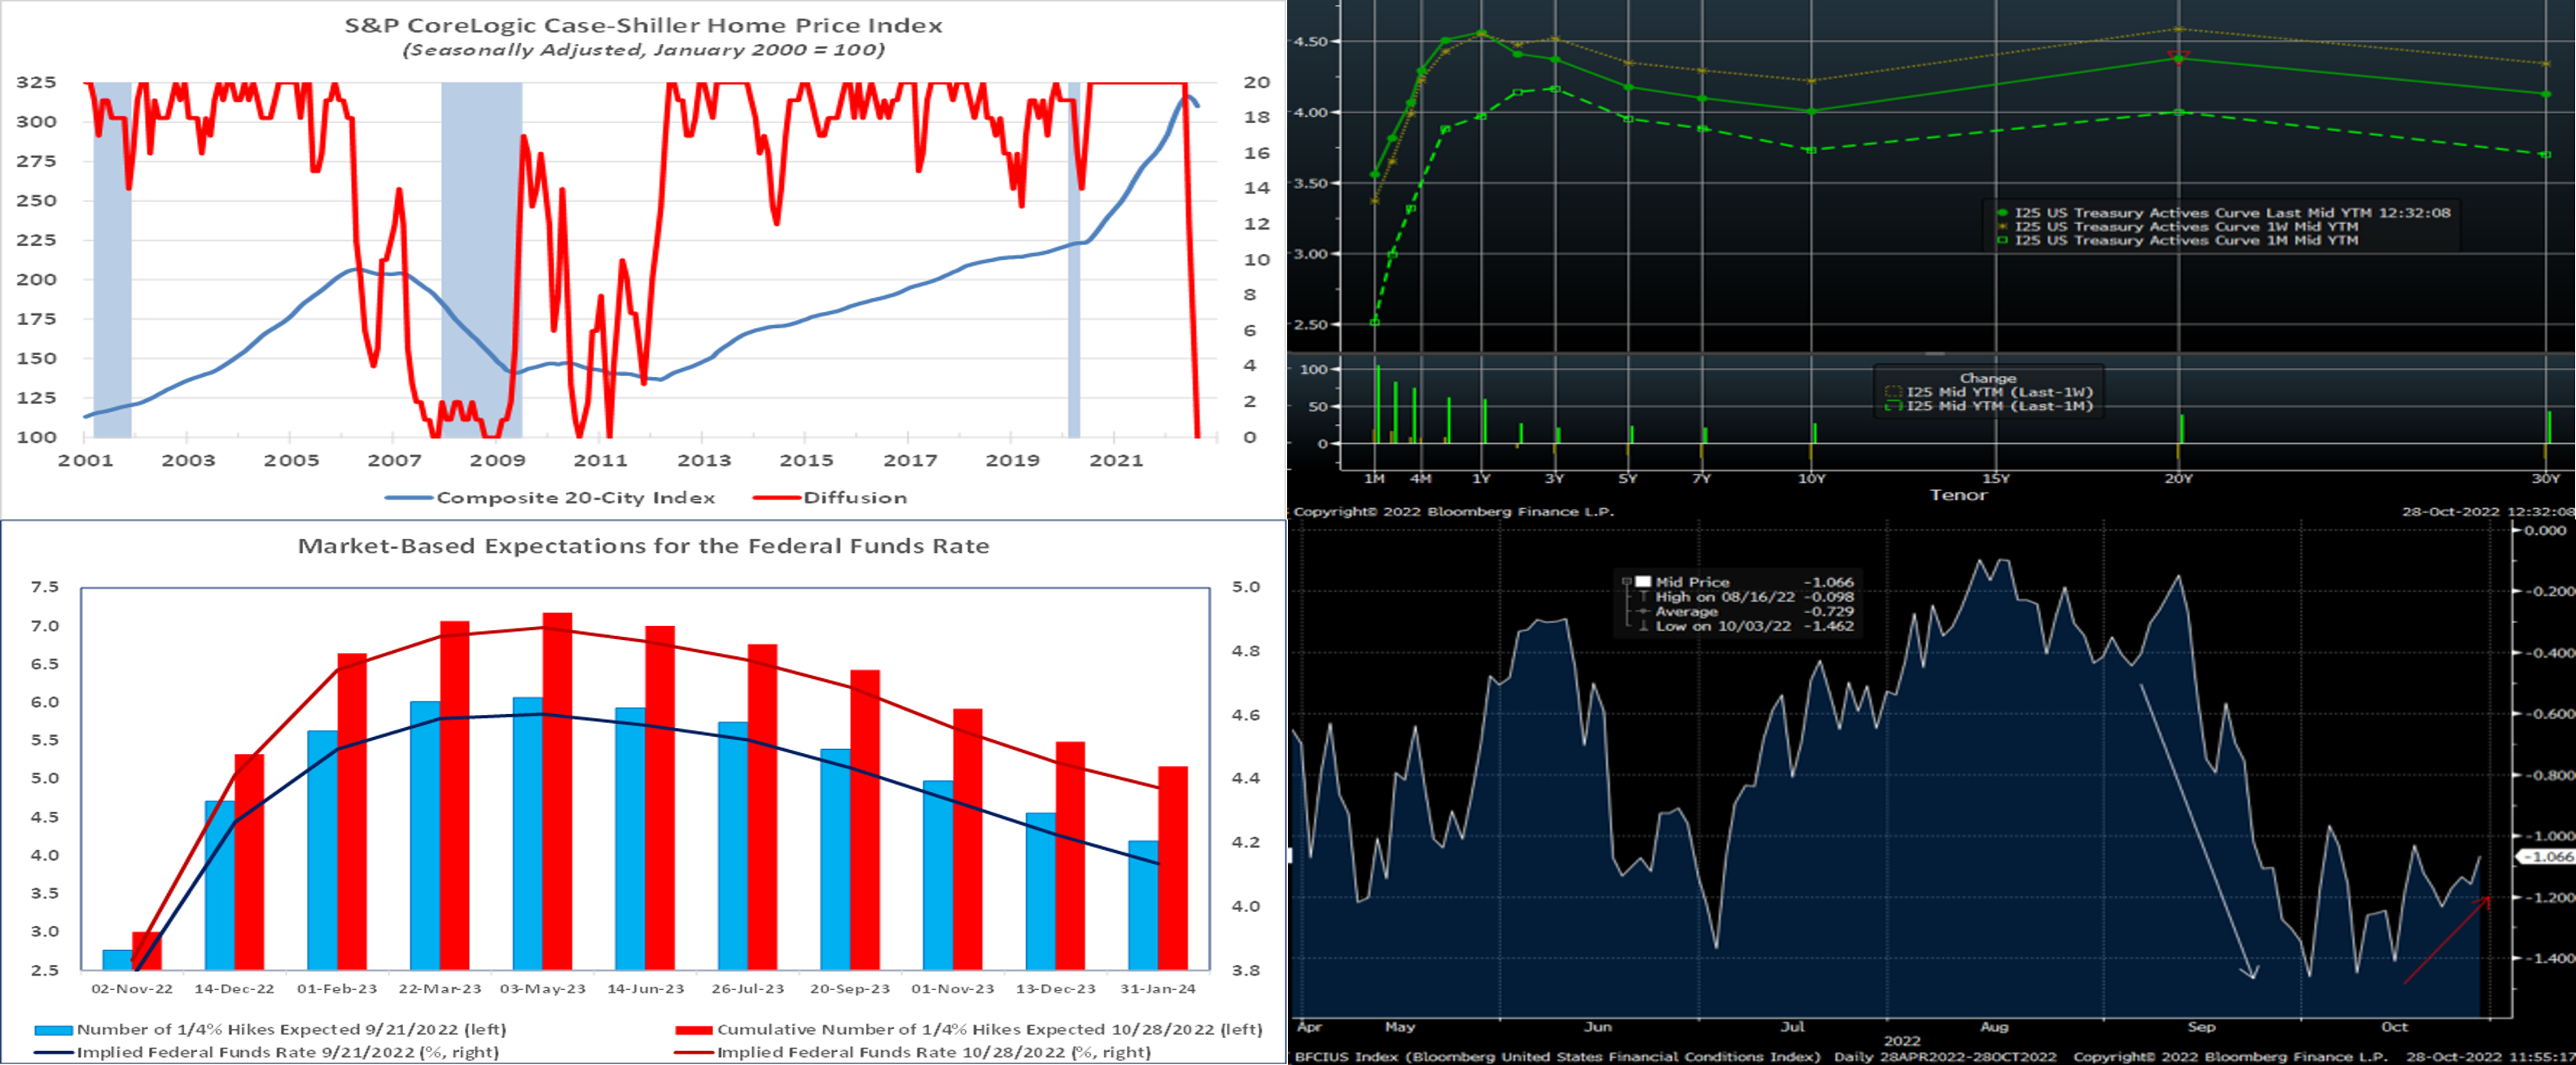
CHART 1 UPPER LEFT
Source: S&P CoreLogic Case-Shiller; National Bureau of Economic Research; FHLB-NY. In recent editions, we have placed focus on the housing sector, since this rate-sensitive sector has incurred clear impacts from the Fed’s tightening policy. Data this past week reflected that home prices are rolling over nationwide. The S&P CoreLogic Case-Shiller 20-City Home Price Index fell by 1.3% in August, after a downwardly revised .7% decline in July. Much weaker than the median Street call for a .8% drop , the latest reading and prior-month adjustments left home selling prices 13.1% above those of a year earlier. The breadth of sequential seasonally adjusted price declines was universal across the metropolitan areas canvassed – the first such occurrence since March 2011. Home prices in the New York City metropolitan area retreated by .4% during the reference period, remaining 12.4% above those posted in August 2021.
CHART 2 UPPER RIGHT
Source: Bloomberg. Note: Top pane is yield (%), bottom pane is change (bps). Except for very short yields which crossed further into the expected Fed-hiking timeline, UST yields, in a break from recent trend, finished lower week-on-week. The curve flattened, with 3-year down ~14 bps, 5-year down ~15 bps, and 10-year ~20 bps lower. “Fed-speak” was absent the past week, due to the Fed’s pre-FOMC “blackout” policy. Causal factors for the week’s move were somewhat difficult to pinpoint. The week included some weak housing data. The Bank of Canada delivered a less-than-expected 50 bps hike in their policy rate. Perhaps some in the markets believe the Fed is nearing the “deceleration zone” and that longer-term rates are thereby becoming more attractive investments. The highlight of the upcoming week will be the FOMC meeting. We continue to encourage members to engage with the desk for rate updates and product information, especially as our advance rates are influenced by and dynamically move with market rates.
CHART 3 LOWER LEFT
Source: Bloomberg; FHLB-NY. Here is an updated view of the market’s latest pricing of the anticipated fed funds rate vs. that at the time of the last FOMC. Clearly the overall hawkish tone from the Fed, in tandem with economic conditions and data generally reflecting on ongoing need for the Fed to address inflationary forces, have led the market to increase the number and pace of expected Fed hikes. As of midday Friday, the market priced for a 100% chance of a 75 bps hike at this week’s FOMC, with a 100% probability of a 50 bps and ~35% chance of another 75 bps hike at the December 14 FOMC. For 2022 cumulatively from now, the market prices for ~134 bps of hikes. The market prices for the rate to peak ~4.90% in May, followed thereafter by a potential Fed pivot to a softer policy stance.
CHART 4 LOWER RIGHT
Source: Bloomberg. Shown here is the past 6-month trend in the Bloomberg U.S. Financial Conditions Index. This index tracks the overall level of financial stress in the U.S. money, bond, and equity markets to help assess the availability and cost of credit. It contains measures and levels of stock prices, interest rates, credit spreads, and volatility. A positive value indicates accommodative financial conditions, while a negative value indicates tighter financial conditions relative to pre-Great Financial crisis (2008) norms; in essence, the index is a Z-Score that indicates the number of standard deviations by which current financial conditions deviate from normal levels. Clear from the chart is that conditions tightened markedly in September but have bounced up, down, and higher yet again in late October. Given the Fed’s aim to tighten conditions in order to quell inflationary forces, the latest upward move of this index should help cement a 75 bps hike at this week’s FOMC.
FHLBNY Advance Rates Observations
Front-End Rates
- Short-end rates again finished higher week-over-week, led by the 2-week to 2-month sector, as these maturity dates cross deeper into the anticipated Fed hikes on November 2 and December 14. As of this past Friday midday, the market priced for a 100% chance of a 75 bps hike at this week’s FOMC, with a 100% probability of a 50 bps and ~35% (slightly lower than last week’s 40%) chance of another 75 bps hike at the December 14 FOMC. For 2022 cumulatively from now, the market prices for ~134 bps (down just 1.5 bps from last week) of hikes.
- Given the Fed’s tightening and data-dependent posture, rates will remain highly responsive to the Fed and economic data. With the market fully anticipating a 75 bps hike this week, it should take a surprise move and/or a clear change in tone in the Fed’s statement to dramatically move markets.
Term Rates
- The longer-term curve finished lower and somewhat flatter from the week prior, generally mirroring the move in UST and swaps markets. While 2-year was ~9 bps lower, 5-year finished ~19 and 10-year ~20 bps lower. Kindly refer to the previous section for relevant market color. The advance curve remains inverted at various points, thereby offering opportunities to extend in advance duration for minimal or lower coupon cost. The flat curve and high implied volatility environment also can serve to make putable advances more compelling.
- On the UST term supply front, this upcoming offers a reprieve from auctions. Market focus will steer head-on to the FOMC and then Friday’s jobs report. Please call the desk for information on market dynamics, rate levels, or products.
Product Alert: FHLBNY is pleased to announce the reintroduction, after a temporary suspension owing to Libor-cessation, of the Putable Advance, Fixed-Rate with SOFR Cap Advance, and ARC with SOFR Cap/Floor Advance. The Callable Advance continues to be offered. This expansion of the product menu will provide members with more options and flexibility for the management of funding and/or hedging needs. Please call the Member Service Desk at (212) 441-6600 for more information.
Forward Start Advance (FSA): For members with upcoming borrowing or refunding plans, consider the FSA as a method to opportunistically “lock in” rates before advance settlement date. Please call the Member Service Desk at (212) 441-6600 for more information.
The Symmetrical Prepayment Advance Feature
For those anticipating term funding needs, and with rates on an uptrend, it can be an appropriate juncture to consider our SPA feature. This feature allows the member to capture, at prepayment, changes in the fair value of the advance which are favorable to the member. Contact Member Service Desk to discuss.
Looking for more information on the above topics? We’d love to speak with you!
Questions?
If you wish to receive the MSD Weekly Market Update in .pdf format (includes FHLBNY rate charts) or to discuss this content further, please email the MSD Team.