Member Services Desk
Weekly Market Update
This MSD Weekly Market Update reflects information for the week of September 7, 2020.
Economist Views
Click to expand the below image.
Returning from their Labor Day celebrations, market participants should enjoy a fairly quiet week. Observing the traditional blackout period before FOMC meetings (next meeting Sept. 16), Federal Reserve officials will not be making any appearances in public. The statistical calendar will be quite light as well. Labor market soundings are expected to improve, on balance, while consumer price inflation likely slowed after a surprising pickup in July.
NFIB Small Business Optimism Index: Stepped-up hiring plans, intended compensation hikes, and greater difficulty in finding qualified workers likely pushed the NFIB’s small business sentiment gauge above July’s 98.8 reading.
JOLTS Job Openings: A reported pickup in online jobs postings suggests that the Bureau of Labor Statistics’ (BLS) tally of available positions climbed to a four-month high of 6mn in July.
Weekly Jobless Claims: Both initial and continuing jobless claim counts likely were little changed from their respective prior-period tallies of 881K and 13.25mn.
Consumer Price Index: A broad-based deceleration in retail goods and services costs probably capped the rise of the Consumer Price Index (CPI) at 0.3% in August, following the surprising 0.6% jump recorded in July. The core CPI excluding volatile food and energy components is similarly expected to slow to 0.3% during the reference period, from 0.6% in the prior month. The projected increases, if realized, would place the overall and core CPIs 1.2% and 1.6% above their respective August 2019 readings.
Federal Reserve Appearances: None.
Click to expand the below images.
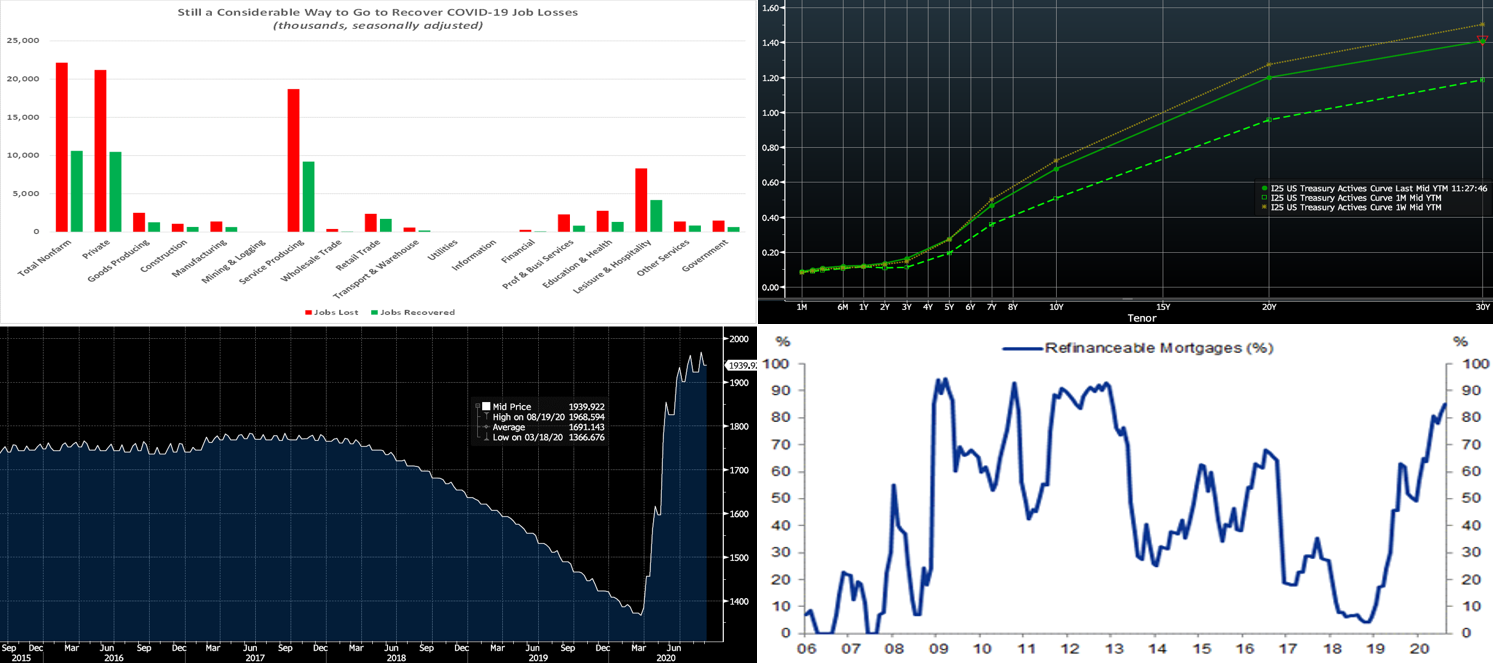
Source: FHLBNY; BLS. While encouraging, the 10.6mn jobs added over the past four months have recouped just 47.9% of the 22.2mn positions lost in response to the pandemic-induced shuttering of the economy. All industries have considerable ground to recover to return to their February headcount levels, but three of the hardest hit service-producing segments – retail trade, leisure & hospitality, and education & health – have made significant progress since April. Friday’s employment data was overall positive in portraying economic recovery, but jobless claims continue to trend at an elevated level while permanent job losses and duration of unemployment displayed worrisome increases.
CHART 2 – UPPER RIGHT
Source: Bloomberg. In yet another partial reversal of the prior week, the UST yield curve mildly “bull flattened” this past week. The main impetus to the move was Thursday’s slide in stock prices and a flight-to-quality; additionally, the popular and crowded “steepener” trades among market participants were rumored to be experiencing unwinds. However, yields retraced much of the flattening move post-Friday morning’s employment data, thereby leading to little change week-over-week. As has been the case in recent months, the Fed’s guidance and programs have served to pin the shorter (5-year and in) portion of the curve in a tight range, and so it has been the longer end of the curve leading any moves.
CHART 3 – LOWER LEFT
Source: Bloomberg. This past week Fed purchases of Agency MBS surpassed the $1trn mark since March. The Fed’s Agency MBS portfolio, portrayed here, sits near $1.4trn. The Fed now owns ~30% of outstanding Agency MBS. Naturally, this program has fueled lower mortgage rates and increased housing sector activity. The Fed’s current plans call for continued buying at a pace of $40bn per month, net of reinvestments.
CHART 4 – LOWER RIGHT
Source: eMBS; Goldman Sachs Global Investment Research. As a consequence of Fed purchase programs and mortgage rates near all-time low levels, over 80% of outstanding 30-year conventional mortgages have at least a 50bps incentive to refinance. Therefore, elevated levels of “refis” and prepayments can be expected near-term. Bank securities portfolios are, in turn, likely to experience cash inflows and re-allocation decisions.
FHLBNY Advance Rates Observations
Front-End Rates
Short-end Advance rates finished 1 to 2 bps higher week-over-week. Heavy T-bill issuance was a feature, as usual, but net supply has been slowing and thereby allowing for easier market absorption. Government-only (G.O.) funds experienced ~$38.8bn outflows on the week, somewhat sapping demand for paper. Vanguard’s announcement last week of the conversion of a Prime fund to G.O has spurred market chatter of a “Prime Fund exodus”. This move deserves attention; if more funds follow suit, the potential exists for increased demand for T-bills and Agency paper and some upward pressure on Libor, all else equal. However, it should be noted that the Prime Fund complex in aggregate currently maintains only about 55% allocation to credit and the rest in more liquid UST/Agency paper. Meanwhile, the supply of CD/CP may decline, depositories have an abundance of cash and do not need to issue in this space. Therefore, further conversions of Prime funds may not spur much rate impact.
Heavy T-Bill issuance will remain a theme; UST issuance overall is now net positive supply in that more is being issued than what the Fed is buying in its programs, and so this scenario could prove a small challenge. However, with short UST rates at rock-bottom levels, and the Fed likely on hold for a long period, rates may trade in a sideways pattern. Net T-bill issuance is forecast by Street dealers to notably slow in the months ahead, and Treasury has announced plans to shift issuance out the curve, but a new fiscal relief package may complicate/alter this forecast.
Term Rates
Medium and longer-term Advance rates were unchanged to 5 bps lower, week-over-week, in a mild “bull flattener” shift. While rates were mostly unchanged 5-year and in, they were a few bps lower in progressive fashion in the 6 to 10-year space. See the previous section for more context on the move.
The upcoming week brings 3/10/30-year UST auctions. Perhaps the “bear steepening” move on Friday morning was in anticipation of the supply onslaught, as dealers and traders began to adjust their positions. Moreover, corporate issuance should accelerate post-Labor Day in its usual pattern, and rate-locking could also have contributed to Friday’s move. Attention will remain on the prospects of further relief legislation and certainly also on COVID-19 and the question of whether or not it is being managed effectively enough to avoid any pauses in reopening. The week is relatively quiet in economic news.
The Symmetrical Prepayment Advance Feature
With rates at or near multi-year lows, it is a compelling juncture to use the SPA feature on term advances. This feature allows member to capture, at prepayment, changes in the Fair Value of the advance which are favorable to the member. Contact us to discuss.
Looking for more information on the above topics? We’d love to speak with you!
Questions?
If you wish to receive the MSD Weekly Market Update in .pdf format (includes FHLBNY rate charts) or to discuss this content further, please email the
MSD Team.
Special Member Alert
The FHLBNY recently announced a newly expanded and flexible Disaster Relief Funding (DRF) advance program which offers discounted rate advances with maturities 1-mo and greater. Additionally, we have announced that PPP loans will be accepted as eligible collateral. Please contact us with any questions.