Member Services Desk
Weekly Market Update
This MSD Weekly Market Update reflects information for the week ending July 28, 2023.
Economist Views
Click to expand the below image.
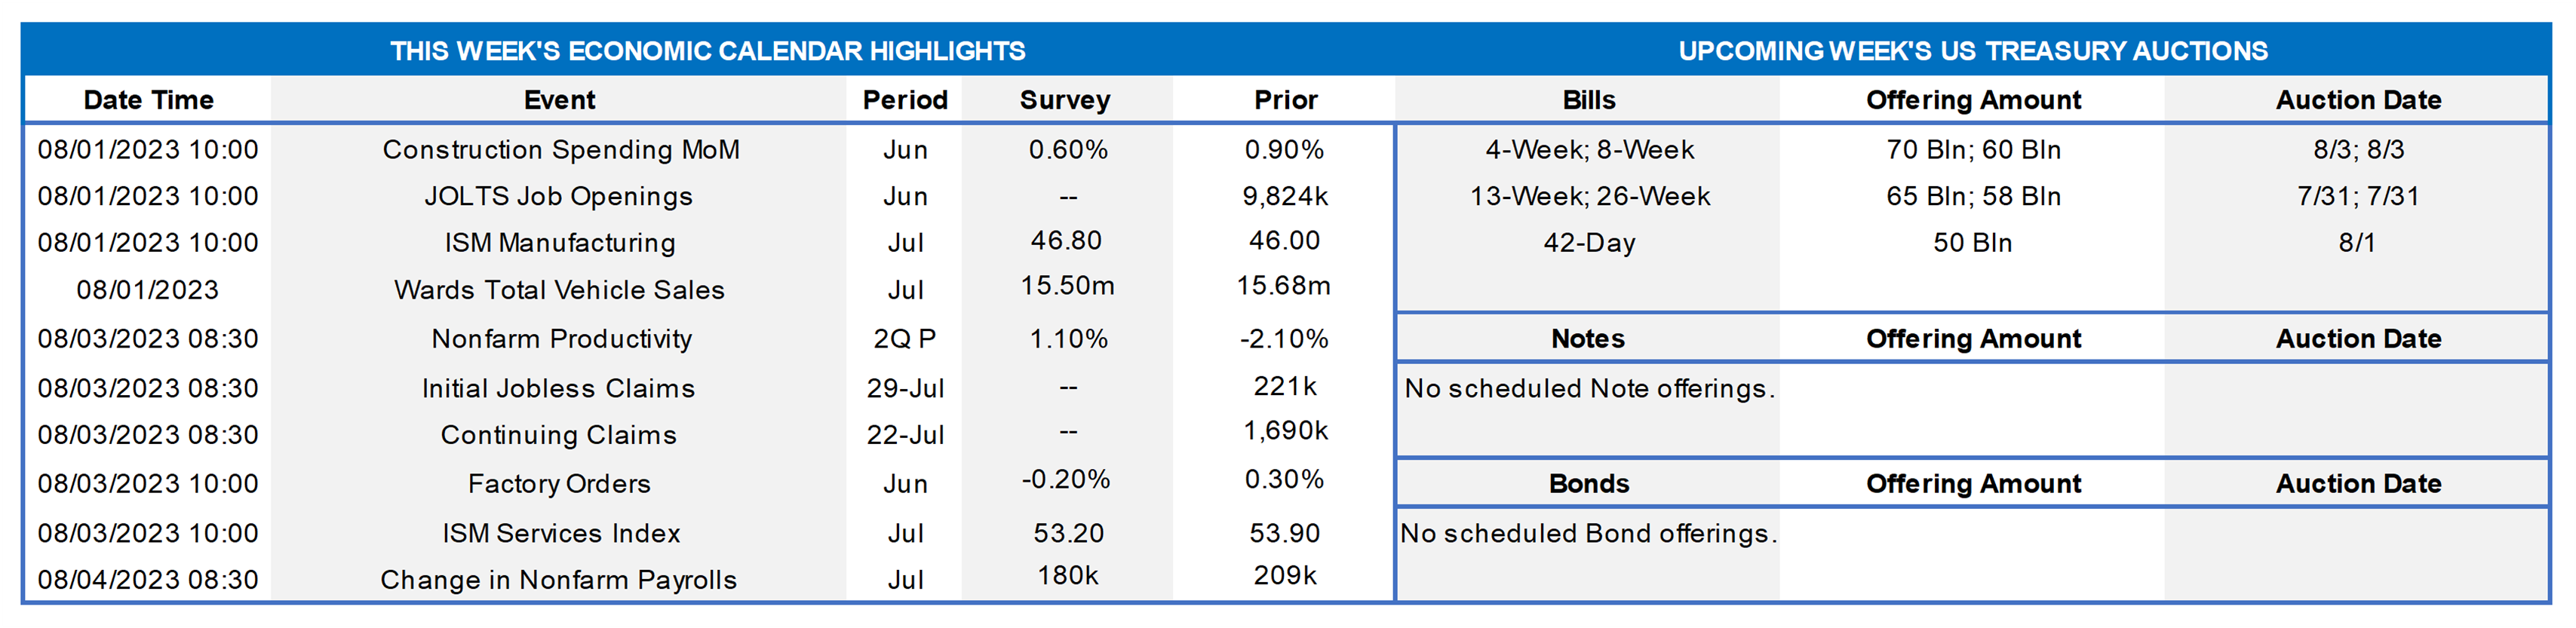
With the widely anticipated increase in the federal funds rate target range to 5¼% to 5½% in the rear-view mirror, the focus of market participants will return to the economic release calendar in the leadup to the Federal Open Market Committee’s next meeting. Importantly, policymakers will have two new sets of soundings on labor market conditions and consumer price inflation when they next convene on September 20. This week’s economic reports are expected to be universally positive. Purchasing manager surveys are expected to have improved in July, with the service-producing barometer climbing to a level reached last August. Motor vehicle sales likely remained strong as the summer quarter began. Job openings probably rebounded in June after a surprising May decline. The marquee report – the Bureau of Labor Statistics update on the employment situation in July – likely will reveal that net hiring quickened, with the civilian jobless rate edging lower.
Construction Spending: The nominal value of new construction put-in-place is expected to have risen by .6% in June, boosting the cumulative increase since the end of last year to 5.2%.
JOLTS Job Openings: A reported rise in online help-wanted postings suggests that nationwide job openings rebounded by 190K to 10mn in June, reversing a little over one-third of May’s surprising decline. At an estimated 4.06mn, the excess of vacant positions nationwide would represent 1.7 jobs per unemployed person.
ISM Manufacturing Activity Index: The contraction in nationwide manufacturing activity probably marked its ninth month in July. District Federal Reserve Bank canvasses and other surveys suggest that the Purchasing Managers Index edged one percentage point higher to 47%.
Motor Vehicle Sales: Solid demand for light trucks and passenger cars likely propelled unit motor vehicle sales to a three-month high seasonally adjusted annual rate of 15.8mn in July – 18.4% above the 13.35mn sold a year ago.
Nonfarm Productivity & Costs: Productivity in the nonfarm business sector probably expanded at an annualized clip of 1.8% during the spring quarter, erasing all but a fraction of the 2.1% contraction witnessed in Q1. That projection, if realized, would be consistent with a sharp deceleration in unit labor costs from 4.2% during the winter to 1.8% in Q2.
Factory Orders: Powered by an aircraft-led jump in durable goods bookings, factory orders probably rose by 2.0% in June, following an upwardly revised .4% increase in May.
ISM Service Activity Index: Available surveys suggest that service-producing activity quickened in July, lifting the gauge to an 11-month high of 57% from 53.9% in the preceding month.
Employment Situation Report: Labor market conditions probably remained extremely tight entering the summer quarter. Nonagricultural businesses likely added 275K net new workers in July, eclipsing the 209K gain witnessed in June. Weekly jobless claims reports and consumer-sentiment soundings suggest that the civilian unemployment rate retreated to 3.5% from 3.6% in the preceding month – just one tick above the half-century low posted in January. Buoyed by the establishment survey period ending precisely on the 15th of the month, average hourly earnings likely climbed by .5% during the reference period – the largest increase in 12 months. If realized, that result would place nominal compensation 4.4% above the $32.33 per hour received a year earlier.
Federal Reserve Appearances: No public appearances scheduled at this time.
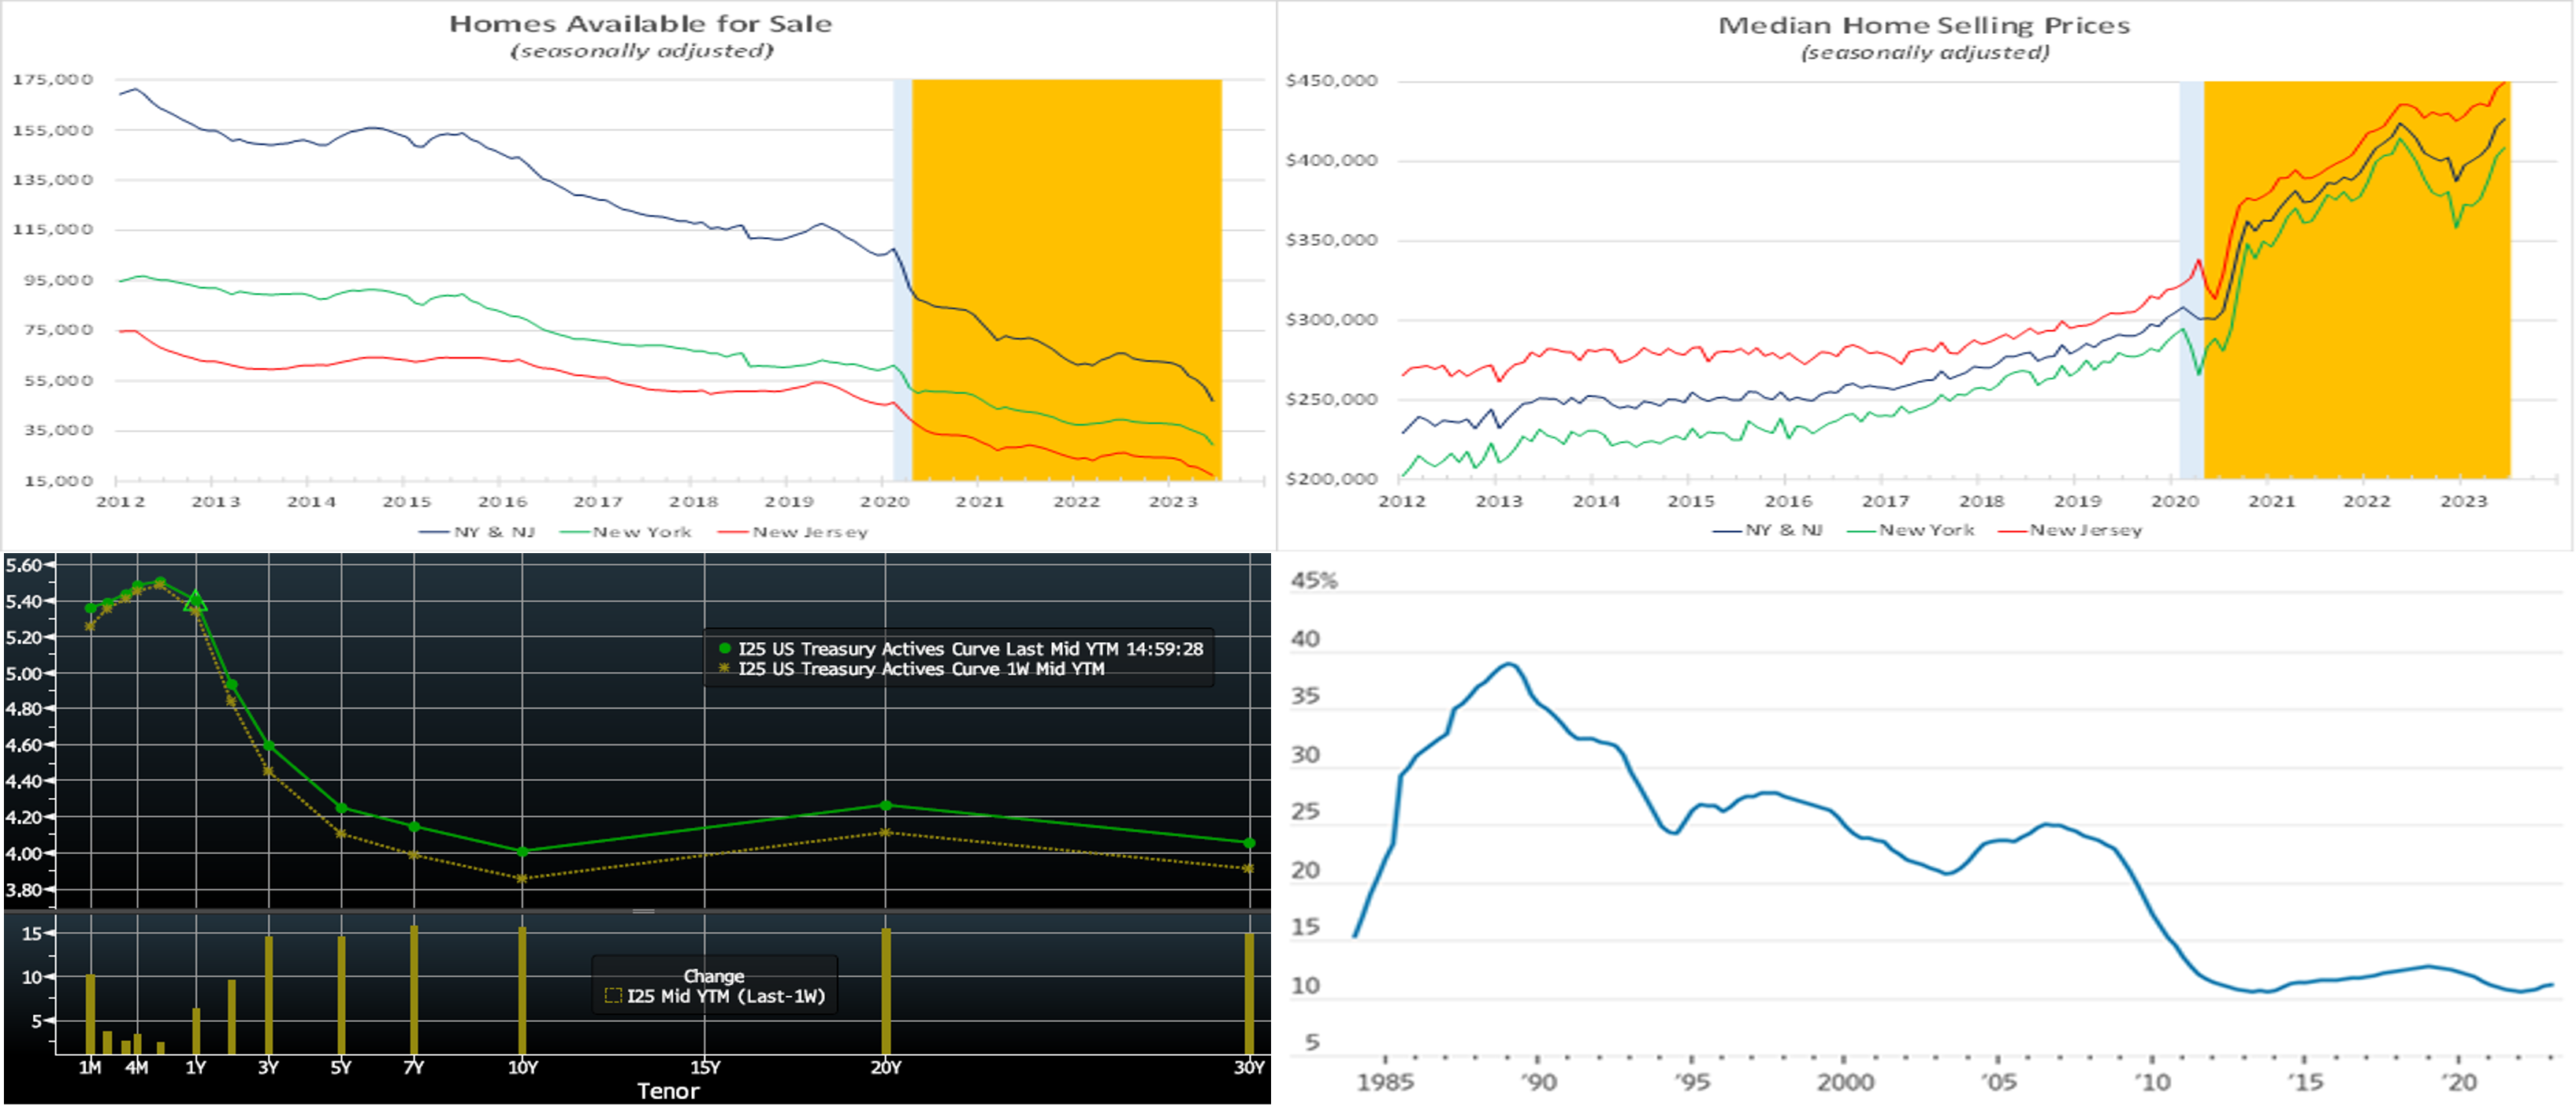
CHART 1 UPPER LEFT AND CHART 2 UPPER RIGHT
Source: NYSAR, NJ Realtors; FHLB-NY estimates. Notes: Blue-shaded areas denote recession; orange-shaded current economic expansion. Record low supplies of dwellings on the market continue to support home sale prices across New York State and New Jersey. Indeed, the number of homes available for sale across the two states dropped by 28.8% to just 46,950 over the 12 months ended June – less than half the 107,770 on the market before the economy entered the pandemic-induced recession in February 2020. Despite significantly higher mortgage interest rates, median home prices across the Empire and Garden States have rebounded sharply from recent lows witnessed at the end of 2022. Over the first half of this year, the median home price across the two states has jumped by 10.2%, or by roughly $39,420, to a record $426,735. As variously cited in previous editions, a significant factor in the low supply is the fact that huge numbers of homeowners carry well “in-the-money” (i.e., below current rates) mortgages and so are dissuaded from moving and thereby taking on higher costs.
CHART 3 LOWER LEFT
Source: Bloomberg. Top pane is yield (LHS, %), bottom pane is change (LHS, bps). From last Thursday afternoon to this one, yields pushed higher, with a good portion of the move occurring on Thursday. The 2 to 5-year sector (yields adjusted for the “roll” to freshly-issued “on-the-run” securities) was up nearly 15 bps week-over-week, with the rest of the curve higher by about the same. The FOMC was the main event of the week and was largely as expected, with a 25 bps hike. The Fed noted that it is “highly attentive to inflation risks” and that “inflation was elevated.” It also cited the need to be data-dependent on future moves but that no rate cuts were expected this year; the latter point led the market to further pare back pricing of cuts in late 2023 or early 2024. Meanwhile, economic data was mostly stronger-than-forecast during the week, thereby adding upward pressure to rates. In terms of market-implied pricing of the Fed, the 2023 peak Fed Funds rate in November now stands at ~5.43% from 5.38% two weeks ago. Essentially, the market is pricing a ~40% chance of one more 25 bp hike this year. The year-end forward is at ~5.40%, compared to 5.30% two weeks ago. The years 2024 and 2025 have been pushed higher, moreover, with the year-end 2024 forward at 4.21% compared to 3.67% two weeks ago. Please call the Member Services Desk for further information on market dynamics and/or products.
CHART 4 LOWER RIGHT
Source: Moody’s Analytics; WSJ. Above, we referenced the large cohort of mortgagees with below-market rates. Here is portrayed the share (LHS, %) of household debt that adjusts with changes in market rates; it has declined markedly in the more recent years. Consumers have locked in ultralow rates on debt such as mortgages and auto loans in the decade-plus post-2008 financial crisis. While rates on some loans, such as credit cards, are rising in response to Fed hikes, a large chunk of consumer debt, such as mortgages, carries the low rates of a few years ago. This dynamic has helped many consumers avoid drastic cuts in spending. As evidence, Thursday morning’s better-than-expected Q2 GDP report reflected sturdy consumer spending as a main contributor. Despite longstanding predictions of a recession from economists, the economy has chugged along, assisted by this dynamic. Indeed, Fed Chair Powell noted in the FOMC press conference that Fed staff currently no longer forecasts recession.
FHLBNY Advance Rates Observations
Front-End Rates
- Short-end rates were higher week-over-week, predominantly due to maturities crossing over and into the timeline of this past Wednesday’s widely expected 25 bps Fed hike. The 1-month-and-in tenors were up by 8 to 23 bps, with the shortest tenors leading the move. The 2-month-and-out sector was up 4 to 6 bps. Net T-bill supply remains robust but has been absorbed well thus far as Money Market Funds (MMFs) switch from the Fed’s RRP to T-bills with competitive yields. Moreover, FHLB supply continues to subside from peak levels of spring, further assisting T-bill interest from investors and thereby limiting upward pressure on rates from T-bill supply.
- Economic data, particularly Friday’s jobs report, should drive direction this upcoming week.
Term Rates
- The longer-term curve, mirroring the moves in USTs and swaps, pushed higher week-on-week. The 2 to 5-year rose by 18 to 23 bps, led by the shorter tenors. Longer tenors were up by 8 to 13 bps. The advance curve remains inverted out to 5-year, thereby offering opportunities to extend in advance duration at lower coupon cost. Kindly refer to the previous section for relevant market color.
- On the UST term supply front, the upcoming week serves a reprieve from auctions. Please contact the Member Services Desk for further information on market dynamics, rate levels, or products.
ZDA reminder: FHLB-NY recently launched the new 0% Development Advance (ZDA) Program providing members with subsidized funding in the form of interest rate credits to assist in originating loans or purchasing loans/investments that meet one of the eligibility criteria under the Business Development Advance, Climate Development Advance, Infrastructure Development Advance, or Tribal Development Advance. This program is intended to support economic development by incentivizing members to provide below-market-rate loans or invest in qualified initiatives. Reservation requests for the program have exceeded the currently available program amount; new requests will be added to the waitlist and filled if previously reserved funds become available. Please contact the Member Services Desk to learn more and/or visit the ZDA Overview page.
Forward Start Advance (FSA): For members with upcoming borrowing or refunding plans, consider the FSA as a method to opportunistically “lock in” rates before advance settlement date. Please contact the Member Services Desk at (212) 441-6600 for more information.
The Symmetrical Prepayment Advance Feature
For those anticipating term funding needs, and with rates on an uptrend, it can be an appropriate juncture to consider our SPA feature. This feature allows the member to capture, at prepayment, changes in the fair value of the advance which are favorable to the member. Contact Member Services Desk to discuss.
Looking for more information on the above topics? We’d love to speak with you!
Questions?
If you wish to receive the MSD Weekly Market Update in .pdf format (includes FHLBNY rate charts) or to discuss this content further, please email the MSD Team.