Member Services Desk
Weekly Market Update
This MSD Weekly Market Update reflects information for the week ending July 14, 2023.
Economist Views
Click to expand the below image.
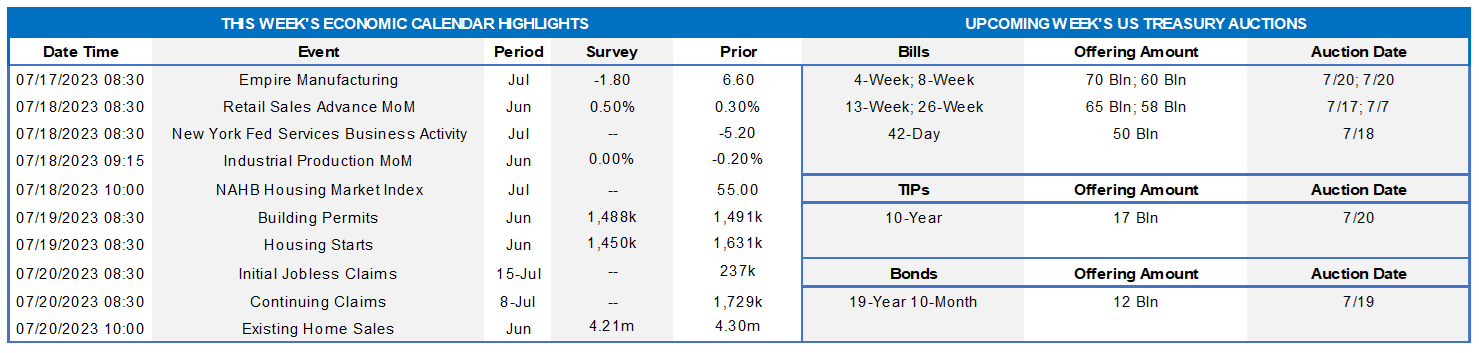
With monetary policymakers observing the traditional blackout period ahead of the FOMC meeting on July 25-26, the market focus will be squarely on economic releases. The median forecast for annualized real GDP growth during the spring quarter currently stands at ~1.5%, but the range of projections is exceptionally wide, extending from a .7% contraction to an above-trend 2.8% gain. This week’s reports on retail sales, industrial production, and housing starts in June will allow economists to fine-tune their projections for Q2 consumer spending, business equipment spending, and residential investment. Local business activity soundings are expected to be mixed this month, with service producers experiencing gains and manufacturing firms witnessing declines.
Empire State Manufacturing Survey: Manufacturing activity in New York State probably remained on a saw-toothed path in early July. The net percentage of survey respondents witnessing an expansion in general business activity is expected to move back into negative territory, following the surprising 6.6% reading recorded in June.
Retail & Food Services Sales: Buoyed by an anticipated pickup in auto-dealer revenues, this measure probably climbed by 1% in June – the largest gain since the 2.8% jump witnessed in January. Excluding the projected strength in auto sales, retail purchases are expected to have risen by .4% during the reference period, besting the modest .1% uptick posted in May. As always, strategists will pay attention to so-called “control” sales, excluding auto, building materials, and gasoline purchases in this week’s report for clues to the pace of consumer spending during Q2. Barring any prior-month revisions, the .4% rise projected by the Street would place core purchases over the April-June span 1.2% annualized above their January-March average, after a 5.2% annualized Q1 gain.
New York Fed Services Activity Survey: Service-producing activity across New York State, northern New Jersey and southwestern Connecticut probably expanded for the first time since last September in early July, pushing the current conditions index into positive territory after the -5.2% reading recorded in June.
Industrial Production & Capacity Utilization: Output at the Nation’s factories, mines and utilities is expected to have stabilized in June after a modest .2% dip in May. With additions to productive capacity expected to eclipse output during the reference period, the overall operating rate probably edged one tick lower to 79.5%.
NAHB Housing Market Index: Rosier appraisals of current and prospective sales, combined with an anticipated improvement in prospective buyer traffic, probably propelled the National Association of Home Builders’ sentiment gauge to a 13-month high of 57 in July from 55 in the previous month.
Housing Starts & Building Permits: Both the number of building permits issued and housing units started probably declined in June, following the weather-inflated seasonally adjusted annual rates of 1.5mn and 1.63mn, respectively, recorded in May.
Existing Home Sales: Home-purchase contract signings over the April-May span suggest that closings on existing dwellings slipped by 1.5% to a five-month low seasonally adjusted annual rate of 4.2mn in June. With the number of homes on the market expected to jump by 8.3% to 1.17mn on a not seasonally adjusted basis during the reference period, the months’ supply at the estimated sales pace would edge three ticks higher to 3.3 months.
Index of Leading Economic Indicators (LEI): The Conference Board’s augur of prospective economic activity is expected to have fallen by .6% in June, after a .7% decline in May. That projection, if realized, would mark the LEI’s 15th consecutive monthly decline.
Federal Reserve Appearances: None. Federal Reserve officials will be observing the traditional blackout period ahead of the July 25-26 FOMC meeting.
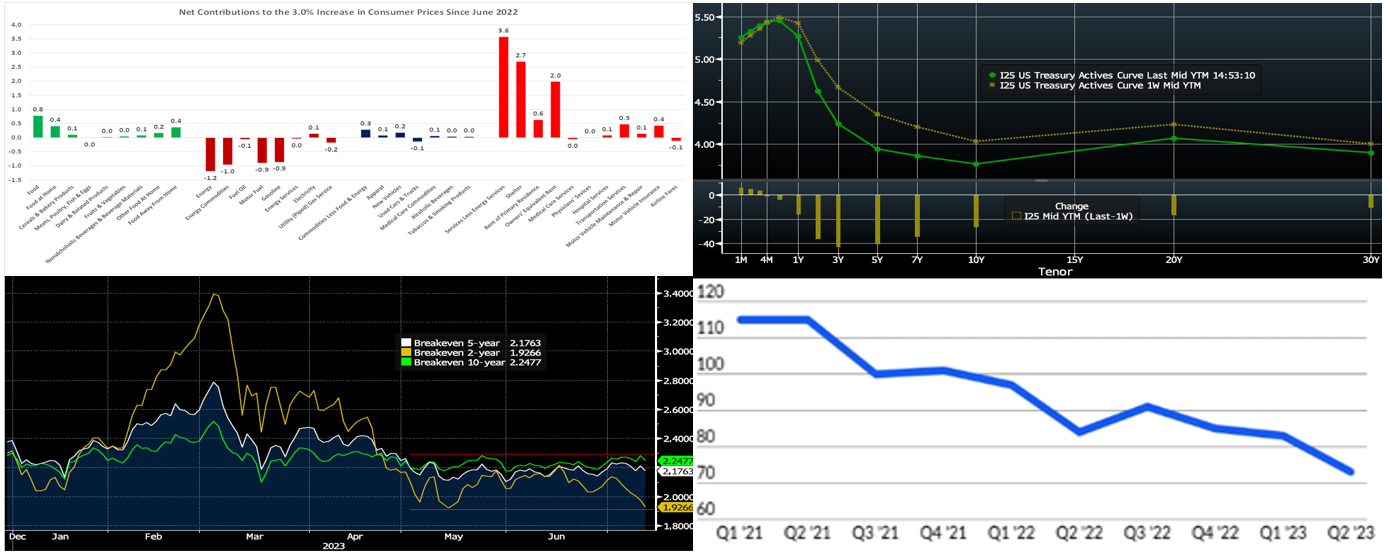
CHART 1 UPPER LEFT
Source: BLS; FHLBNY estimates. The Consumer Price Index (CPI) report for June revealed that the Fed is making significant progress in reining in inflation. The overall and core CPIs posted smaller-than-expected .2% increases last month. June’s increase placed the headline inflation gauge 3% above its June 2022 level – a stunning improvement from the 9.1% peak witnessed 12 months earlier. Food costs, which have been responsible for one-quarter of the rise in the CPI since June 2022, have moderated over the past four months. The rise in the CPI excluding volatile food and energy components – the smallest since August 2021 – shaved the year-to-year growth of the closely followed inflation gauge by one-half percentage point to 4.8%, down from the 6.6% high posted last September. Shelter costs, which account for 34.5% of the overall CPI and 43.4% of the core subindex, also slowed in June. Reduced costs for used autos, sharply lower airline fares, and stable prices for new autos, medical care services, and alcoholic beverages also contributed to the benign reading on core inflation last month. While year-to-year growth rates of consumer price gauges remain well above the FOMC’s desired 2% target, they are certainly moving in the right direction, thereby increasing the odds that the Fed might engineer the ever-elusive “soft landing” for the economy.
CHART 2 UPPER RIGHT
Source: Bloomberg. Top pane is yield (LHS, %), bottom pane is change (bps). From last Thursday afternoon to this one, and for the first time in weeks, UST term yields moved lower. The 2 to 7-year sector led the move, with the 3 and 5-year over 40 bps lower. The major instigator for the move was the lower-than-expected inflation data releases; in addition to the CPI cited above, Thursday’s release of PPI (Producer Price Index) also came in below expectations and thereby prompted another leg lower in yields. Consequently, the market reversed (pushed lower) some of its recent pricing of the Fed for later this year and 2024. In essence, the market now prices a greater chance of a “one last one and done”. As of this writing, the market still prices the odds of a 25 bps hike at the July 27th FOMC at ~91%. The 2023 peak funds rate stands at ~5.38% in November, or ~8 bps lower than last week. The year-end Fed Funds forward is ~5.30%, ~12 bps lower than a week ago. The market’s repricing was more pronounced out the curve in 2024-25; for instance, the year-end Fed Funds was ~4.25% last week and is now ~3.67%! Please call the Member Services Desk for further information on market dynamics and/or products.
CHART 3 LOWER LEFT
Source: Bloomberg. Staying with the inflation topic, shown here are the “breakeven” 2/5/10-year inflation rates (RHS, %) implied by TIPS (Treasury Inflation Protected Securities). These breakeven rates are derived by subtracting the TIPS’ yield from the yield of a corresponding maturity standard UST. As can be seen, in recent months, these breakeven rates have traded in a range nearer to the Fed’s oft-cited 2% inflation target. In this light, the market has expressed greater confidence that the Fed will achieve its goal of reining in inflationary forces.
CHART 4 LOWER RIGHT
Source: Conference of State Bank Supervisors; American Banker. Note: score above 100 is positive, and score below 100 is negative. The latest Community Bank Sentiment Index dropped 10 points from the prior quarter as executives expressed worry about profitability and economic conditions. Factors cited were rising deposit costs and expected weaker economic conditions that could hamper lending activity and/or credit quality. But the past week’s improving inflation data, along with a still-solid jobs market, could increase the probability of the usually elusive “soft-landing” for the economy and rate cycle. Perhaps this week’s better news will provide a boost to the glum sentiment in this index.
FHLBNY Advance Rates Observations
Front-End Rates
- Short-end rates were mixed to mostly higher from a week ago, with the 2-week to 2-month tenors up 3 to 6 bps. Maturities have crossed further into the timeline of the potential next Fed hike on either July 26 or September 20. Net T-bill supply remains robust as Treasury rebuilds its account post-debt ceiling agreement; however, it has been absorbed well thus far, as Money Market Funds (MMFs) switch from the Fed’s RRP to T-bills with competitive yields. Moreover, FHLB supply has subsided from peak levels of spring, further assisting T-bill interest from investors. These dynamics are conspiring to limit upward pressure on rates from the T-bill supply resurgence.
- With the Fed in blackout mode, economic data should be the prime driver of rates this upcoming week.
Term Rates
- The longer-term curve moved from 25 to 46 bps lower from last week, generally mirroring moves in USTs and swaps. The 2 to 5-year zone led the move, with the 3-year down ~46 bps. Kindly refer to the previous section for relevant market color. The advance curve remains inverted out to 5-year, thereby offering opportunities to extend in advance duration at lower coupon cost.
- On the UST term supply front, the upcoming week serves a 10-year TIPS and a 20-year nominal auction. With bank earnings set to begin, there also may be a surge of bond issuance thereafter which could make further declines in yields more difficult. Please contact the Member Services Desk for further information on market dynamics, rate levels, or products.
ZDA reminder: FHLB-NY recently launched the new 0% Development Advance (ZDA) Program providing members with subsidized funding in the form of interest rate credits to assist in originating loans or purchasing loans/investments that meet one of the eligibility criteria under the Business Development Advance, Climate Development Advance, Infrastructure Development Advance, or Tribal Development Advance. This program is intended to support economic development by incentivizing members to provide below-market-rate loans or invest in qualified initiatives. Reservation requests for the program have exceeded the currently available program amount; new requests will be added to the waitlist and filled if previously reserved funds become available. Please contact the Member Services Desk to learn more and/or visit the ZDA Overview page.
Forward Start Advance (FSA): For members with upcoming borrowing or refunding plans, consider the FSA as a method to opportunistically “lock in” rates before advance settlement date. Please contact the Member Services Desk at (212) 441-6600 for more information.
The Symmetrical Prepayment Advance Feature
For those anticipating term funding needs, and with rates on an uptrend, it can be an appropriate juncture to consider our SPA feature. This feature allows the member to capture, at prepayment, changes in the fair value of the advance which are favorable to the member. Contact Member Services Desk to discuss.
Looking for more information on the above topics? We’d love to speak with you!
Questions?
If you wish to receive the MSD Weekly Market Update in .pdf format (includes FHLBNY rate charts) or to discuss this content further, please email the MSD Team.