Member Services Desk
Weekly Market Update
This MSD Weekly Market Update reflects information for the week ending November 17, 2023.
Economist Views
Click to expand the below image.
The Weekly will return on Friday, December 1; we wish readers a Happy Thanksgiving!
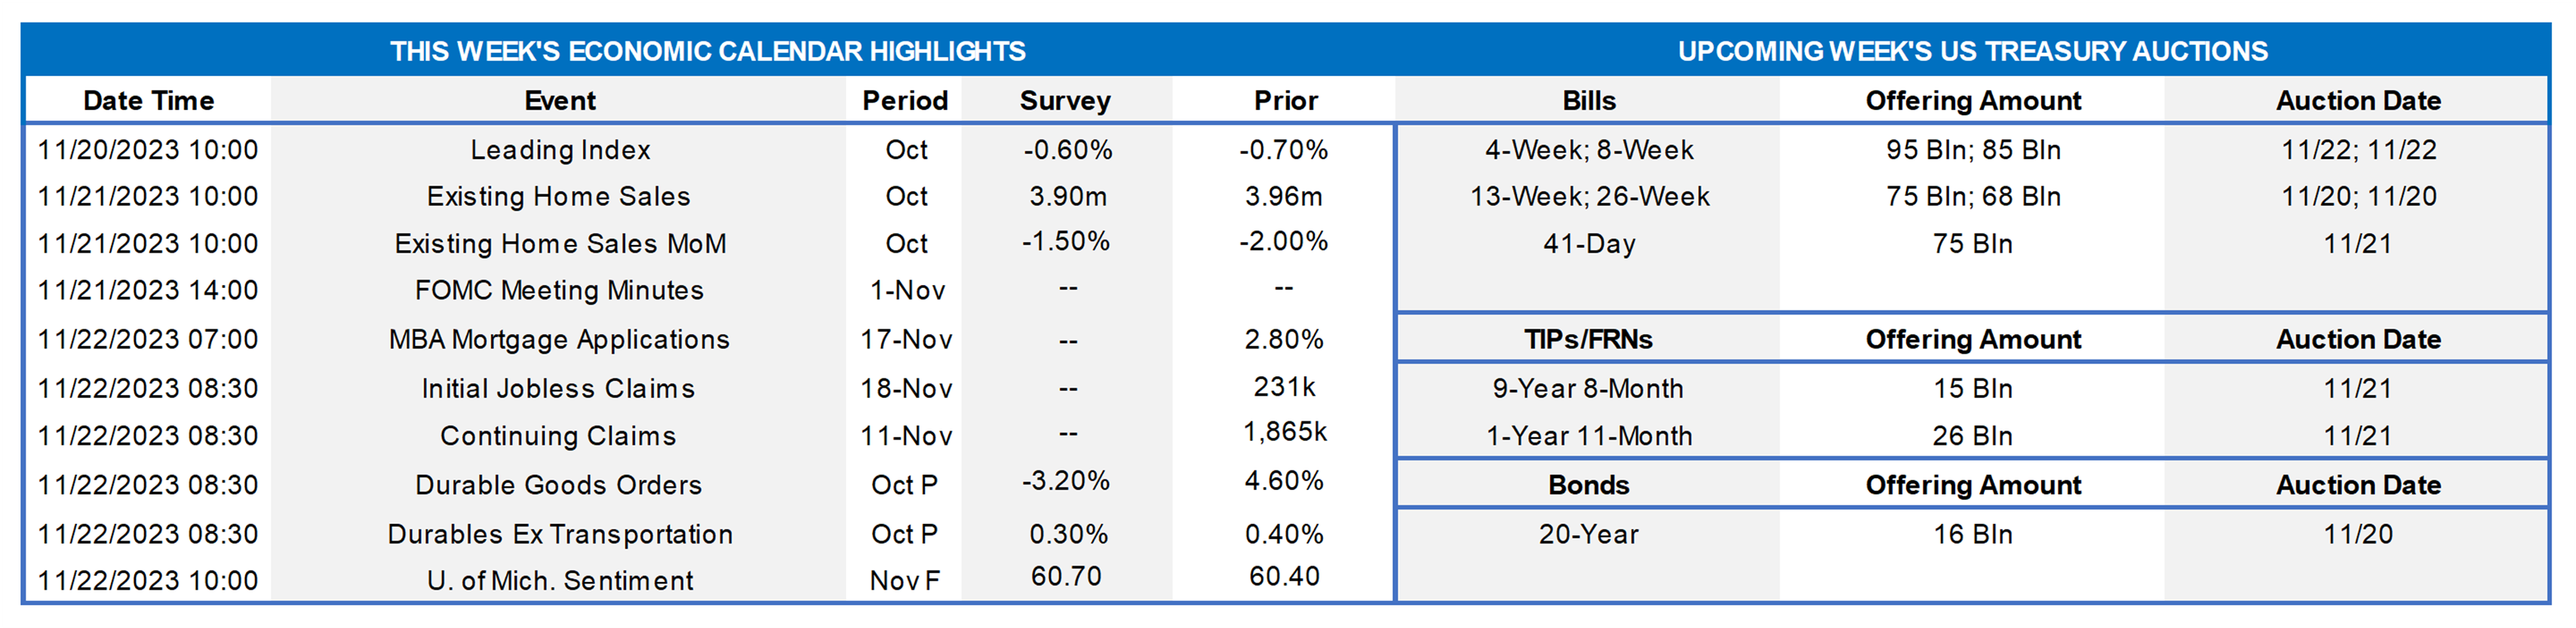
Market participants will face a comparatively quiet economic release calendar ahead of the annual Thanksgiving holiday. Existing home sales and nondefense capital equipment deliveries figures for October may prompt minor tweaks to economists’ Q4 real GDP growth tracking estimates, which currently appear centered near an annual rate of 2%. The weekly jobless claims report likely will show that the pace of layoffs was little changed in the latest filing period, but the recently unemployed are having a tougher time securing positions. The minutes from the recent Federal Open Market Committee (FOMC) meeting may provide useful color on policymakers’ thoughts on prospective rate changes.
Index of Leading Economic Indicators: Continuing a string of uninterrupted declines going back to April 2022, the Conference Board’s augur of prospective economic activity is expected to have fallen by .6% in October, almost matching the .7% decline witnessed in September. Despite its ongoing weakness, the Federal Reserve Bank of St. Louis placed the probability that the economy was contracting at the end of the summer quarter at just .14%.
Existing Homes Sales: A falloff in home-purchase contract signings over the August-September span suggests that closings on existing dwellings declined by 1.5% to 13-year low seasonally adjusted annual rate of 3.9mn in October. With the number of homes on the market expected to contract by .9% to 1.12mn on a not seasonally adjusted basis during the reference period, the supply at the estimated sales pace would remain unchanged at 3.4 months.
Durable Goods Orders: Pared by a near halving of commercial jet bookings, durable goods orders likely fell by 3.4% in October, erasing roughly three quarters of the prior-month 4.6% gain. As always, pay particular attention to core nondefense capital goods shipments excluding commercial aircraft deliveries for clues to the strength of business equipment spending at the beginning of Q4.
Jobless Claims: Initial claims for unemployment insurance benefits probably clocked in near the four-week moving average of 220K during the filing period ended November 18. Supporting the view that recently unemployed workers are having a more challenging time finding work, continuing claims likely climbed to a two-year high of 1.9mn during the week ended November 11.
Michigan Sentiment Index: Consumer confidence probably was little changed over the latter part of November, leaving the University of Michigan’s barometer near the 11-month low of 60.4 posted recorded in the preliminary canvass.
Federal Reserve Appearances:
Nov. 21 – Federal Reserve to release minutes from October 31-November 1 FOMC meeting.
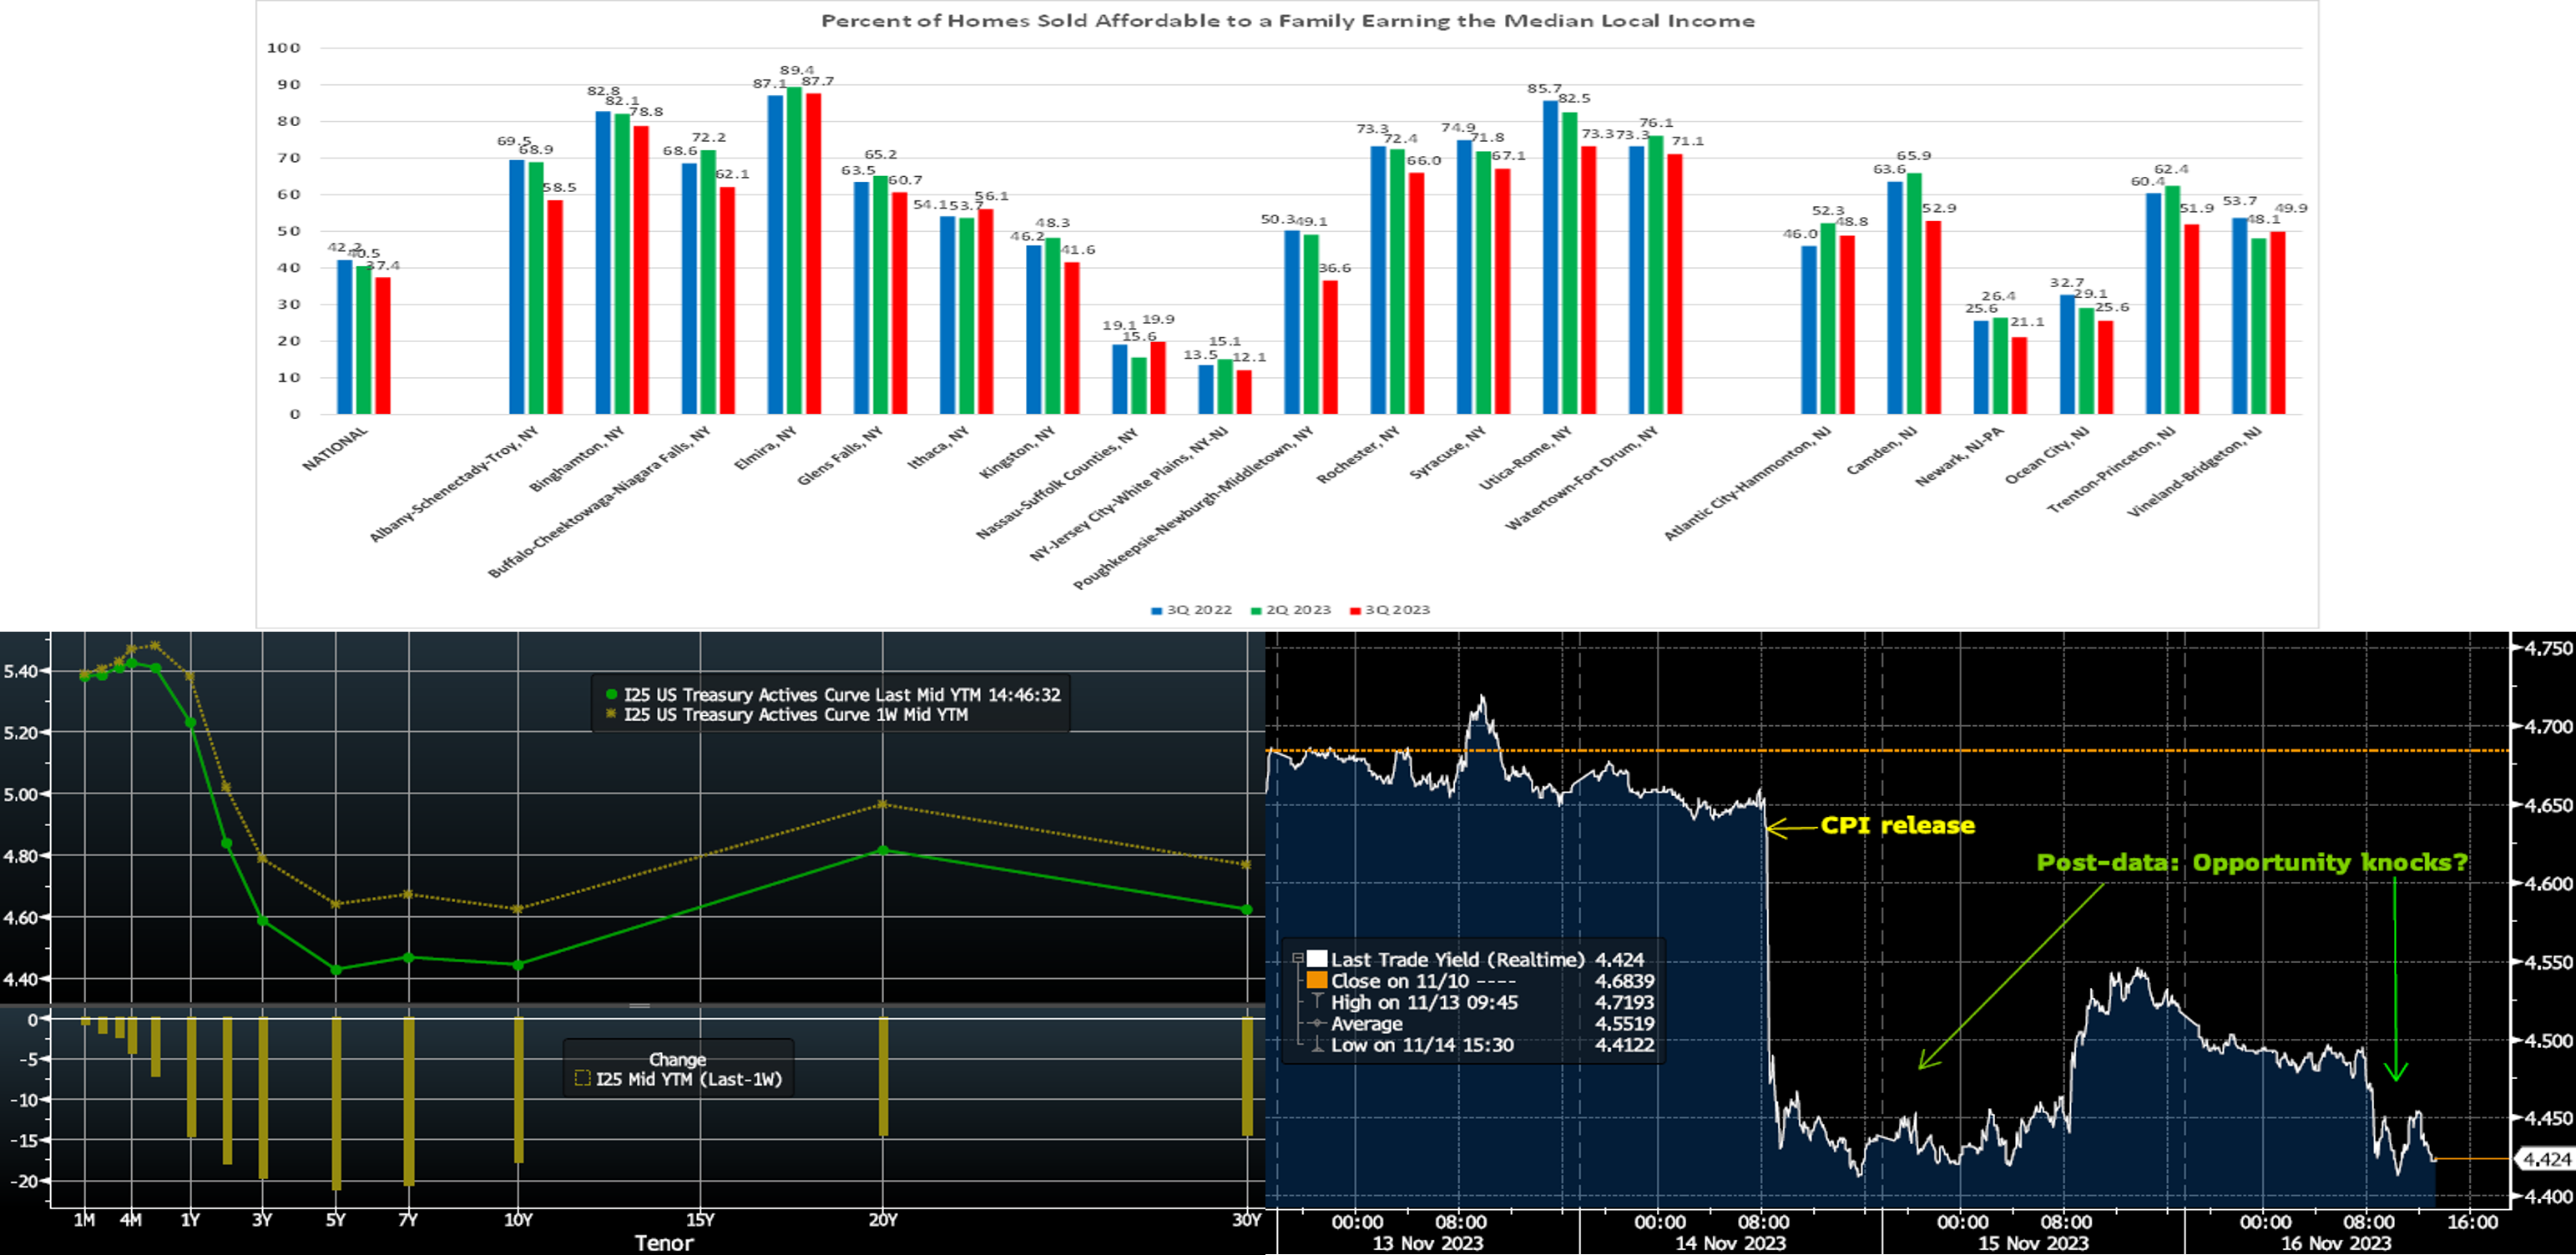
CHART 1 UPPER CENTER
Source: National Association of Home Builders/Wells Fargo; FHLB-NY. Housing opportunity deteriorated nationally and in the FHLB-NY district during the summer quarter. The NAHB/Wells Fargo Housing Opportunity Index (HOI) for a given area is defined as the share of homes sold over a period that would have been affordable to a family earning the local median income, based on standard mortgage underwriting criteria. There are just two components to the calculation – income and housing cost. In all, a record low 37.4% of new and existing homes sold between the beginning of July and end of September were affordable to families earning the U.S. median income of $96,300. This is down from the 40.5% posted during the spring and 42.2% over Q3 2022. Housing opportunity worsened across all but three of the canvassed segments of the FHLB-NY coverage area during the reference period, with the average HOI falling by 5.2 percentage points to 52.1% versus 57.2% during the summer of 2022. Opportunity in our district during Q3 ranged from a high of 87.7% in Elmira, NY to a low of just 12.1% across the NY-Jersey City-White Plains, NY-NJ metropolitan statistical area.
CHART 2 LOWER LEFT
Source: Bloomberg. Top pane is yield (LHS, %), bottom pane is change (LHS, bps). From last Thursday afternoon to this one, the UST curve moved notably lower, led by the 3 to 7-year sector; the 5-year was ~23 bps lower week-on-week. A few “soft-landing” data points spurred the move. The lower-than-expected CPI was the highlight, followed by softer PPI on Wednesday and then slightly higher jobless claims. Moreover, consumer spending data reflected a decelerating pace. “Fedspeak” veered to the hawkish side, in an apparent effort to counteract the loosening of financial conditions caused by lower yields and higher stocks over the past two weeks. At this juncture, further yield moves to the downside may require another dose of friendly data. In terms of market-implied pricing of the Fed, the chance of another hike has been almost fully priced out. Meanwhile, cuts have been priced into the curve for mid-2024, with ~80% probability of a 25 bps cut in May. The year-end 2024 forward is ~20 bps lower week-on-week, now ~4.345%. The recent decline in longer term rates should offer some welcome relief to mortgage applicants and fixed income asset portfolios, including bank AOCI ledgers.
CHART 3 LOWER RIGHT
Source: Bloomberg. Here is a view, in 5-minute intervals, of the UST 5-year yield (RHS, %) over the last few days. It amplifies the importance and potential impact of economic data; hence, our reason to provide a weekly calendar and insights. Also clear here are the potential opportunities for more optimal transaction execution. For instance, Tuesday morning clearly offered a more optimal juncture to procure term funding or enter a pay-fixed swap, as the 5-year yield swiftly fell by ~23 bps post the Consumer Price report (CPI) release. As a reminder, we are “up-and-running” to provide term advances each morning well before the Daily Rate Sheet hits your inbox. Also note that Advances can be settled for a Forward Start date (1-year maximum Forward Start); for instance, an Advance can be priced and executed today but settle a few days later. The Forward Start Advance (“FSA”) can be a useful tool for taking advantage of market rate moves. Simply call the Member Services Desk to get live rate and market updates.
FHLBNY Advance Rates Observations
Front-End Rates
- Short-end rates were 1 to 3 bps lower week-over-week. Helping the decline was improved issuance levels and the market pricing Fed expectations a tad lower. Net T-bill supply remains positive, given announcements from the Treasury regarding upsized auctions and issuance needs. But the supply continues to be absorbed relatively well, as Money Market Funds (MMFs) switch from the Fed’s RRP to T-bills with competitive yields. Moreover, MMFs currently stand near all-time high AUM levels.
- Economic data, albeit on the light side, will likely be the main event this upcoming holiday week.
Term Rates
- The longer-term curve, generally mirroring the moves in USTs and swaps, was notably lower and led by the 2- to-10-year zone. The 5-year was ~23 bps lower week-on-week.
- On the UST term supply front, the upcoming week serves a 20-year nominal and a 10-year TIPS auction. Note that UST auctions usually occur at 1pm and can occasionally cause volatility around that time. Please contact the desk for further information on market dynamics, rate levels, or products.
Grant funding under the FHLBNY 2023 Small Business Recovery Grant (SBRG) Program has begun and some funds are still available. The SBRG Program provides grant funds to benefit FHLB-NY members’ small business and non-profit customers. Please visit the SBRG webpage.
Price Incentives for Advances Executed Before Noon: In effect as of Tuesday, September 5, 2023, the FHLBNY is pleased to now offer price incentives for advances executed before Noon each business day. These pricing incentives offer an opportunity to provide economic value to our members, while improving cash and liquidity management for the FHLBNY. For further details, kindly refer to the Bulletin.
The Symmetrical Prepayment Advance (SPA) Feature
For those anticipating longer-term funding needs, it is always sensible to consider our SPA feature. This feature allows the member to capture, at prepayment, changes in the fair value of the advance which are favorable to the member. Contact the Member Services Desk to discuss.
Looking for more information on the above topics? We’d love to speak with you!
Questions?
If you wish to receive the MSD Weekly Market Update in .pdf format (includes FHLBNY rate charts) or to discuss this content further, please email the MSD Team.