Member Services Desk
Weekly Market Update
Economist Views
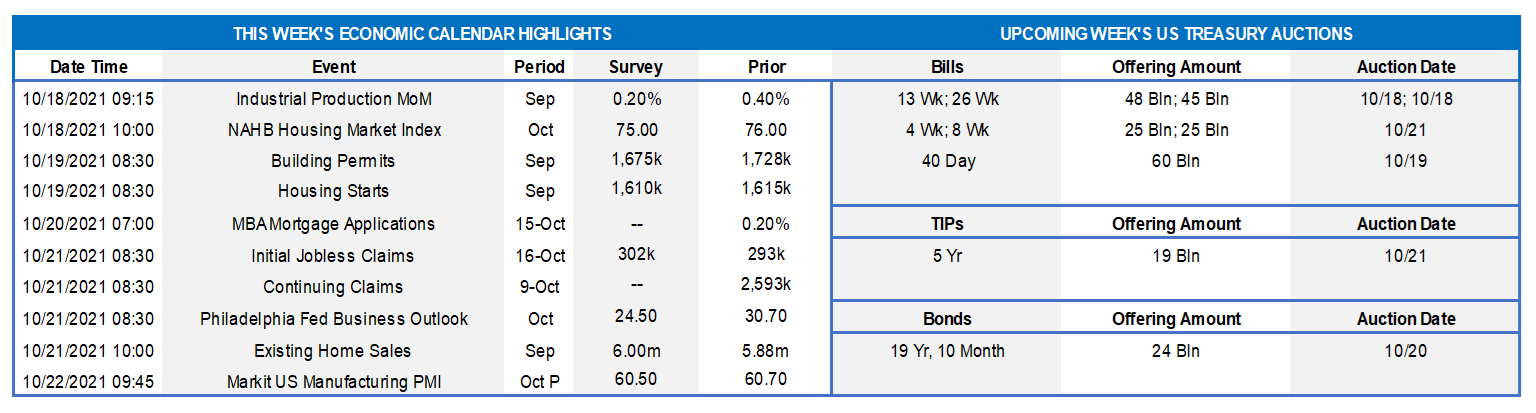
Industrial Production & Capacity Utilization: Production at the nation’s factories, mines, and utilities probably rose by .2% last month, after a .4% increase in August. With output likely eclipsing additions to productive capacity during the reference period, the overall operating rate likely climbed by .1% to 76.5% – the highest reading since the end of 2019.
NAHB Housing Market Index: Home-builders’ appraisals of market conditions probably were marginally less rosy in early October. Expected to move one point lower to 75, the NAHB Housing Market Index would remain well above the neutral 50-point mark.
Housing Starts & Building Permits: The number of housing units started are expected to dip by .3% to a SAAR of 1.61mn in September, reversing a fraction of the 3.9% rise recorded in August. The number of new building permits issued – a closely followed leading indicator of prospective residential construction activity – probably retreated by 2.7% to 1.675mn, after a 5.6% prior-month gain.
Jobless Claims: Initial and continuing claims under regular state unemployment insurance programs likely moved lower during their latest respective reporting periods. The recent termination of pandemic-related jobless benefits suggests that the total number of persons receiving assistance will also decline further during the week ended October 2 from the 3.65mn, or 2.3% of the civilian labor force, recorded in the prior week.
Existing Home Sales: The reported pickup in purchase-contract signings over the July-August span suggests that existing homes sales climbed by 3.3% to a 7-month high SAAR of 6.08mn in September. With available dwellings on the market likely dipping by 30K to 1.26mn during the reference period, the stock of unsold homes likely moved one tick lower to 2.5 months’ supply.
Markit Manufacturing PMI: The Markit purchasing agents’ gauge likely clocked at 60.5% in September, down slightly from the 60.7% posted in August.
Federal Reserve:
- Oct 18: Fed Governor Quarles to discuss the Financial Stability Board at an event hosted by the Bank of Spain.
- Oct 18: Minneapolis Fed President Kashkari to discuss improving financial inclusion at a forum hosted by the K.C. Fed.
- Oct 19: S.F. Fed President Daly to make remarks before a speech by Fed Governor Bowman to a regional banker forum.
- Oct 19: Atlanta Fed President Bostic to take part in a virtual interview by The Hill on helping the long-term unemployed.
- Oct 19: Fed Gov Waller to discuss the economy at an event hosted by the Stanford Institute for Economic Policy Research.
- Oct 20: Fed Governor Quarles to discuss the economic outlook at an event hosted by the Milken Institute in Los Angeles.
- Oct 20: Federal Reserve to release Beige Book Summary of Regional Economic Conditions.
- Oct 21: Fed Governor Waller to discuss the U.S. economy at a virtual event sponsored by the OMFIF.
- Oct 22: Fed Chair Powell to discuss post-COVID financial stability at event sponsored by Reserve Bank of South Africa.
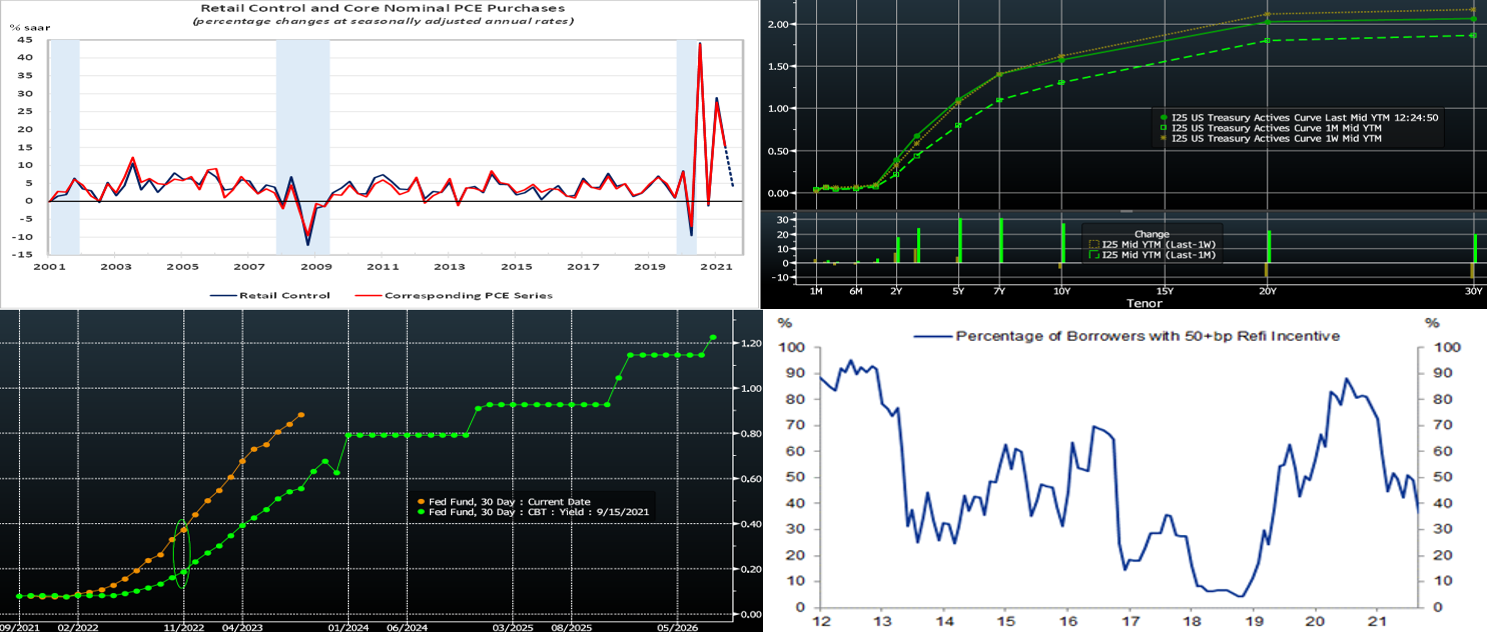
Source: Census Bureau, National Bureau of Economic Research, FHLBNY. Note: Shaded areas denote recessions. The Census Bureau reported that retail and food services sales climbed by .7% in September, almost matching the .9% rise in August. Last month’s result was considerably better that the median Street call for a .2% dip in purchases. With the exceptions of electronics and health & personal care products, all major business segments enjoyed increased revenues. Excluding a surprising .2% uptick in auto dealership revenues – unit vehicle purchases tumbled by 6.7% during the reference period – retail sales rose by 0.8%. Stepped-up purchases of sporting goods, general merchandise, miscellaneous items and a price-induced jump in gas station revenues powered that gain. Still constrained by safety concerns prompted by the pandemic, restaurants posted a modest sales gain in September. Excluding outlays on autos, building materials and gasoline, retail “control” – the portion of the report that is used by the Bureau of Economic Analysis to estimate nominal consumer goods spending – climbed by .8% last month, following a solid 2.7% jump in August. Pointing to a substantial deceleration in personal consumption expenditures, retail control advanced at an annual rate of just 3.6% during the summer, down sharply from the 15.6% second-quarter gain.
CHART 2 – UPPER RIGHT
Source: Bloomberg. Note: Top pane is yield (%), bottom pane is change (bps). As of midday Friday of a holiday-shortened week, the UST curve was notably flatter week-over-week, as yields 5-year-and-in rose, but those in the longer end declined. For instance, the 2-year was ~6 bps higher and 5-year was ~4 bps higher, whereas the 10-year moved ~5bps lower and 30-year ~12bps lower. The move in the longer end was impressive, given that there were UST auctions in both maturities during the week; both auctions witnessed strong demand. Economic data during the week was generally positive. But the mid-week CPI release was above consensus expectations. The curve flattening appears to be driven by the market ‘s belief that the Fed will counter and contain the longer-term inflation threat via a taper announcement in the next two months and thereby “kick off” a removal of accommodation and application of rate hikes later next year.
CHART 3 – LOWER LEFT
Source: Bloomberg. Depicted here is the Fed Funds futures curve (RHS, %) as of midday Friday vs. that of last month. Yields in the shorter end of the curve have moved higher partly on a repricing of Fed hike expectations. As seen in the oval in the chart, Fed Funds futures have moved ~19 bps higher, from .18 to ~.37%, for this juncture next year. Given that Fed Funds currently trades ~8 bps, this pricing for next year reflects just over a full 25 bps Fed hike and has now been priced into the curve.
CHART 4 – LOWER RIGHT
Source: eMBS; Goldman Sachs Research. The recent rise in yields, in tandem with the “burnout” effect of mortgagees having already refinanced their mortgages over the past 18 months, has driven lower the percentage of borrowers with at least a 50 bps incentive to refinance. This dynamic should provide some relief to investors from incoming principal on MBS and lower reinvestment rate prospects. The recent rise in yields, moreover, has also presented an opportunity to put money to work whether in loans, if possible, or in securities if loan potential is not presently available.
FHLBNY Advance Rates Observations
Front-End Rates
- Short-end Advance rates finished unchanged to a bp lower on the week. The debt ceiling issue has essentially been pushed off to December, but this issue, and the T-bill curve kinks it has caused, have not materially impacted our rates. Demand for short paper and the Fed’s RRP, which hit a record $1.6trn a few weeks ago and stands last ~$1.46trn, remains strong. The Fed acknowledged this dynamic at the last FOMC, as they raised the RRP counterparty limit to $160bn from $80bn. The overall supply/demand paradigm persists in suppressing rate levels, as the GSEs continue to invest large sums into money markets, the TGA has declined, Fed purchases instill funds to the banking system, and short-maturity paper is in low supply.
- UST issuance overall is now net positive supply in that more is being issued than what the Fed is buying in its programs. However, with short UST rates at rock-bottom levels and the Fed on hold, rates are likely to persist in a near-term sideways pattern. Importantly, weekly net T-bill issuance has been lower since 2020 and negative for months, and Treasury intends to shift issuance out the curve. T-bills are likely to experience a near-term issuance uptick on some “catch-up” issuance from the debt ceiling issue slowdown, but this uptick should not alter the overall money markets picture. Further legislative packages and related borrowing may lead to an eventual increase of T-bill auction sizes and positive net supply, but for now overall market supply/demand dynamics should keep short rates in check from large moves to the upside.
Term Rates
- The Advance rate curve flattened on the week. The 1-year was ~1 bp higher. But the 2 to 5-year sector was 8 to 9 bps higher. The 10-year finished ~2 bps lower week-over-week. Kindly refer to the previous section for further color on relevant market dynamics.
- On the UST supply front, this week brings a 5-year TIPS and a 20-year nominal auction. The latter will be interesting to monitor, in terms of whether this past week’s strong demand for longer maturities will persist. The market will closely monitor legislative developments as well as economic data and pandemic news.
New Product Alert: FHLBNY is pleased to announce the launch of the Business Development Advance (BDA) on Thursday, November 4, 2021. The BDA is a 0% advance to help our members provide funding to qualifying small businesses to promote community & economic growth. The BDA is subsidized funding in the form of interest-rate credits. There is a total of $3 million of interest-rate credits available in 2021. Members can request to reserve their interest-rate credits up to $50,000 on a first-come/first-served basis.
New Product Alert: In order to satisfy member needs and provide greater product flexibility to match bond and derivative market conventions, FHLBNY now offers SOFR-linked advances based on SOFR-index compounding. Note that this product is in addition to SOFR-linked advances based on SOFR-index averaging which have been offered since November 2018.
The Symmetrical Prepayment Advance Feature
With rates at or near multi-year lows, it is a compelling juncture to use the SPA feature on term advances. This feature allows member to capture, at prepayment, changes in the Fair Value of the advance which are favorable to the member. Contact us to discuss.
Looking for more information on the above topics? We’d love to speak with you!
Questions?
If you wish to receive the MSD Weekly Market Update in .pdf format (includes FHLBNY rate charts) or to discuss this content further, please email the MSD Team.