Member Services Desk
Weekly Market Update
This MSD Weekly Market Update reflects information for the week ending June 30, 2023.
Economist Views
Click to expand the below image.
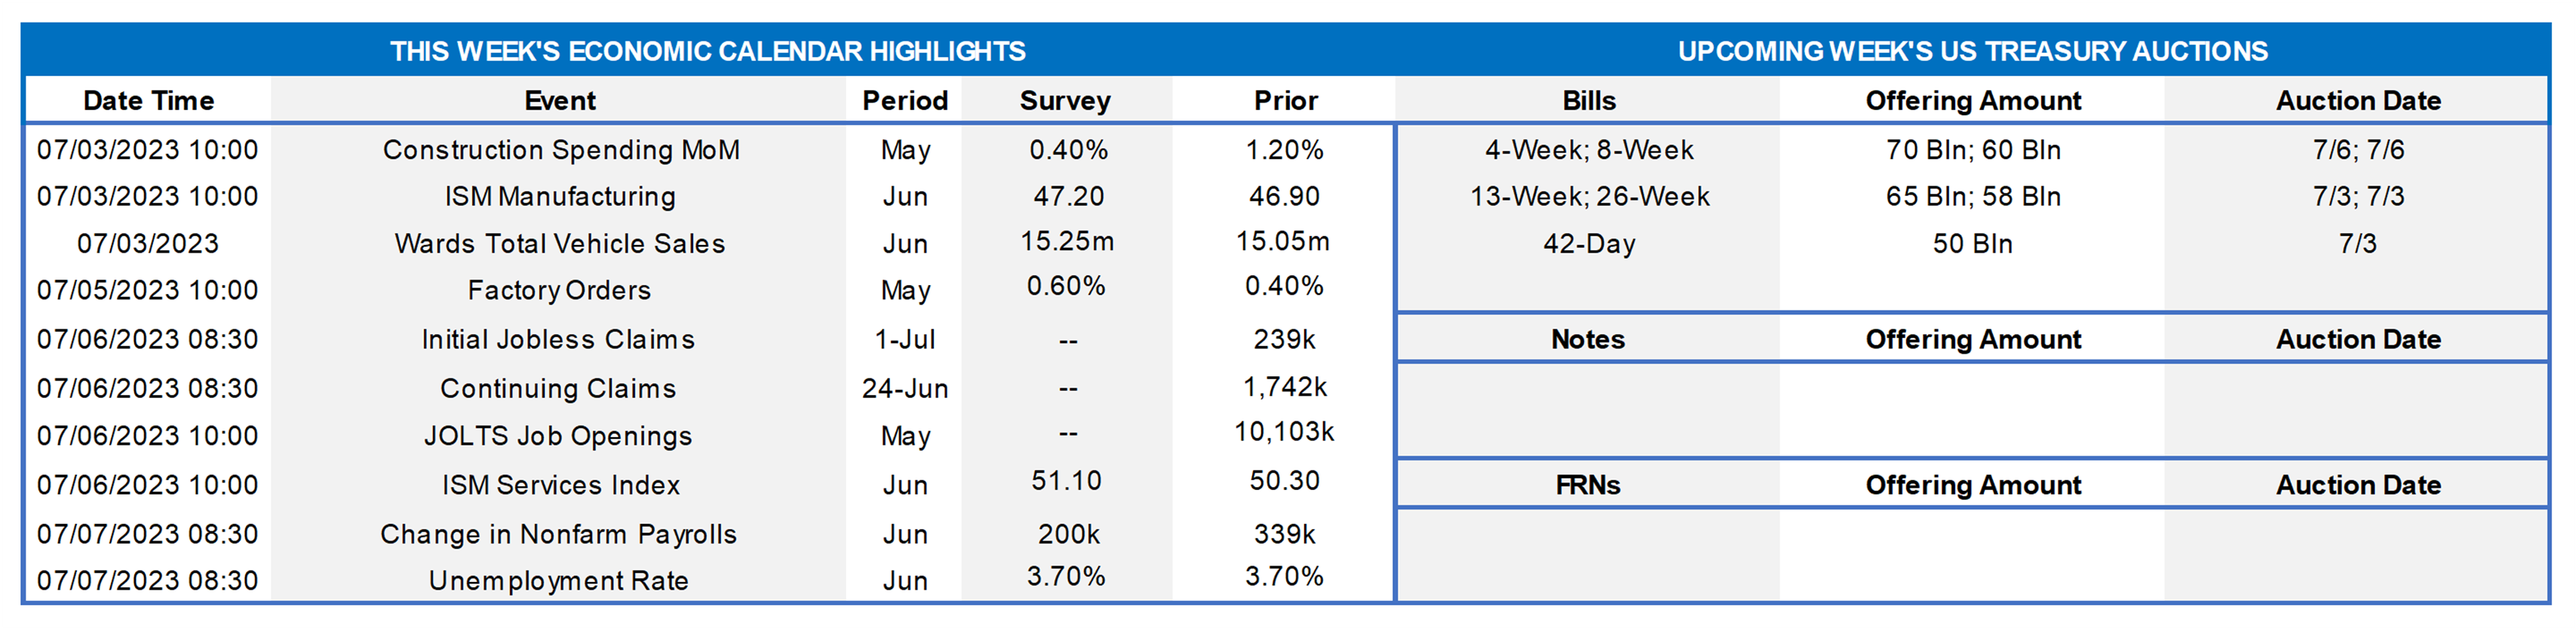
Market participants will contend with a crowded statistical calendar in the upcoming holiday-shortened week. Given recent comments by Fed Chair Powell, labor-market soundings will be front and center. Upcoming figures likely will point to a resumption of fed funds rate increases during the summer. Job creation is expected to remain solid in June, with the civilian unemployment rate reversing two-thirds of May’s surprising rise. Although a month behind the employment report, an anticipated rise in job openings in May will support the view that labor demand continued to eclipse supply by a wide margin as the Q2 progressed. Purchasing manager reports from the manufacturing and service-producing sectors are expected to be mixed in June. An anticipated rebound in auto sales in June likely will prompt economists to mark up their projections for Q2 consumer spending and real GDP growth. The minutes of the recent FOMC meeting may shed light on how committed policymakers are to further rate hikes.
Construction Spending: The nominal value of new construction put-in-place is expected to climb by .5% in May, boosting the cumulative rise since January to 4.5%.
ISM Manufacturing Activity Index: Nationwide manufacturing activity probably contracted for an eighth straight month in June. District Federal Reserve Bank canvasses and other surveys suggest that the Purchasing Managers Index retreated to a three-year low of 46% from 46.9% in the prior month.
Unit Motor Vehicle Sales: Buoyed by dealer discounts and stepped-up fleet purchases, sales likely jumped by 5% to a SAAR of 15.8mn in June, erasing all but a fraction of May’s reported slide.
Factory Orders: Powered by an aircraft-led jump in transportation equipment bookings, factory orders probably climbed by .8% in May, following an upwardly revised .5% gain in April.
International Trade Balance: To be released on the 6th – Reflecting an import-led narrowing of the merchandise trade deficit, the gap on international trade in goods and services likely narrowed to $69bn in May from the $74.6bn shortfall posted in April. That forecast, if realized, would suggest that the external sector will be a drag on Q2 real GDP growth.
JOLTS Job Openings: A reported rise in online help-wanted postings suggests that nationwide job openings rose by 180K to a four-month high of 10.28mn in May. At an estimated 4.18mn, the excess of vacant positions nationwide would represent 1.7 jobs per unemployed person.
ISM Service-Producing Activity Index: Available surveys suggest that service-producing activity quickened slightly in June, thereby lifting this gauge to 51.7% from 50.3% in the preceding month.
Employment Situation Report: Labor market conditions probably remained extremely tight as the spring quarter ended. Nonagricultural businesses likely added 275K net new workers in June, almost matching the average 283K gain recorded over the March-May span. Weekly jobless claims reports and consumer-sentiment soundings suggest that the civilian unemployment rate retreated to 3.5% from 3.7% in the preceding month. Buoyed by an extended five-week interval between establishment surveys, average hourly earnings likely climbed by .5% in June – the largest increase since last July. If realized, that result would place nominal compensation 4.4% above the $32.18 per hour received a year earlier.
Federal Reserve Appearances:
- July 5 Minutes from the June 13-14 Federal Open Market Committee meeting to be released.
- July 5 New York Fed President Williams to participate in a discussion at the 2023 Central Bank Research Association meeting.
- July 6 Dallas Fed President Logan to speak about policy challenges at the annual Central Bank Research Association meeting.
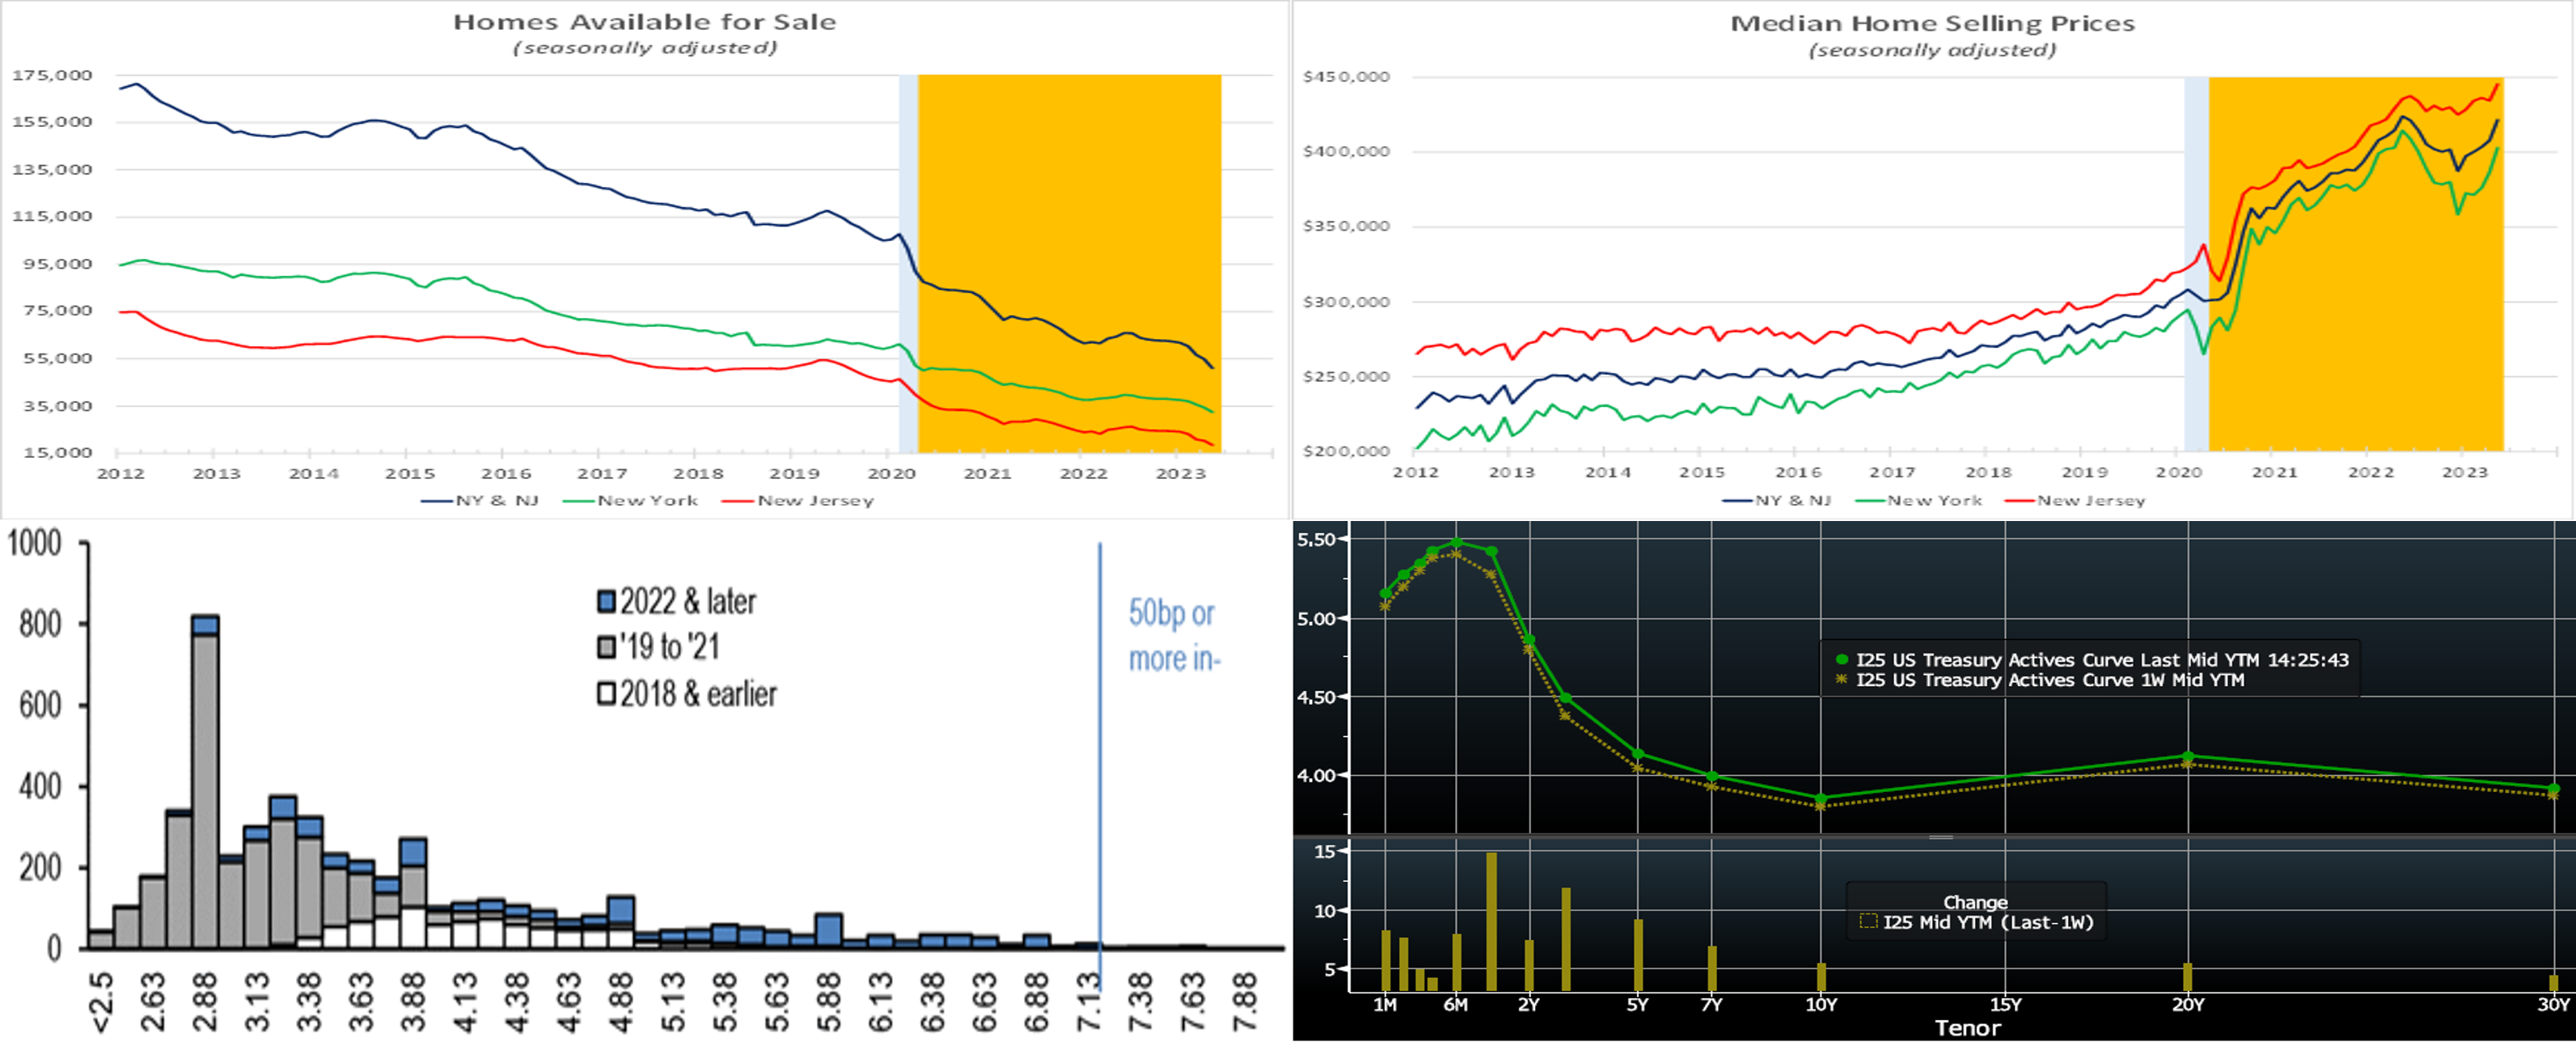
CHART 1 UPPER LEFT
Source: New York State Association of Realtors; NJ Realtors; FHLB-NY estimates. Notes: Blue-shaded areas denote recession; orange-shaded area denotes current economic expansion. Record low dwellings on the market in New York and New Jersey continue to support local home-selling prices. While the number of residential structures under construction in the Northeast has swelled to levels last witnessed in the late 1980s, new single-family homes account for less than one-third of the total. Against that backdrop, and with completion times near record lengths, the stocks of available homes in the Empire and Garden States have continued to plumb new lows. Indeed, the number of dwellings on the market across the two states has contracted by 20.7% to just 51.1K over the 12 months ended May, less than half the 107.8K homes available when the economy last peaked in February 2020. While higher mortgage interest rates have had a predictable dampening effect on housing demand, the dearth of available dwellings continues to underpin prices (kindly see below companion chart). Indeed, after hitting a recent low of $387,310 at the end of 2022, the median home selling price across New York and New Jersey has climbed by 8.8% to $421,540, just .6% off the record high $423,965 witnessed a year ago.
CHART 2 UPPER RIGHT
Source: See above. This chart is a companion to the above.
CHART 3 LOWER LEFT
Source: JP Morgan; Fannie Mae; Freddie Mac. As mentioned above, higher mortgage rates have predictably crimped housing demand, but they also have served to depress supply. Here is a picture of outstanding conventional 30-year loans (LHS, $bn) by WAC (X-axis, %) and vintage year. A quick observation is that the universe of loans with “50 bps or more” refi incentive is miniscule. Meanwhile, there exists a proportionately large cohort of loans at rates well below current mortgage rates. This dynamic can serve to dissuade or delay many homeowners from moving and thereby reduce available housing market supply.
CHART 4 LOWER RIGHT
Source: Bloomberg. Top pane is yield (LHS, %), bottom pane is change (bps). From last Thursday afternoon to this one, UST term yields finished higher and flatter yet again, with 2 to 10-year yields up by ~6 to 14 bps. The 2-year yield (roll-adjusted for the new on-the-run security) led the way. Hawkish Fedspeak again was a major reason for the changes, as Fed Chair Powell publicly relayed that “a majority of the FOMC see two or more rate hikes by the end of the year” and that he does not foresee core inflation returning to the 2% target before 2025. Meanwhile, economic data was better than expected; indeed, Bloomberg’s Economic Surprise Index hit its highest level in two years. Consequently, the market priced a higher chance of hikes this year and backtracked further on its pricing of potential rate cuts later in 2023-2024. As of this writing, the market prices the odds of a 25 bps hike at the July 27th FOMC at ~86%. The 2023 peak funds rate stands at ~5.43% in November, while the year-end Fed Funds forward is ~5.39%, ~11 bps higher than a week ago. The market’s repricing of the Fed has served to push the Fed’s BTFP rate higher, thereby now making our 2-month-and-in advance tenors a better rate alternative. Please call the Member Services Desk for further information on market dynamics and/or products.
FHLBNY Advance Rates Observations
Front-End Rates
- Short-end rates are a bit higher and steeper from a week ago, with the under 1-month mostly unchanged but the 1 to 6-month sector higher by 3 to 7 bps. Relatively hawkish Fedspeak and the market pricing higher odds of hikes propelled the move. Net T-bill supply remains robust, as Treasury rebuilds its account post-debt ceiling agreement; however, it has been absorbed well thus far, as Money Market Funds (MMFs) switch from the Fed’s RRP to T-bills with competitive yields. Moreover, FHLB supply has subsided from peak levels of spring, further helping T-bill interest from investors. These dynamics are conspiring to ease any upward pressure on rates from the T-bill supply resurgence.
- Economic data, especially Friday’s jobs report, should be the prime driver of rates this upcoming holiday week.
Term Rates
- The longer-term curve moved higher and flatter, generally mirroring moves in USTs and swaps. The 2 to 10-year zone was up by 5 to 13 bps, led by the 2 and 3-year tenors. Kindly refer to the previous section for relevant market color. The advance curve remains inverted out to 5-year, thereby offering opportunities to extend in advance duration at lower coupon cost.
- On the UST term supply front, the upcoming week serves a reprieve from auctions. Please contact the Member Services Desk for further information on market dynamics, rate levels, or products.
Product Alert: FHLBNY is pleased to announce the reintroduction, after a temporary suspension owing to Libor-cessation, of the Putable Advance, Fixed-Rate with SOFR Cap Advance, and ARC with SOFR Cap/Floor Advance. The Callable Advance continues to be offered. This expansion of the product menu will provide members with more options and flexibility for the management of funding and/or hedging needs.
Forward Start Advance (FSA): For members with upcoming borrowing or refunding plans, consider the FSA as a method to opportunistically “lock in” rates before advance settlement date. Please contact the Member Services Desk at (212) 441-6600 for more information.
The Symmetrical Prepayment Advance Feature
For those anticipating term funding needs, and with rates on an uptrend, it can be an appropriate juncture to consider our SPA feature. This feature allows the member to capture, at prepayment, changes in the fair value of the advance which are favorable to the member. Contact Member Services Desk to discuss.
Looking for more information on the above topics? We’d love to speak with you!
Questions?
If you wish to receive the MSD Weekly Market Update in .pdf format (includes FHLBNY rate charts) or to discuss this content further, please email the MSD Team.