Member Services Desk
Weekly Market Update
This MSD Weekly Market Update reflects information for the week ending April 28, 2023.
Economist Views
Click to expand the below image.
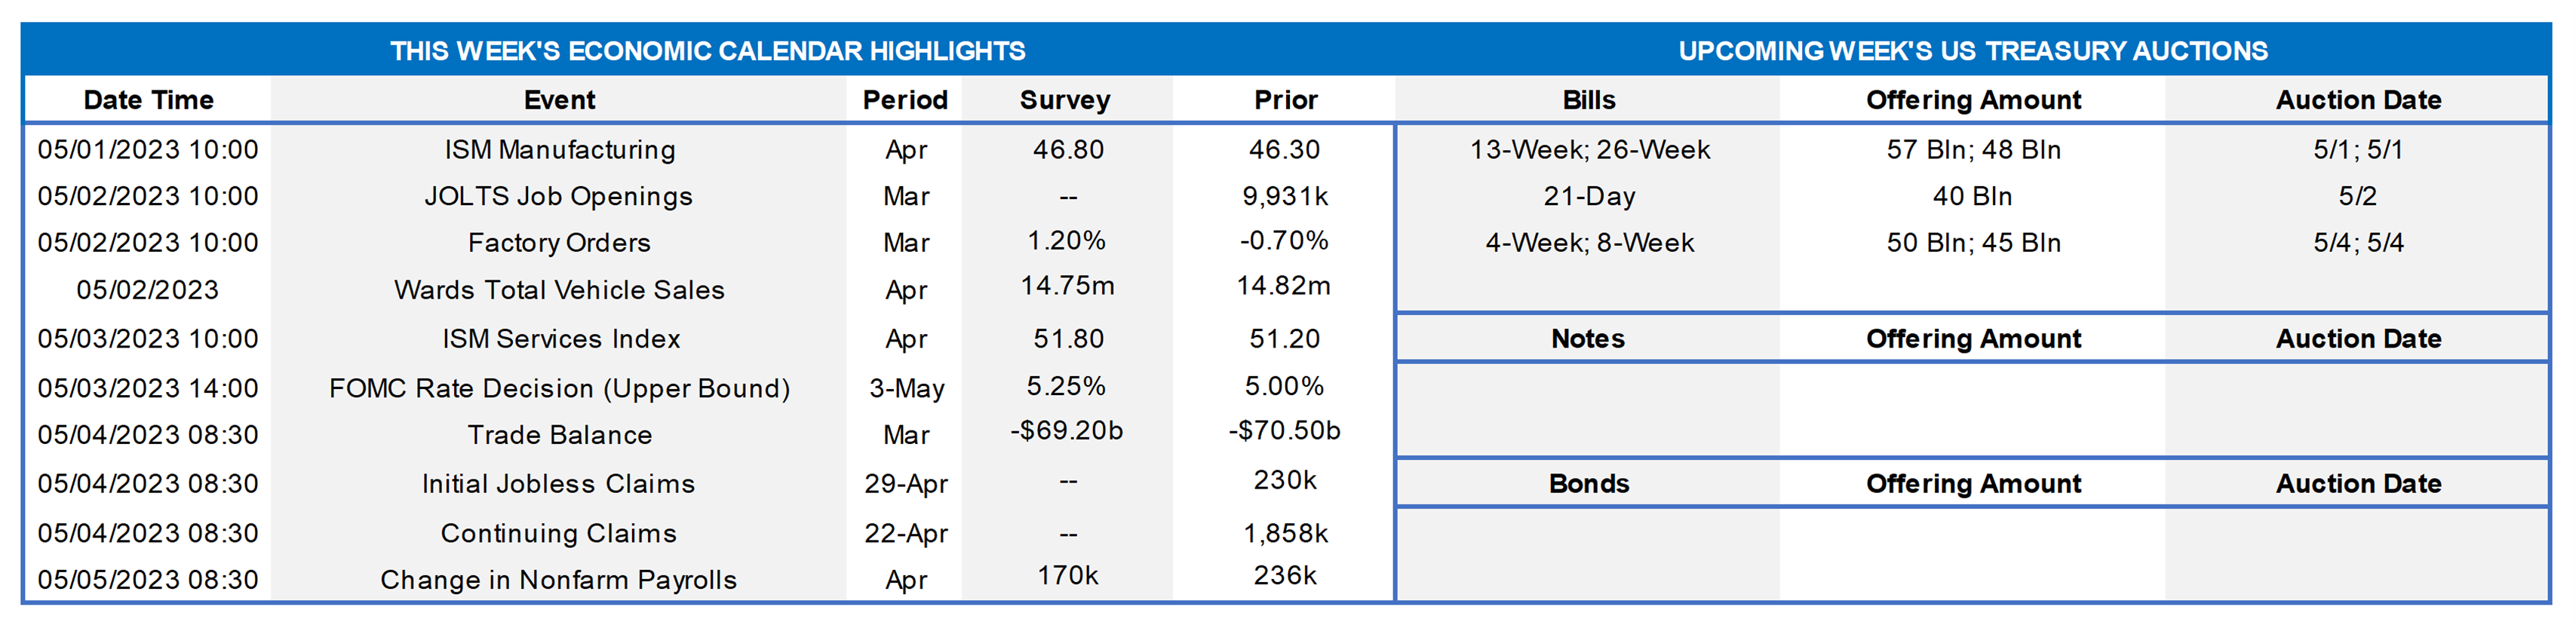
The Federal Open Market Committee (FOMC) meeting will be the marquee event of the upcoming week. Expectations for its outcome have been extremely volatile since policymakers last gathered on March 22, with market-based probabilities of another 25 bps hike ranging from a low of 24% in the wake of the recent banking turmoil to a high of 90% early last week. The post-meeting communiqué will likely reiterate that recent indicators point to modest growth in spending and output, job gains have been robust in recent months, and the unemployment rate has remained low. Despite the continuing moderation, the statement can be expected to repeat that inflation remains elevated. Policymakers probably will remark that some additional policy firming may be appropriate to attain a sufficiently restrictive stance to return inflation to the desired 2% target over time; yet acknowledge once again that, given the lags with which monetary policy affects economic activity and inflation, the cumulative tightening to date will be taken into consideration in determining the extent of future rate increases.
ISM Manufacturing Activity Index: Nationwide manufacturing activity probably contracted for a sixth straight month in April. District Federal Reserve Bank canvasses and other surveys suggest that the Purchasing Managers Index improved to 48% from 46.3% in the prior month.
JOLTS Job Openings: A reported rise in online help-wanted postings suggests that nationwide job openings rebounded by 170K to 10.1mn in March, reversing a little over one quarter of the 632K drop witnessed in February. At an estimated 4.26mn, the excess of vacant positions nationwide would represent 1.73 jobs per unemployed person.
Factory Orders: Powered by an aircraft-led surge in transport equipment, orders likely climbed by 1.5% in March, reversing just over half of the 2.9% decline posted over the January-February span.
Motor Vehicle Sales: Motor vehicle purchases are expected to have clocked in at a seasonally adjusted annual rate of 14.8mn in April, unchanged from March and just 2.3% below the 15.2mn clip witnessed during the winter quarter.
ISM Services Activity Index: Available surveys suggest that service-producing activity slowed in April, with this barometer clocking in at 50.5%, down from 51.2% in March.
International Trade Balance: Reflecting a substantial narrowing of the merchandise trade gap, the deficit on international trade in goods and services likely closed to a four-month low of $63.2bn in March from the $70.5bn shortfall recorded in February.
Employment Situation Report: Labor market conditions probably remained tight in April. Nonagricultural establishments likely added 225K net new workers, almost matching the 236K increase recorded in March. The civilian unemployment rate is expected to edge one tick higher to 3.6% during the reference period, marginally above the half-century low of 3.4% plumbed in January. Average hourly earnings are expected to have quickened last month, rising by .5% after March’s .3% gain. If realized, that result would place nominal compensation 4.4% above the $31.94 per hour received a year ago.
Federal Reserve Appearances:
- May 2-3 Federal Open Market Committee meeting.
- May 3 FOMC Monetary Policy Decision.
- May 3 Federal Reserve Chair Jerome Powell to hold post-FOMC meeting press conference.
- May 5 St. Louis Fed President Bullard to speak to the Economic Club of Minneapolis.
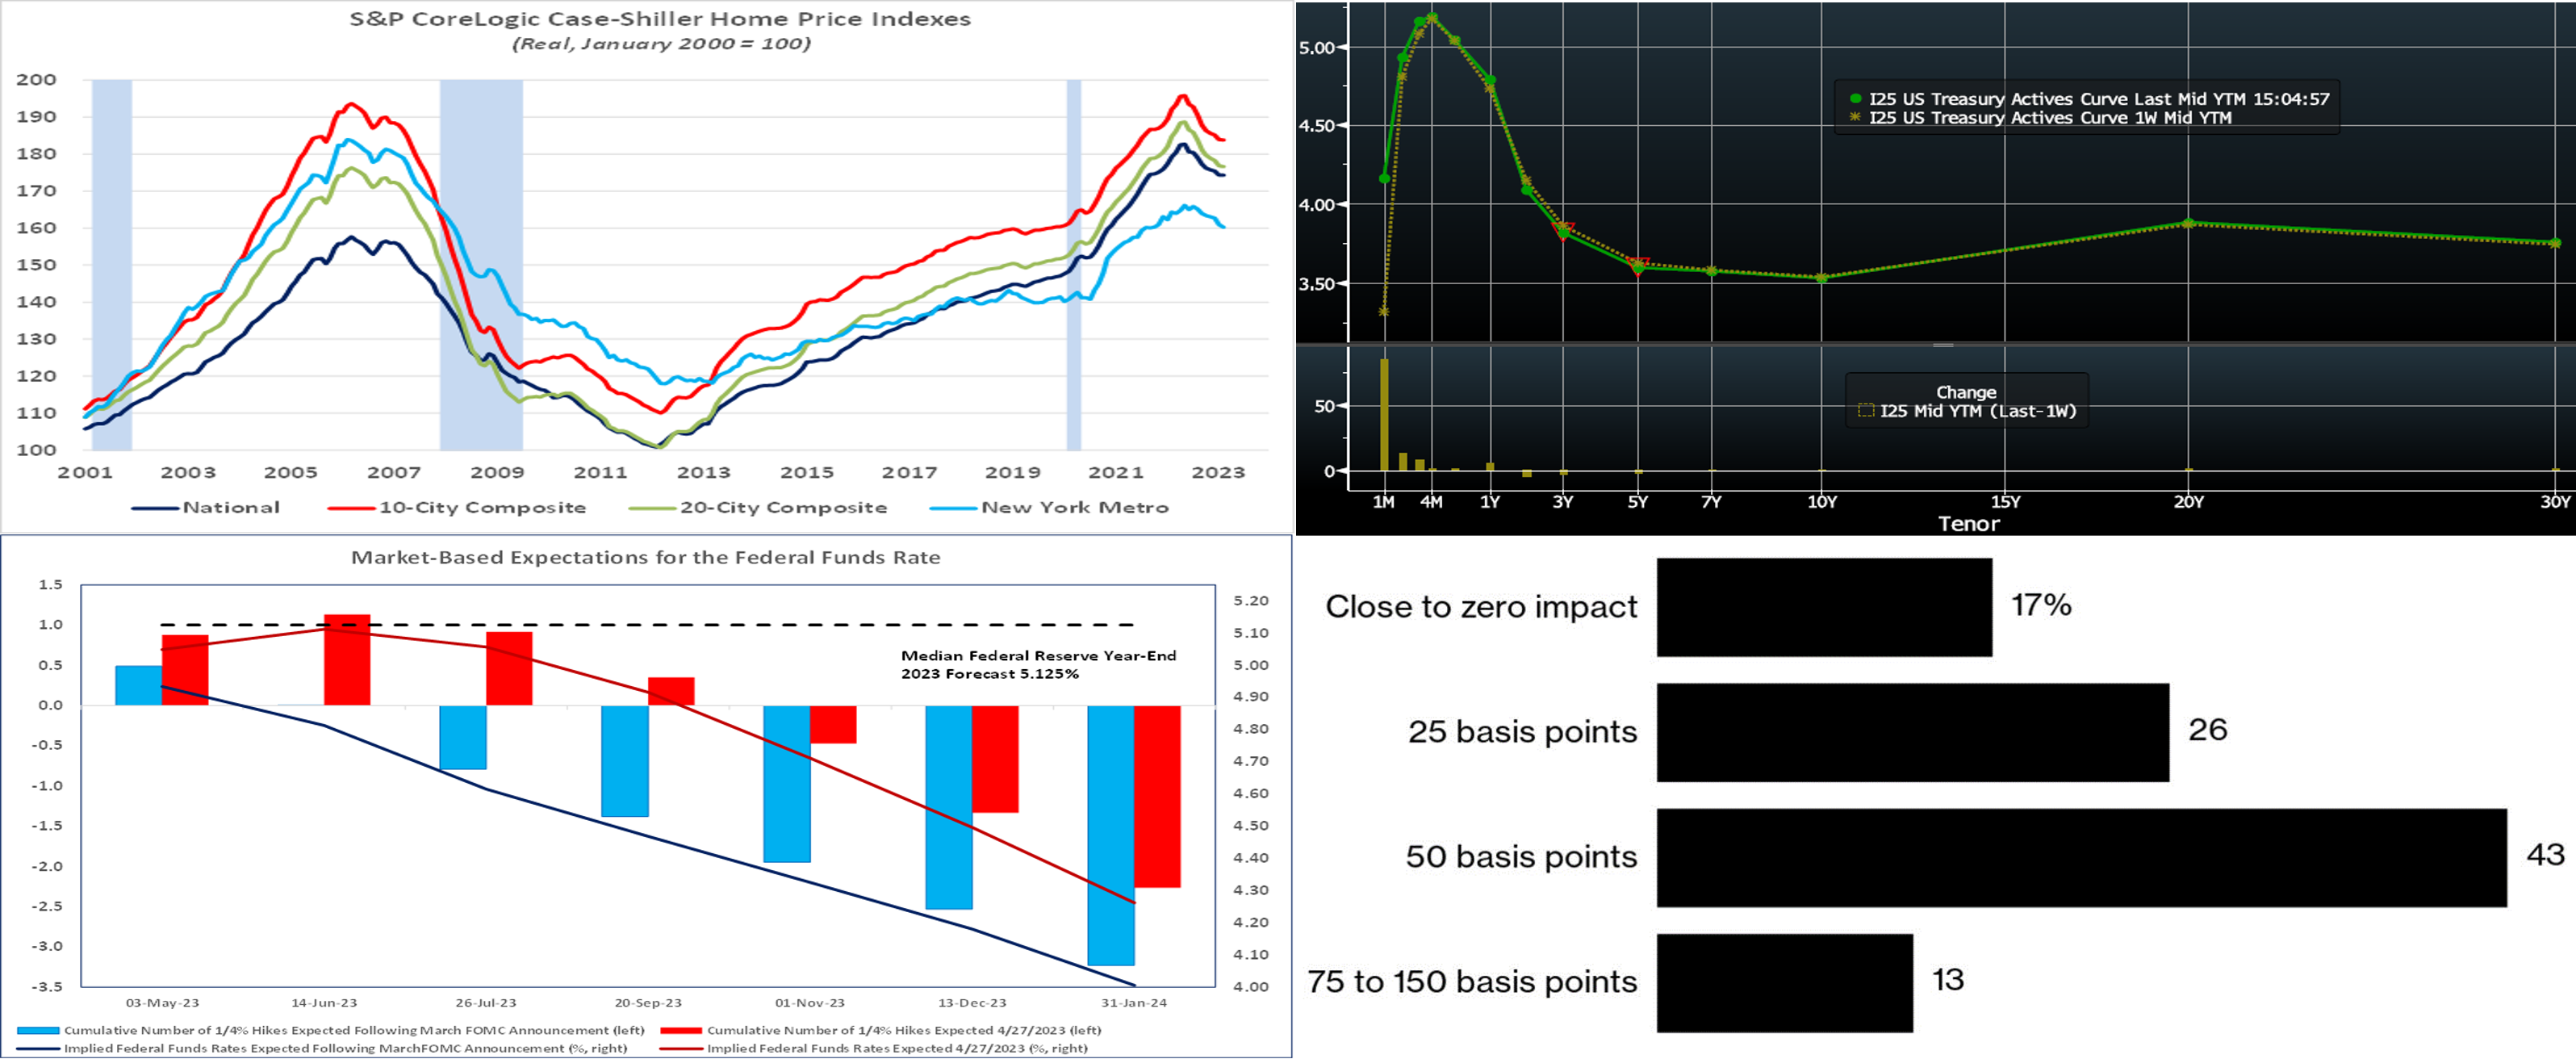
CHART 1 UPPER LEFT
Source: S&P CoreLogic Case-Shiller, Bureau of Labor Statistics, National Bureau of Economic Research; FHLB-NY. Note: Blue-shaded areas denote recessions. Depending on the scope of the measure used, nominal home prices remained 40% to 60% above their pre-financial crisis peaks in February. The picture is considerably less steamy when inflation is considered, however. Indeed, in real terms, the S&P CoreLogic Case-Shiller national home-price measure stands 10.5% above its all-time high, while the 20-city barometer is just .2% above its prior peak. By contrast, the narrower 10-city composite now stands 5.1% shy of its historical maximum after adjusting for consumer prices excluding shelter costs. New York City metro area home prices clocked in at a whopping 12.9% below the all-time high reached 17 years earlier.
CHART 2 UPPER RIGHT
Source: Bloomberg. Top pane is yield (LHS, %), bottom pane is change (bps). From last Thursday afternoon to this one, UST term yields were mostly unchanged. However, this observation understates the week’s movements. Mid-week on Wednesday, yields were 10 to 20 bps lower across the curve until they reversed after Thursday’s economic data. For instance, 2-year traded as low as ~3.87% on Wednesday before retracing to ~4.09% as of this writing. While data continues to generally reflect some economic slowing, inflationary embers appear still present and job markets have remained relatively strong. This dynamic was evident in Thursday’s GDP report, which portrayed slower growth but still concerning inflation readings. Given this backdrop, the Fed appears likely to hike again this week. As of this Thursday afternoon’s writing, the market prices the odds of a 25 bps hike at the May 3rd FOMC at ~90% (up a tad from last week’s 88%), and June, at ~5.12% (up a bp from last week), is the peak rate on the short-end Fed Funds forward curve. The year-end forward is ~4.54%, down a few bps from last week, and so Fed easing is still priced into the curve for later this year but to a much lesser extent than during last month’s turmoil. Please call the desk for further information on market dynamics and/or products.
CHART 3 LOWER LEFT
Source: Bloomberg; FHLB-NY. Illuminating the color above, here is a view of the market’s pricing (via Fed funds futures and swaps) of the Fed; shown is current (Thursday midday, Red) vs. that following the March 22nd FOMC (blue). Clearly, the market has retraced from last month, owing to the ebbing of banking industry turmoil alongside economic data and Fed-speak indicating that the Fed’s fight against inflationary forces appears likely not yet complete.
CHART 4 LOWER RIGHT
Source: Bloomberg. In a Bloomberg survey of economists in the past week (46), most respondents view the impact of recent banking industry turmoil as the equivalent of two or more 25 bps Fed hikes, with a plurality seeing it as equal to a 50 bps hike. Essentially, the respondents’ views are predicated on an anticipated tightening in credit conditions, with an especially pronounced negative effect on commercial real estate. Indeed, other recent surveys of bank lenders and small business borrowers have indicated an already tightening credit climate. While the Fed acknowledged these potential impacts at last month’s meeting, perhaps further light will be shone on this topic, along with its influence on monetary policy, at this week’s meeting.
FHLBNY Advance Rates Observations
Front-End Rates
- Short-end rates were higher by ~3 to 20 bps from a week ago, with shorter maturities leading the change. Essentially, maturity dates have further crossed into the timeline of this upcoming week’s Fed hike. Meanwhile, the recent dynamic of low supply vs. voracious demand in the short-end markets ebbed over the course of the past week. Please see the previous section for color on Fed pricing.
- With the Fed in blackout mode before the May 3rd FOMC, economic data should dictate direction early in the week. Thereafter, the FOMC outcome will be the key event.
Term Rates
- The longer-term curve, generally mirroring moves in USTs and swaps, was relatively unchanged on a week-over-week basis except for the 3 to 5-year zone, which declined ~5 bps. Kindly refer to the previous section for relevant market color. The advance curve remains inverted out to 5-year, thereby offering opportunities to extend in advance duration at lower coupon cost.
- On the UST term supply front, this upcoming week serves as reprieve from auctions. Please contact the Member Services Desk for further information on market dynamics, rate levels, or products.
Product Alert: FHLBNY is pleased to announce the reintroduction, after a temporary suspension owing to Libor-cessation, of the Putable Advance, Fixed-Rate with SOFR Cap Advance, and ARC with SOFR Cap/Floor Advance. The Callable Advance continues to be offered. This expansion of the product menu will provide members with more options and flexibility for the management of funding and/or hedging needs.
Forward Start Advance (FSA): For members with upcoming borrowing or refunding plans, consider the FSA as a method to opportunistically “lock in” rates before advance settlement date. Please contact the Member Services Desk at (212) 441-6600 for more information.
The Symmetrical Prepayment Advance Feature
For those anticipating term funding needs, and with rates on an uptrend, it can be an appropriate juncture to consider our SPA feature. This feature allows the member to capture, at prepayment, changes in the fair value of the advance which are favorable to the member. Contact Member Services Desk to discuss.
Looking for more information on the above topics? We’d love to speak with you!
Questions?
If you wish to receive the MSD Weekly Market Update in .pdf format (includes FHLBNY rate charts) or to discuss this content further, please email the MSD Team.