Member Services Desk
Weekly Market Update
This MSD Weekly Market Update reflects information for the week ending May 30, 2025.
Economist Views
Click to expand the below image.
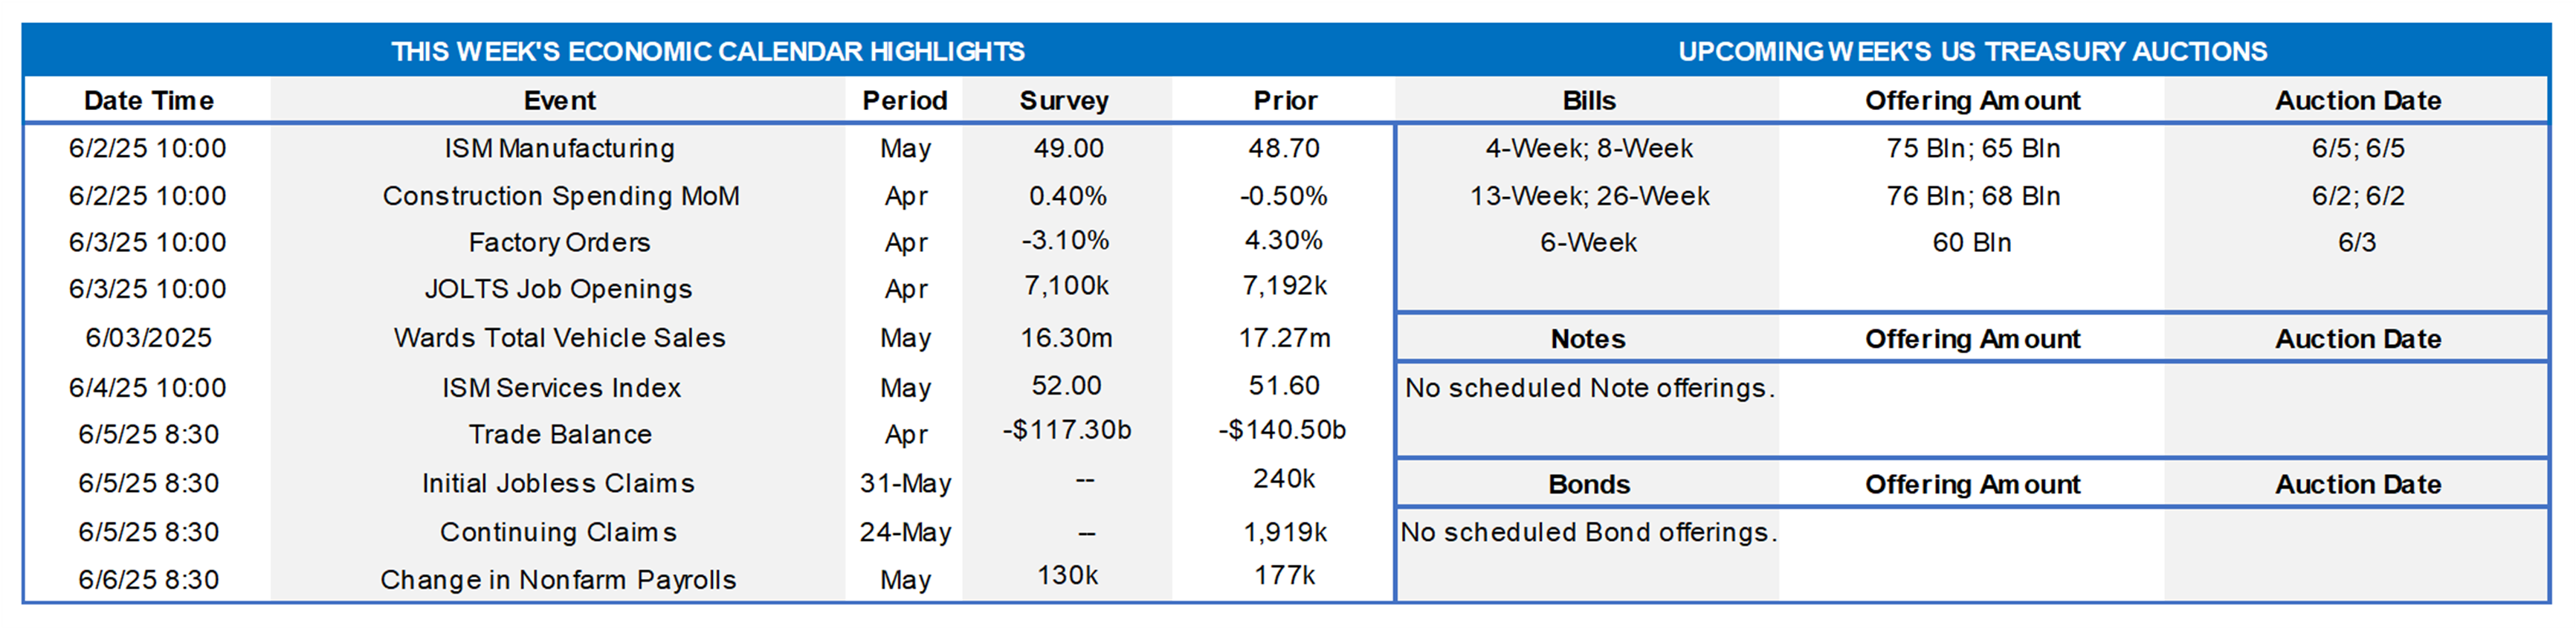
The market’s focus will return to the labor side of the Federal Reserve’s dual mandate this upcoming week when the Bureau of Labor Statistics (BLS) releases its update on the employment situation for May. Canvasses from the Institute for Supply Management (ISM) will probably show that both the manufacturing and service-producing sectors expanded for the first time in three months. Results in line with the above projections would undoubtedly push expectations of an impending rate cut further out into the future.
Construction Spending: The nominal value of new construction put-in-place likely rebounded in April after the surprising .5% dip witnessed in March.
ISM Manufacturing Activity Index: Available canvasses suggest that the gauge returned to expansionary territory in May, climbing to a nearly three-year high of 51.5% from 48.7% in April.
Factory Orders: Pared by an aircraft-led drop in durable goods bookings, total factory orders probably fell by 3.5% in April, completely erasing the 3.6% gain witnessed in March.
JOLTS Job Openings: A reported uptick in online help-wanted postings suggests that nationwide job openings rose by 85K to 7.28mn in April. At an estimated 112K during the reference period, the excess of vacant positions nationwide would represent 1.02 jobs per unemployed person.
Motor Vehicle Sales: With domestic automakers apparently unwilling to absorb the costs of tariffs, dealer stocks likely will decline heading into the summer months, capping reported sales. Purchases of passenger cars and light trucks probably retreated to a seasonally adjusted annual rate of 15.9mn in May, down from the heady 17.5mn pace set over the prior two months.
ISM Services Activity Index: The expansion in service-producing activity probably widened further in May, with the barometer jumping to a five-month high of 54% from 51.6% in April.
Merchandise Trade Balance: The merchandise trade deficit likely narrowed sharply to $95bn in April from the tariff-induced record-high $140.5bn posted in the previous month.
Employment Situation Report: Labor market conditions probably remained healthy as Q2 progressed. Non-agricultural establishments likely added 190K net new positions in May, marginally eclipsing the 177K job gain recorded in April. Weekly soundings on those receiving regular state unemployment insurance benefits suggest that the civilian jobless rate remained at 4.2% for a third straight month, leaving the Sahm-Rule recession gauge at .27%, still shy of the .5% critical value consistent with previous business-cycle turning points. With an extended five-week interval between BLS’s canvassing period, an upside surprise on average hourly earnings compared to the Street’s median .3% projection may also be in store.
Federal Reserve Appearances:
- June 2 Fed Chair Powell to make opening remarks at the International Finance Division’s 75th Anniversary Conference.
- June 3 Chicago Fed President Goolsbee to participate in a Q&A with the Corridor Business Journal in Cedar Rapids, Iowa.
- June 3 Dallas Fed President Lorie Logan to give the opening remarks at a Fed Listens event.
- June 4 Atlanta Fed President Bostic and Fed Governor Cook to moderate a roundtable conversation at a Fed Listens event.
- June 4 Federal Reserve to release Beige Book report on district economic conditions.
- June 5 Fed Governor Adriana Kugler to speak at the Economic Club of New York.
- June 5 Philadelphia Fed President Harker to give remarks on the economic outlook at an event at the Philadelphia Fed.
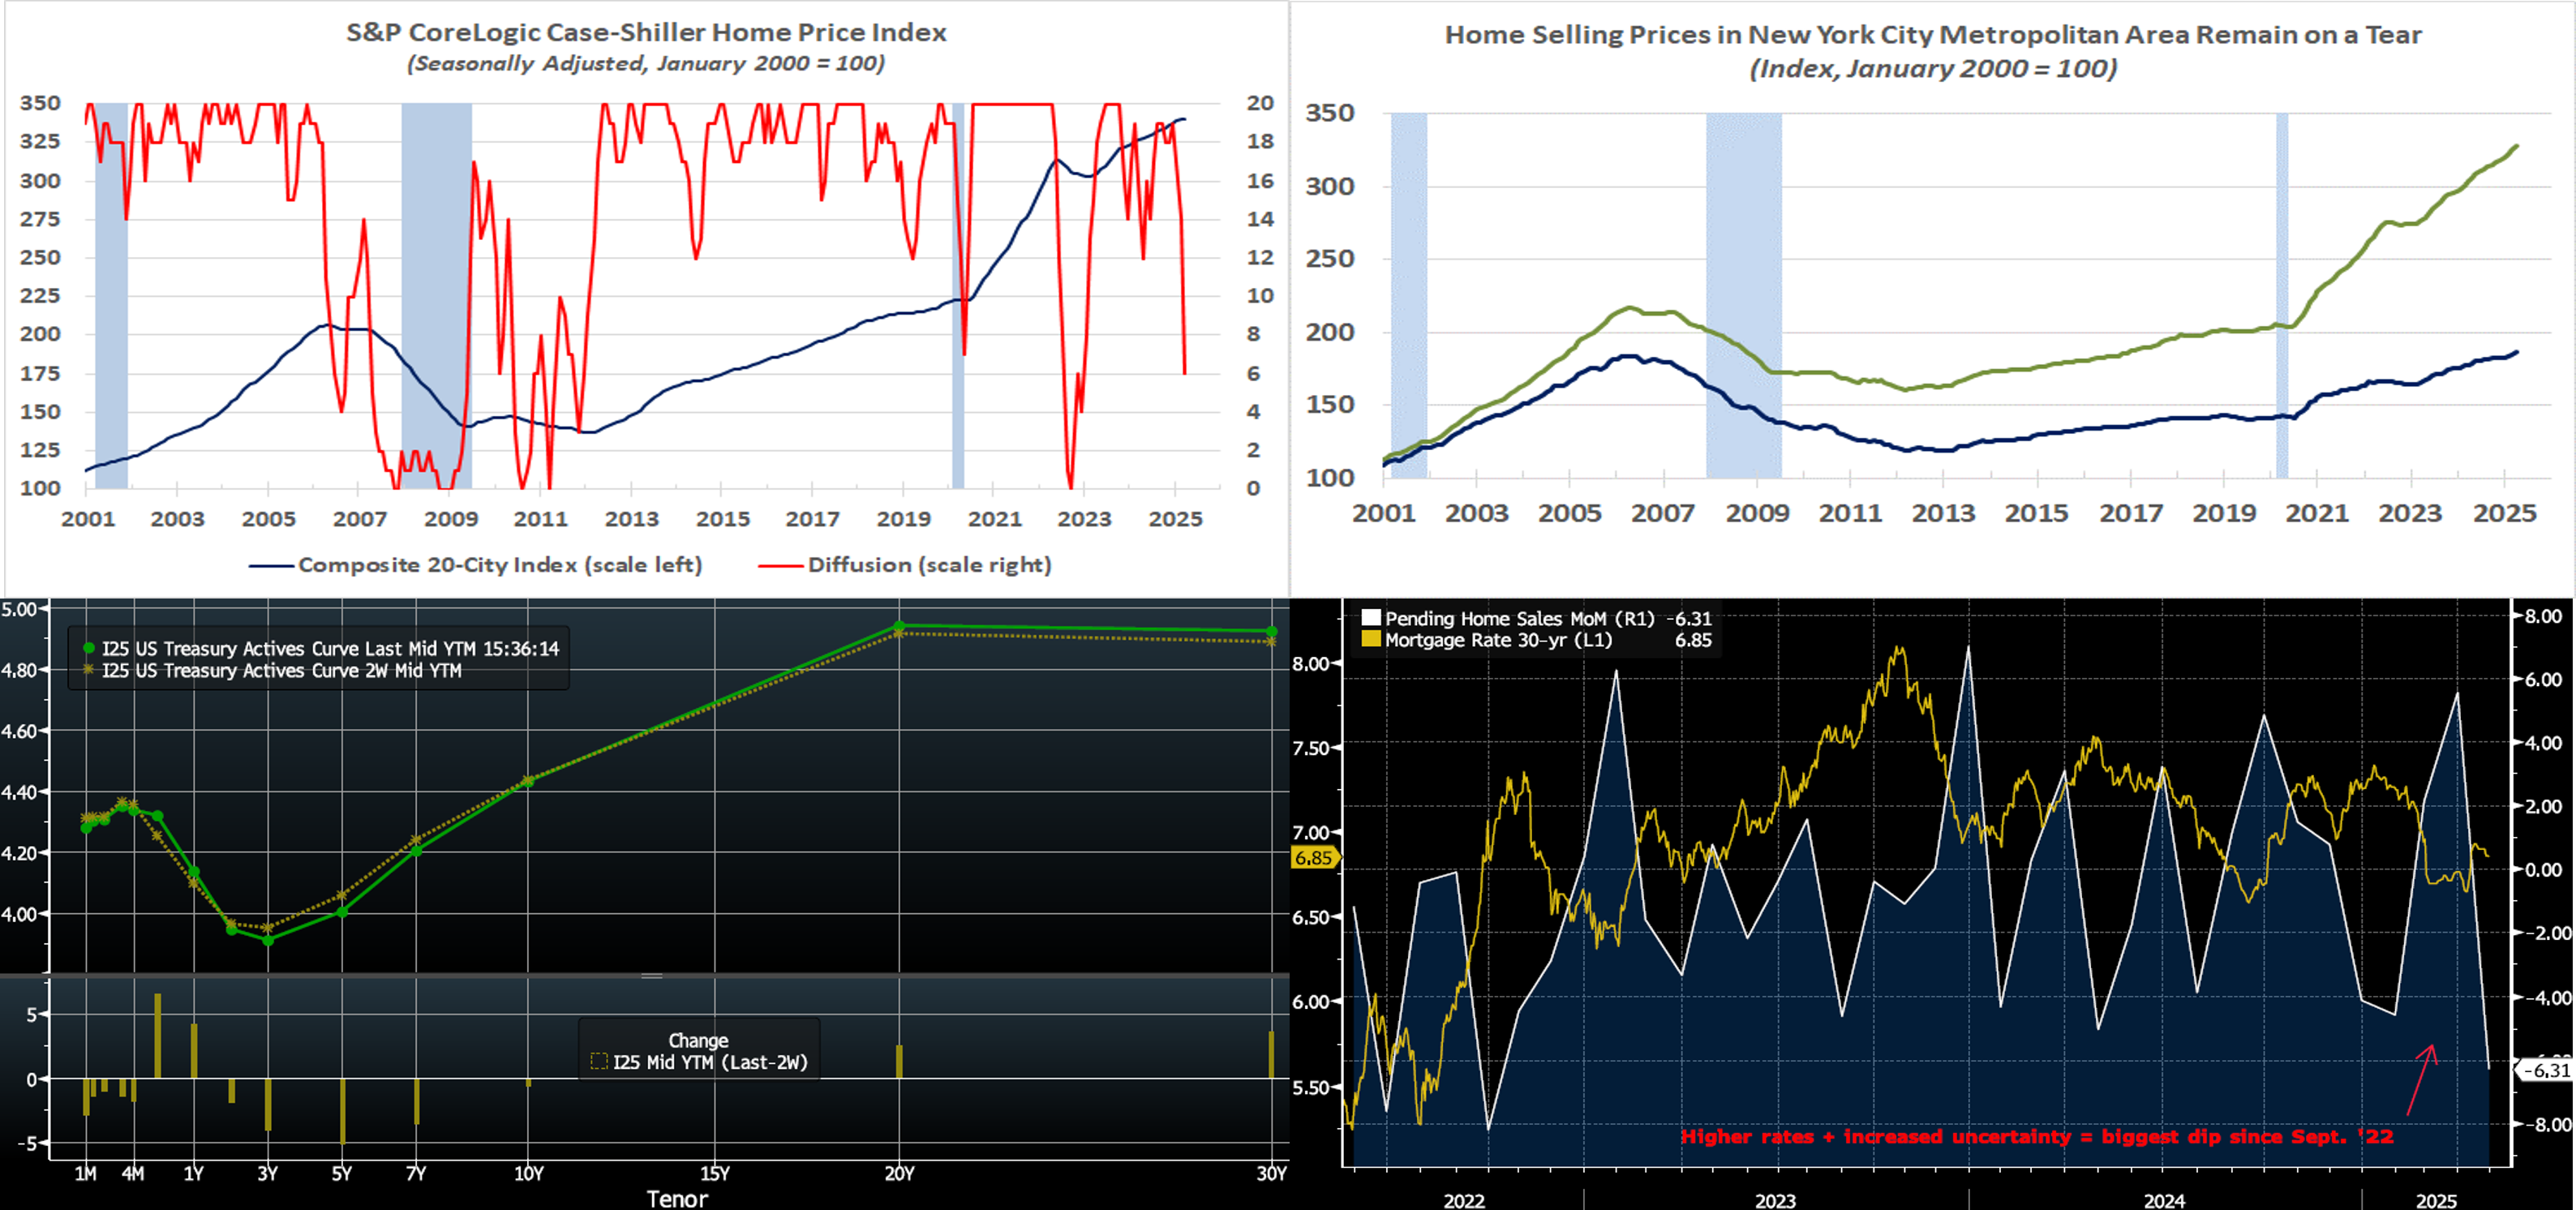
CHART 1 UPPER LEFT and CHART 2 UPPER RIGHT
Sources: Bureau of Labor Statistics; S&P CoreLogic Case-Shiller; FHLB-NY. Notes: Blue-shaded areas denote recessions. Home selling prices surprisingly weakened in March. Indeed, the S&P CoreLogic Case-Shiller (SPCLCS) gauge of sale prices across twenty major metropolitan areas dipped by .12% during the reference period – the first pullback since the beginning of 2023. Despite the reported decline, home prices remained 4.1% above those posted a year ago. Most striking perhaps was the breadth of the reported weakness in March. Just six of the cities canvassed – New York, Cleveland, Chicago, Detroit, Los Angeles, and New York – witnessed higher selling prices. Enjoying a second consecutive .9% gain, the New York City metropolitan area topped the leaderboard. Undoubtedly buoyed by the limited supply of dwellings on the market, local home prices have soared by 8% since March of last year, almost double the 4.1% increase recorded across the full sample. Moreover, the rise in nominal home selling prices across the New York City metropolitan area has outpaced the 2.9% increase in consumer prices excluding shelter costs by an impressive margin.
CHART 3 LOWER LEFT
Source: Bloomberg. Top pane is yield (LHS, %); bottom pane is change (LHS, bps). As of Thursday afternoon, the UST term curve was only modestly changed from two weeks ago at our last publication. The 5-year led the curve with a ~5 bps decline. The long end of the curve rose a few bps, as concerns about foreign demand and budget deficits hold more sway in that sector. The topic of trade policy remains front and center, but it appears that tariffs may be lower than previously announced, either by choice or by court rulings. As of late Thursday, the market prices end-2025 fed funds at 3.84%, or 6 bps higher than two weeks ago, which equates to just shy of two 25-bps Fed cuts. The market’s end-2026 forward is ~3.22%, or 8 bps lower than two weeks ago. In essence, over the past two weeks, the market “pushed out” the timing of Fed cuts.
CHART 4 LOWER RIGHT
Source: Bloomberg. Focusing again on the housing sector, data this past week revealed potentially brewing weakness in home sales. The National Association of Realtors’ index of April pending home sales (White, RHS) declined by 6.3% month-on-month, which was the largest dip since September 2022 and was well under the consensus expectation for a 1% drop. This data, in addition to a weaker-than-expected Q1 GDP report, contributed to term rates falling 3 to 5 bps on Thursday morning. Sales declined in all four U.S. regions, with the West experiencing the biggest decline of 8.9%. Given that properties typically enter contract a month or two before the closing date, pending home sales are often viewed as a leading indicator of existing-home purchase data. A rise in mortgage rates (Gold, LHS, %), in tandem with the economic uncertainty and volatile markets driven by trade policy dynamics, likely contributed to the weakness. As is evident in the chart, this index is prone to rebounds, and so it remains to be seen if the relatively less volatile environment of the past few weeks will provide a boost to sales numbers.
FHLBNY Advance Rates Observations
Front-End Rates
- As of Thursday afternoon, short-end rates were mostly unchanged vs. two weeks ago, although the 5- and 6-month were higher by 2 and 6 bps, respectively, owing to market repricing of Fed expectations for 2025. The 1-week-and-in zone was a few bps lower last week and to begin this week, but the usual month-end upward pressure in repo markets reappeared this week; for instance, SOFR rose from 4.26 to 4.33% in the past week. Robust Money Market Fund AUM levels have continued to underpin demand for short-end paper, thereby benefiting our funding spreads. Also helpful is that net T-bill supply is expected to remain modestly negative in the next few weeks, owing to debt ceiling dynamics.
- The market will focus on economic data, particularly Friday’s jobs report, and any trade policy developments in the upcoming week.
Term Rates
- The longer-term curve, generally mirroring moves in USTs and swaps, was modestly lower in the 2-to 10-year sector from two weeks prior, with the 3- to 5-year zone down by 4 bps to lead the move. Kindly refer to the previous section for color on market dynamics and changes. We encourage members to engage with the Member Services Desk for current rate levels and market color.
- On the UST term supply front, the upcoming week serves as a reprieve from auctions. Note that UST auctions usually occur at 1pm and can occasionally spur volatility around that time. Please contact the Member Services Desk for further information on market dynamics, rate levels, or products.
Price Incentives for Advances Executed Before Noon: In effect as of Tuesday, September 5, 2023, the FHLBNY is pleased to now offer price incentives for advances executed before Noon each business day. These pricing incentives offer an opportunity to provide economic value to our members, while improving cash and liquidity management for the FHLBNY. For further details, kindly refer to the Bulletin.
Looking for more information on the above topics? We’d love to speak with you!
Archives
Questions?
If you wish to receive the MSD Weekly Market Update in .pdf format (includes FHLBNY rate charts) or to discuss this content further, please email the MSD Team.