Member Services Desk
Weekly Market Update
This MSD Weekly Market Update reflects information for the week ending March 24, 2023.
Economist Views
Click to expand the below image.
The Fed increased the fed funds target range by 25 bps to 4.75%-5% and forecast, via the fresh “dot plot” and official statement, that another 25bps hike could be appropriate by year-end. It did, however, hint that another hike is uncertain. Policymakers essentially attempted to thread the needle of stressing their keen focus on wrestling down price pressures while also now paying attention to banking system threats. With the FOMC outcome (see following slide for more specific color) in the rear-view mirror, attention will return to economic data while remaining focused on any fresh banking industry developments. The latter appeared to be simmering down from the frenetic news releases and activity of a week ago but perked up as of this writing on Thursday afternoon. This upcoming week’s reports on growth and prices will provide context on the effects of the Fed policy and potential future action.
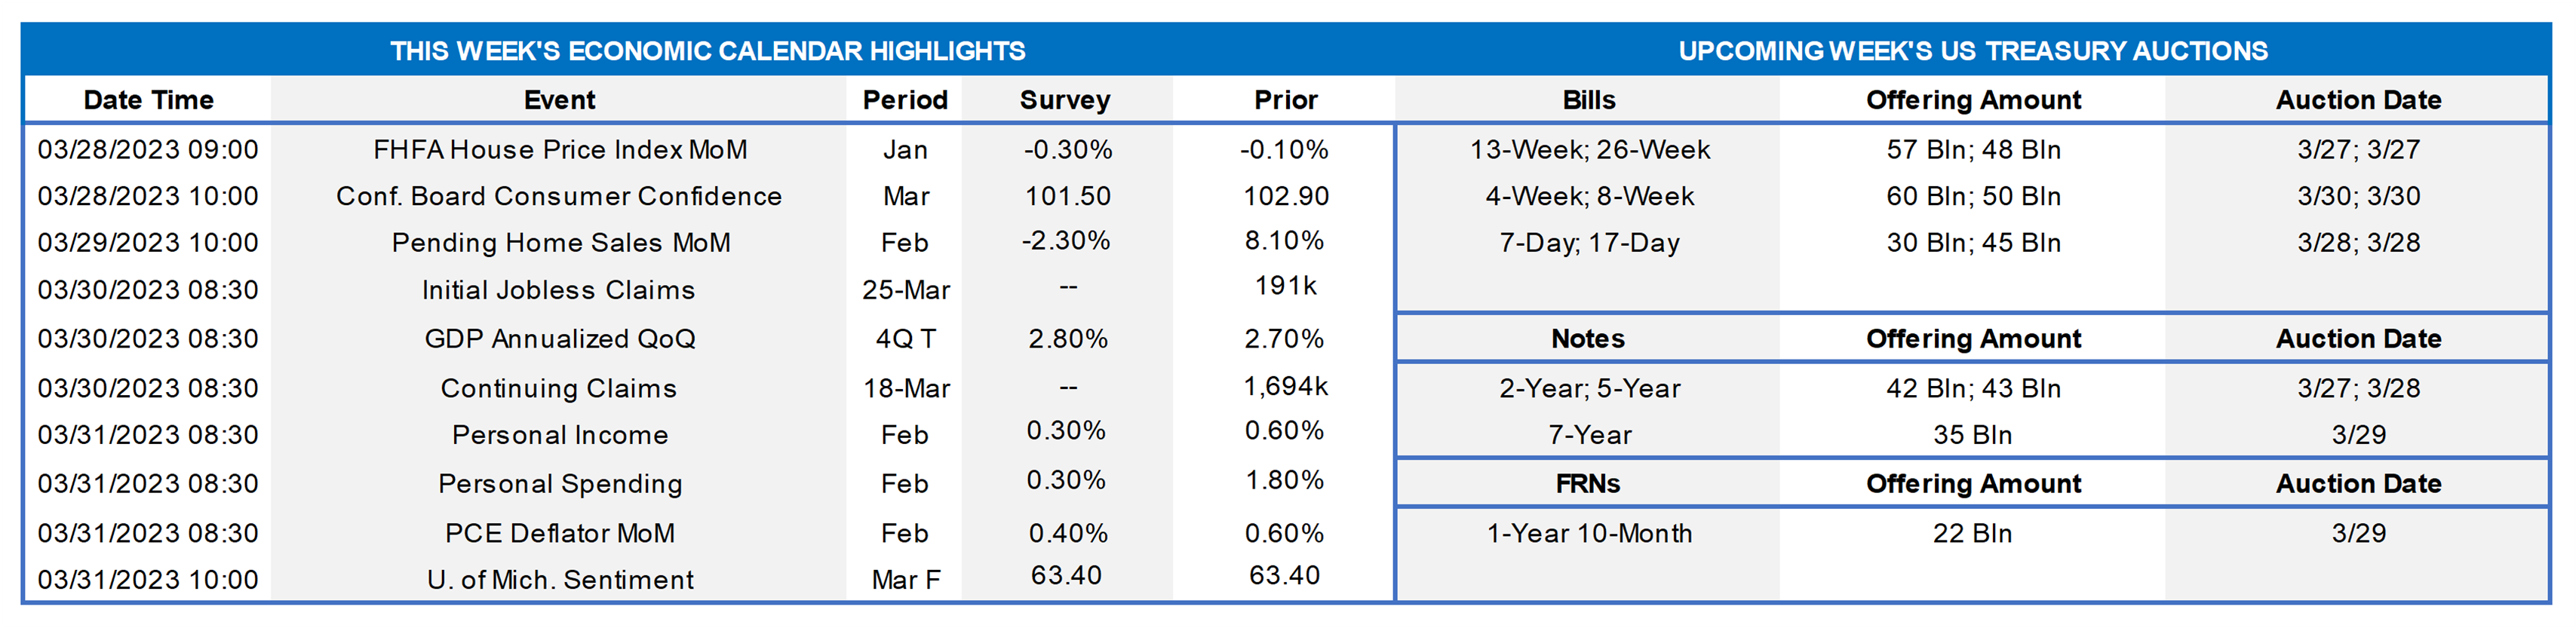
FHFA House Price Index: The price index is anticipated to show continued weakness in home selling prices, as mortgage rates remain high.
Conference Board Consumer Report: Consumer confidence is expected to show a slight pullback from last month’s reading of 102.90.
Pending Home Sales Report: Pending home sales are expected to show weakness after last months 8% jump.
Jobless Claims: Initial claims are expected to continue to hover around the 190k range.
Real GDP Growth: Survey estimates 4Q GDP to have grown at a 2.80% rate, slightly higher than the previous 2.70%.
Personal Income & Spending: Personal income and spending are projected to come through a bit weaker than last month but still in a positive range.
PCE Deflator Data: In a key report for insight on inflation forces, survey estimates for PCE deflator indicate a slightly lower reading than last month.
University of Michigan Consumer Report: The University of Michigan Sentiment report is projected to print at the same level as last month.
Federal Reserve Appearances:
- March 30: FOMC member Barkin will speak at Virginia Council of CEOs event.
- March 31: FOMC member Williams will speak at Housatonic Community College.
Please note that this report is as of Thursday afternoon and that rate levels/moves detailed herein are prone to change, especially owing to the current volatile markets. As always, please contact the Member Services Desk at 1-800-546-5101, option 1, for updates on rates and market conditions.
CHART 1 UPPER LEFT
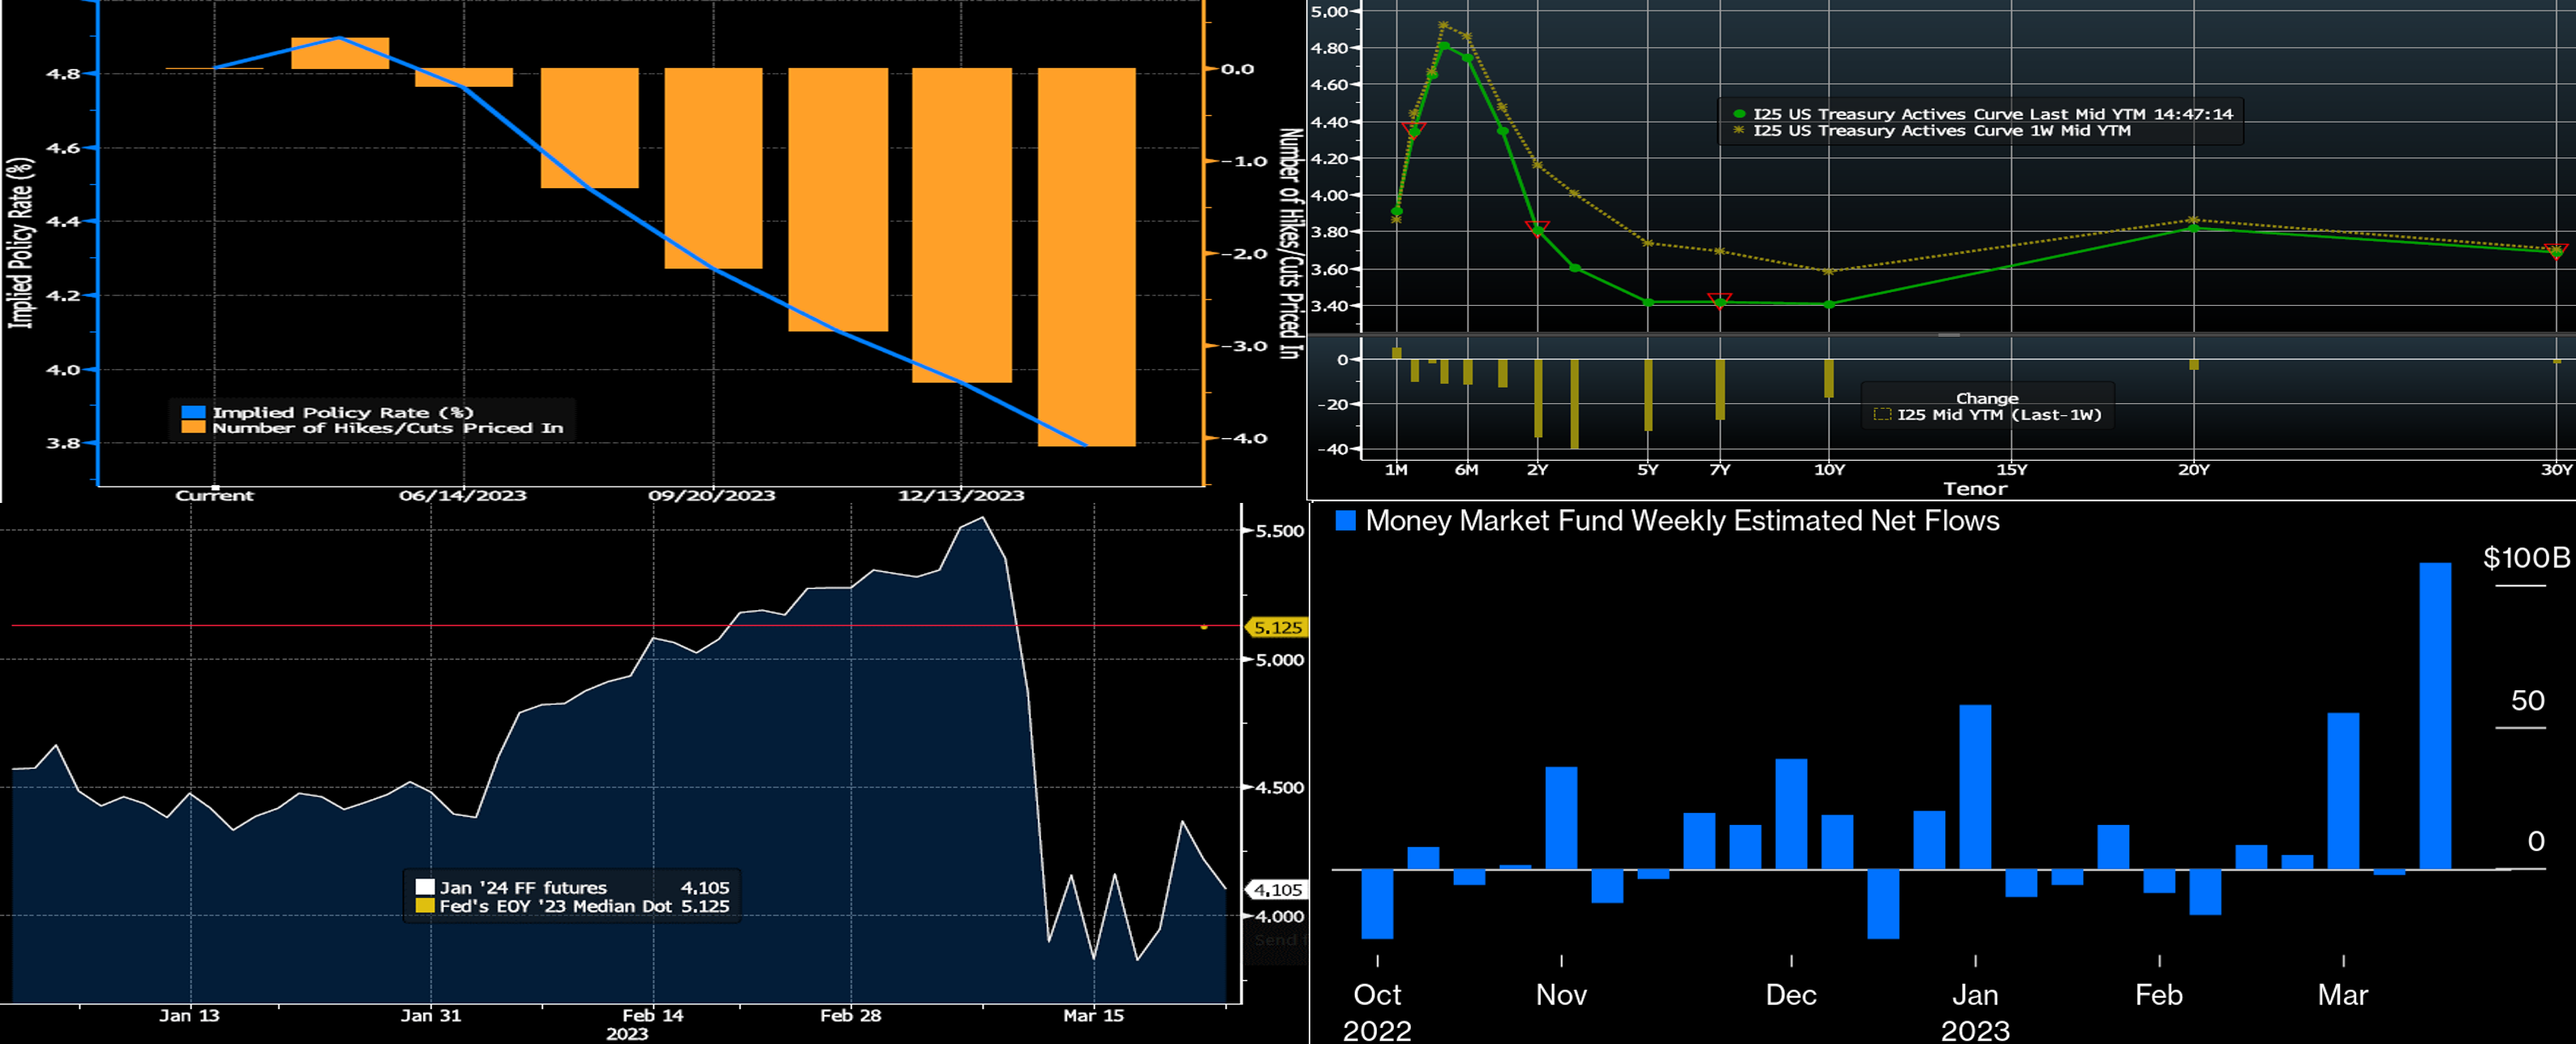
Source: Bloomberg. Here is the latest (Thursday mid-afternoon) look at market pricing (LHS is implied policy rate, RHS is number of hikes/cuts) of Fed rate policy. For the next FOMC on May 3rd, the market prices for ~33% chance of a 25 bps hike. And May is now priced as the peak rate of the tightening cycle, as the June FOMC currently prices a 53% probability of a cut! Subsequent cuts are also priced into the curve, clearly at odds with the latest Fed statement and dot plot.
CHART 2 UPPER RIGHT
Source: Bloomberg. Top pane is yield (LHS, %), bottom pane is change (bps). From last Thursday afternoon to this, UST yields were notably lower, with much of the move occurring on Thursday during this writing. While banking-related and market turmoil largely ebbed during the week, the market appears still on edge, thereby leading to lower yields in safe-haven instruments. The FOMC outcome did not deter the market from pricing in easier policy ahead, per the previous and following chart/color. The 3-year UST is ~40 bps lower from a week prior. The volatility and lower rates continue to spur good demand from the membership in term space, with a notable increase in Symmetrical-feature advances. Please call the desk to learn more products, rate levels, and market dynamics.
CHART 3 LOWER LEFT
Source: Bloomberg. Here is a clear view of how market pricing (as of early Thursday afternoon) is at odds with the Fed and its statements/projections. The Fed’s year-end 2023 median fed funds projection (red line), via its freshly revised dot plot, was again, as in this past December’s plot, at 5.125%. Also seen here is the trading path of January 2024 Fed Funds futures (RHS, %) since the start of this year. Notably, except for a roughly two-week period in late February through early March following a strong inflation report, the market’s pricing of year-end has been well short of the Fed’s projection. This trend can clearly be seen here, as well as the recent volatility of the market’s pricing which changed dramatically in response to this month’s banking industry turmoil. The fresh dot plot revealed greater dispersion overall, but for year-end 2023, there were ten dots at 5.125%, seven at 5.375% or above, and only one below 5.125%. Further volatility in this market pricing could lie ahead as new data and developments emerge. Indeed, contrary to the 4.105% in the chart, the January futures contract fell to a yield of ~3.95% while writing this section!
CHART 4 LOWER RIGHT
Source: Bloomberg; Refinitiv Lipper. Holy inflows, Batman! Shown here is the trend of weekly net investment flows (RHS, $bn) for Money Market Funds (MMFs) over the past six months. MMFs have experienced massive inflows in the past two weeks, driven by bank deposit outflows, relatively more attractive rates in MMFs, desire to park funds in short tenors pre-FOMC meeting, and the safe-haven aspect of a vehicle that heavily invests in T-bills and the Fed’s RRP. MMFs also invest in agency instruments such as FHLB paper, thereby providing an important link in our mission of providing members with reliable liquidity in support of housing and local community development.
FHLBNY Advance Rates Observations
Front-End Rates
- Short-end rates were notably lower week-over-week from last Thursday afternoon. Essentially, the severe market turbulence of the prior week abated this week and thereby allowed for much better issuance levels and, in turn, lower advance levels during the past few days. Levels were 7 to 50 bps lower, with the longer tenors leading the move. Please see the previous section for more specific Fed-pricing color.
- Economic data should dictate direction. Given the recent banking and financial market turmoil, rates may remain volatile.
Term Rates
- The longer-term curve, generally mirroring moves in USTs and swaps, was lower and steeper Thursday-to-Thursday afternoon. The 3-year led the move, down by ~34 bps, with the 10-year ~ 12 bps lower. Kindly refer to the previous section for relevant market color. The advance curve remains inverted out to 5-year, thereby offering opportunities to extend in advance duration at lower coupon cost.
- On the UST term supply front, this upcoming week serves 2/5/7-year auctions. Banking and Fed-speak headlines will likely rule the week. Corporate bond issuance should perk up, as the FOMC meeting is in the rearview mirror and financial system woes have quieted somewhat for now. Kindly call the Member Services Desk for information on market dynamics, rate levels, or products.
Product Alert: FHLBNY is pleased to announce the reintroduction, after a temporary suspension owing to Libor-cessation, of the Putable Advance, Fixed-Rate with SOFR Cap Advance, and ARC with SOFR Cap/Floor Advance. The Callable Advance continues to be offered. This expansion of the product menu will provide members with more options and flexibility for the management of funding and/or hedging needs.
Forward Start Advance (FSA): For members with upcoming borrowing or refunding plans, consider the FSA as a method to opportunistically “lock in” rates before advance settlement date. Please contact the Member Services Desk at (212) 441-6600 for more information.
The Symmetrical Prepayment Advance Feature
For those anticipating term funding needs, and with rates on an uptrend, it can be an appropriate juncture to consider our SPA feature. This feature allows the member to capture, at prepayment, changes in the fair value of the advance which are favorable to the member. Contact Member Services Desk to discuss.
Looking for more information on the above topics? We’d love to speak with you!
Questions?
If you wish to receive the MSD Weekly Market Update in .pdf format (includes FHLBNY rate charts) or to discuss this content further, please email the MSD Team.