Member Services Desk
Weekly Market Update
This MSD Weekly Market Update reflects information for the week of April 19, 2021.
Economist Views
Click to expand the below image.
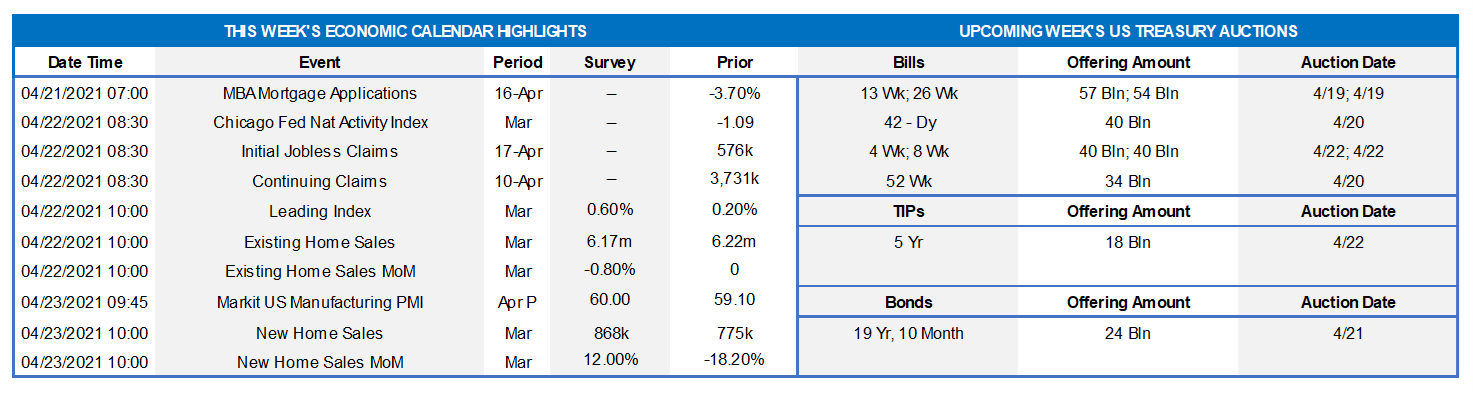
With only a handful of second-tier economic reports slated for release, market participants will enjoy a well-deserved rest this coming week. The total number of persons receiving some form of unemployment assistance probably moved lower in the latest period. Hinting at further gains in real GDP over the balance of 2021, the Index of Leading Economic Indicators probably not only rose in March but did so at a faster pace than in February. Echoing already released regional canvasses, the Kansas City Fed’s gauge of local manufacturing activity probably moved higher. The latest housing-related reports likely will be mixed with resales retreating and new home purchases rebounding in March. Observing the traditional blackout period before the next Federal Open Market Committee meeting on April 27-28, there will be no public appearances by Federal Reserve officials this week.
Jobless Claims: Initial and continuing claims under regular state unemployment insurance programs likely moved lower during their respective reporting periods. Despite ongoing improvements, those figures continue to understate the adverse impact of the pandemic and the slow healing of the domestic labor market, however. Indeed, as of March 27, a little over 16.9mn persons were receiving some sort of unemployment assistance, down from the pandemic peak of 32.4mn reached last June but still well above the level prevailing before the pandemic began in March 2020.
Index of Leading Economic Indicators: The Conference Board’s barometer of prospective economic activity is expected to have risen for an 11th consecutive month in March and at the fastest pace since last November.
Existing Home Sales: Recent pullbacks in dwellings entering contract suggest that existing home sales fell by 6.6% to a nine-month low seasonally adjusted annual rate of 5.81mn in March. With homes available for sale expected to have climbed to 1.05mn from February’s 1.03mn record low, the stock of dwellings on the market likely rose by two ticks to 2.2 months’ supply.
Kansas City Federal Reserve Bank Manufacturing Activity Index: Upbeat canvasses from the New York and Philadelphia districts hint that the Kansas City bank’s composite factory activity gauge probably improved on the all-time high reading of 26 recorded last month.
New Home Sales: Reported increases in single-family building permits and housing starts suggest that the number of newly constructed dwellings entering contract climbed by 11.6% to a seasonally adjusted annual rate of 865K in March, reversing approximately half of February’s weather-related dive.
Federal Reserve Appearances: No scheduled appearances.
Click to expand the below images.
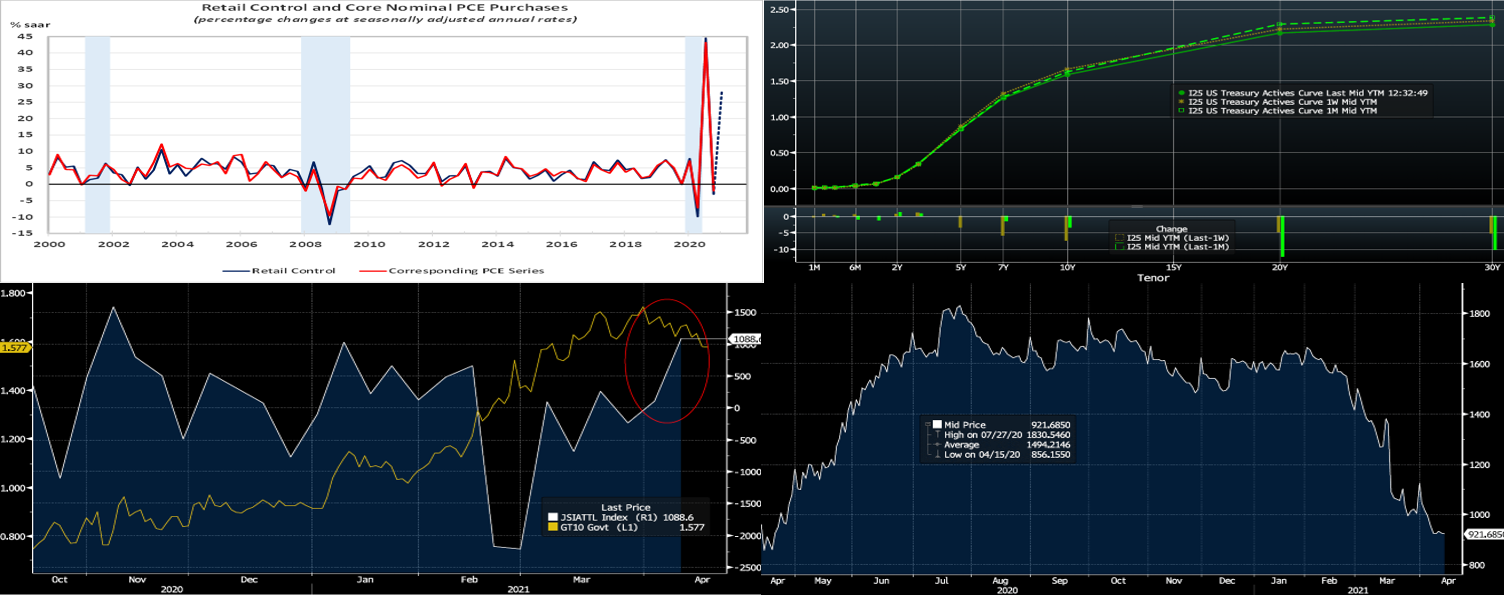
CHART 1 – UPPER LEFT
Source: Dept. of Commerce, FHLBNY; shaded areas denote recessions. Stimulus checks, hiring, and business reopening propelled retail and food services sales sharply higher in March. Indeed, retail purchases soared by 9.8% last month, following a 2.7% drop in February and a 7.7% jump in January. March’s sales gain was well above the 5.8% increase forecast by the Street and marked the largest rise since last May’s 18.3% leap. All major segments saw revenues rise during the reference period, with many enjoying double-digit sales gains. Restaurants posted a solid 13.4% sales increase. Excluding outlays on autos, building materials and gas, so-called retail control – the portion of the report that is used by the Bureau of Economic Analysis to estimate nominal consumer goods spending – expanded by 6.8%, after a 3.4% February decline. The latest figures placed control purchases over Q1 at 28.1% annualized above their fall-quarter average, hinting at a sizable contribution from the consumer to Q1 real GDP growth.
CHART 2 – UPPER RIGHT
Source: Bloomberg. Note: top pane is yield (%), bottom pane is change (bps). Led by the 7 to 10-year sector of the curve, UST yields again dipped lower week-over-week. While shorter maturities were modestly changed, the rest of the curve finished ~3 to 7 bps lower. Most of the decrease occurred on Thursday and was perplexing, given the week’s strong economic data releases, and so the moves were attributed to mostly technical factors such as foreign investor buying, short-covering, unwinds of curve “steepener” trades, investors extending out the curve from money markets, and buying/re-allocating by US real money investors such as pension funds. Such technical episodes tend to flare and then give way to fundamentals, and so the week’s moves may soon stall. Covid-19 variants and some vaccine obstacles (J&J shot on pause, hesitancy) persist, but the accelerating trend in vaccinations continues to bolster economic activity and projections which, in turn, may continue to underpin the yield curve. Indeed, the week closed on a quiet note without follow-through on Thursday’s move.
CHART 3 – LOWER LEFT
Source: Bloomberg. Some of the past week’s yield decrease was attributed to foreign investor buying, as noted above. Portrayed here is “Japan Weekly Securities Investment Abroad Total Net” purchase data (RHS, Yen bn) vs. the 10-year UST yield (LHS, %). Japanese funds are regular participants in the UST market, and they purchased ~$10bn (equivalent of 1089bn Yen) of US securities in early April to start their new fiscal year. With paltry yields across much of the global fixed income universe, foreign demand for US securities should continue to be a factor in the markets.
CHART 4 – LOWER RIGHT
Source: Bloomberg. Depicted here is the US Treasury’s Cash Balance (RHS, $bn), commonly referred to as the Treasury General Account (TGA) at the Fed. The TGA is the general checking account which the Treasury uses and from which the government makes its official payments and where proceeds from UST debt sales are placed. The TGA has been on a rapid decline thus far in 2021 and is expected by market-watchers, as funds continue to be put to work in programs, to fall towards $500bn by mid-year. This trend should continue to infuse funds into the banking system and money markets.
FHLBNY Advance Rates Observations
Front-End Rates
Short-end advance rates again finished mostly unchanged week-over-week. Money Market Funds’ AUM dropped by ~$29bn on the week, led by a $20.1bn dip in Government-Only funds, in which investors were possibly moving out the curve in search of some yield. Nonetheless, short rates were steady. The GSEs are placing larger sums into money markets. And the US TGA, as evidenced on the prior slide, continues its decline. From a bigger-picture vantage point, the overall moderation in the supply of short paper, relative to high cash levels in the market, is expected to keep short-end rates relatively steady and under downward pressure in the year’s first half.
UST issuance overall is now net positive supply in that more is being issued than what the Fed is buying in its programs. However, with short UST rates at rock-bottom levels and the Fed on hold for a long period, rates are likely to persist in a near-term sideways to softer pattern. Importantly, weekly net T-bill issuance has been lower since 2020 and even negative at times in recent months, and Treasury has announced plans to shift issuance out the curve. The latest relief package and related borrowing likely will lead to an increase of T-bill auction sizes and positive net supply, but overall market supply/demand dynamics should keep short rates in check on the upside.
Term Rates
On the week, medium and longer-term Advance rates were ~2 to 8 bps lower, with the largest decreases in the 7 to 10-year sector. Kindly refer to the previous section for further color on relevant market dynamics.
On the UST supply front, this week ends a reprieve and brings a 20-year nominal and a 5-year TIPS auction. Recent auction sizes have been of record size and a contributor to the curve’s moves in Q1. In a quieter data week, the market will retain focus on further Covid-19 and infrastructure bill developments, while also monitoring the technical factors of the past week, for any signs of market-moving potential.
New Product Alert: In order to satisfy member needs and provide greater product flexibility to match bond and derivative market conventions, FHLB-NY now offers SOFR-linked advances based on SOFR-index compounding. Note that this product is in addition to SOFR-linked advances based on SOFR-index averaging which have been offered since November 2018.
The Symmetrical Prepayment Advance Feature
With rates at or near multi-year lows, it is a compelling juncture to use the SPA feature on term advances. This feature allows member to capture, at prepayment, changes in the Fair Value of the advance which are favorable to the member. Contact us to discuss.
Looking for more information on the above topics? We’d love to speak with you!
Questions?
If you wish to receive the MSD Weekly Market Update in .pdf format (includes FHLBNY rate charts) or to discuss this content further, please email the
MSD Team.
Special Member Alert
The FHLBNY recently announced a newly expanded and flexible Disaster Relief Funding (DRF) advance program which offers discounted rate advances with maturities 1-mo and greater. Additionally, we have announced that PPP loans will be accepted as eligible collateral. Please contact us with any questions.