Member Services Desk
Weekly Market Update
This MSD Weekly Market Update reflects information for the week ending August 25, 2023.
Economist Views
Click to expand the below image.
Please note that the Weekly Update will return on September 8th; enjoy the Labor Day holiday.
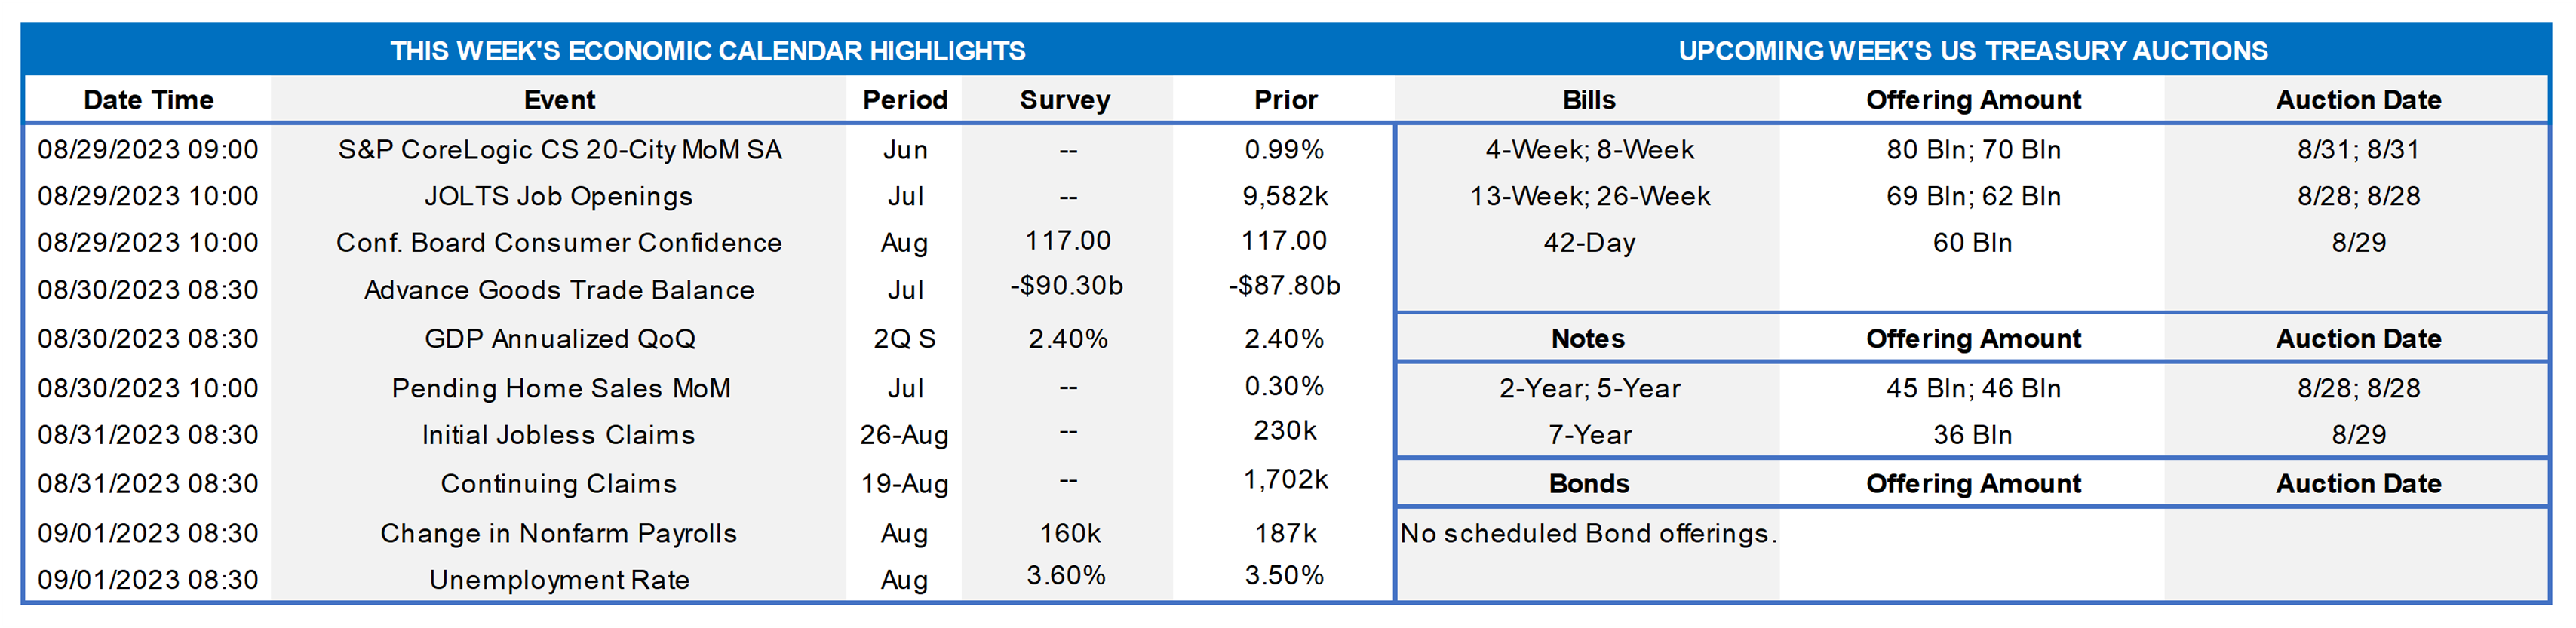
A crowded release calendar is upcoming, and the marquee report will undoubtedly be the Bureau of Labor Statistics update on the employment situation in August. Payroll employment growth probably quickened last month, while the jobless rate clocked in near a half-century low. An early canvassing period may result in a smaller-than-expected rise in average hourly earnings, adding to hopes that wage inflation is moderating. The remaining figures likely will be mixed. On the positive side, real GDP growth during Q2 appears poised for a markup. Solid demand amid limited supply probably boosted home selling prices in June, while purchase-contract signings stabilized in July. On the negative side, consumer confidence is expected to have paused in August, after a prior-month surge, while the ongoing contraction in nationwide factory activity continued through August. A trio of Federal Reserve officials, all non-FOMC voters, will discuss a variety of timely topics.
S&P CoreLogic Case-Shiller (SPCLCS) 20-City Home Price Index: Home prices probably edged .7% higher in June across the twenty major metropolitan areas canvassed by SPCLCS, boosting the cumulative rise over the latest four months to 3%. Despite the anticipated increase, the average selling price nationwide would remain 1.7% below that recorded 12 months earlier.
JOLTS Job Openings: A reported rise in online help-wanted postings suggests that nationwide job openings rebounded by 36K to 9.62mn in June, completely erasing June’s similarly modest decline. At an estimated 3.78mn, the excess of vacant positions nationwide would represent 1.65 jobs per unemployed person.
Conference Board Consumer Confidence: Available soundings hint that the gauge likely retreated to 115.5 in August from the two-year high of 117 posted in the previous month.
Real GDP Growth: Data released after the BEA’s advance report point to an upward revision to real GDP growth during the summer quarter from last month’s initial 2.4% annualized print.
Pending Home Sales: Capped by the ongoing dearth of dwellings on the market, contracts to purchase a home probably were little changed in July, after a modest .3% uptick in June.
Employment Situation Report: Conditions likely remained extremely tight as the summer quarter progressed. Nonagricultural businesses probably added 230K net new workers in August, eclipsing the 187K gain recorded in July. Weekly jobless claims reports and consumer-sentiment soundings suggest that the civilian unemployment rate held steady at 3.5% during the reference period – just two ticks above the half-century low posted in January. Capped by an early establishment survey period ending precisely on the 12th of the month, average hourly earnings likely edged .2% higher during the reference period – the smallest gain in 17 months. If realized, that result would place nominal compensation 4.2% above the $32.43 per hour received a year earlier.
Construction Spending: The nominal value of new construction put-in-place is expected to have risen by .6% in July, boosting the cumulative increase since the end of last year to 5.8%.
ISM Manufacturing Activity Index: The contraction in nationwide manufacturing activity likely marked its tenth month in August. District Federal Reserve Bank canvasses and other surveys suggest that the Purchasing Managers Index edged slightly lower to 45.8% from 46.4% in July.
Federal Reserve Appearances:
- Aug. 31 Atlanta Fed President Bostic to give a speech and take part in a panel discussion at the South African Reserve Bank.
- Sept. 1 Atlanta Fed President Bostic to take part in panel discussion and discuss US monetary policy with foreign officials.
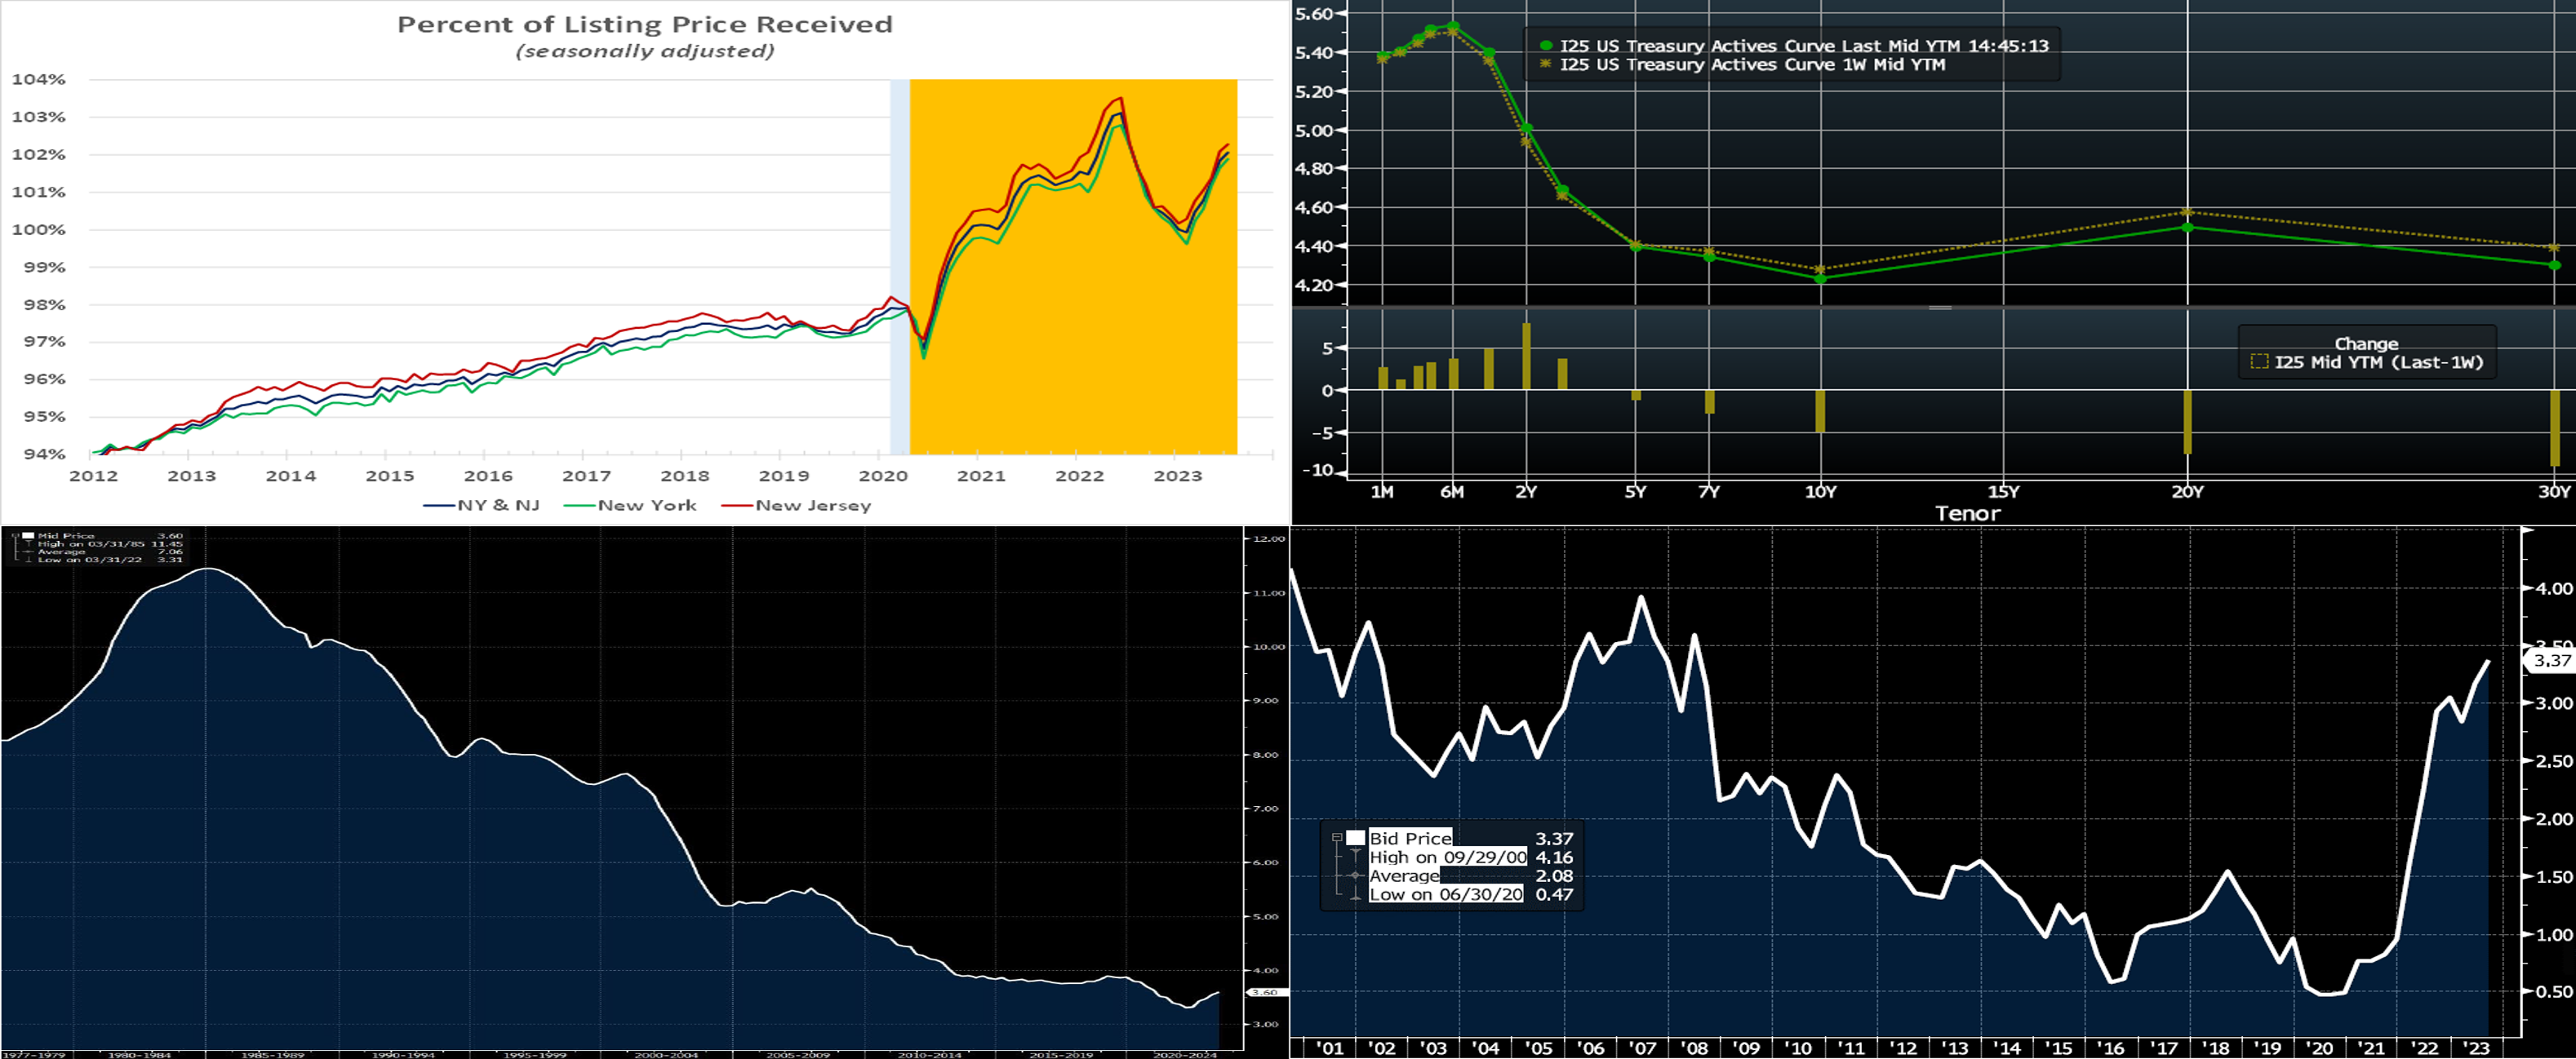
CHART 1 UPPER LEFT
Source: NYSAR; NJ Realtors; FHLB-NY estimates. Notes: Blue-shaded area denotes recession; orange-shaded area highlights current economic expansion. Residential housing remains a sellers’ market across most of the FHLB-NY district. Realtor reports for July revealed that the number of homes on the market in the Empire and Garden States fell by an estimated 4.7% to just 41,724 dwellings after seasonal adjustment – a whopping 31.4% below the 60,804 available a year ago. While the median selling price retreated by .5% to $416.3K during the reference period, that pullback masked ongoing competition among buyers, especially in more affordable markets. Indeed, sellers were receiving 2.1% above listing price on average in July – a significant firming from the “at asking price” witnessed at the beginning of the year. A contributing factor to low supply/turnover has been homeowners locked into low and far in-the-money mortgage rates; see Chart 3 below for further illumination.
CHART 2 UPPER RIGHT
Source: Bloomberg. Top pane is yield (LHS, %), bottom pane is change (LHS, bps). From last Thursday afternoon to this one, the curve modestly flattened, with shorter maturities up a few bps but 5-year and longer tenors lower by 3 to 8 bps. Economic data was light, and the markets await remarks from Fed Chair Powell at the end-of-week Jackson Hole confab. Global and UST yields retreated from early-week higher levels that matched multi-year highs, perhaps on short-covering and investors attracted to the higher levels. In terms of market-implied pricing of the Fed, the 2023 peak Fed Funds rate in November now stands at ~5.47%, up from 5.44% last week. Essentially, the market is pricing ~56% chance of another 25 bp hike this year. The year-end forward is ~5.455%, or ~4 bps higher than last week. The years 2024 and 2025 moved slightly higher from a week ago, with the year-end 2024 forward ~6 bps higher, at 4.31%, from a week ago, as the market increasingly perceives a “higher for longer” Fed path. Please call the Member Services Desk for further information on market dynamics and/or products.
CHART 3 LOWER LEFT
Source: Bloomberg. Enlarge for a clearer view. Shown here is a long-term (quarterly looks back to January 1977, RHS, %) view of the effective rate of interest on U.S. mortgage debt outstanding. While it has risen a bit in the last year, it is clearly still near all-time lows and below pre-pandemic levels, despite current mortgage rates (~7.35%) being at their highest in more than twenty years. Essentially, there are large cohorts of mortgagees who locked in lower rates over the past few years and are “staying put” for now; consequently, housing turnover/supply has been hampered and refinancings have plunged. The dynamic has also likely helped underpin consumer spending behavior. Naturally, as time passes, older mortgages will get paid off for one reason or another (maturity, relocations, estate sales, etc.), and so the mix and effective rate should change. But thus far, this dynamic has perhaps made the Fed’s job trickier and the impact of its hikes to have a longer lag.
CHART 4 LOWER RIGHT
Source: Bloomberg. Sticking with long-term vantage points on rates, here is a 25-year history of the Bloomberg global aggregate government bond yield index (RHS, %). It is finally back up to pre-Great Financial Crisis levels. Gone are the days of a few years ago when there were substantial amounts of negative-yielding foreign bonds. The swift rise in yields of the past year-and-a-half has been a global theme, with many central banks raising rates off the “zero-bound.” Indeed, global central bankers are currently discussing policy at the annual Jackson Hole gathering. While the FHLB System is U.S.-centric, its bonds are purchased by global investors and its debt is priced relative to USTs, which, in turn, compete with and are impacted by global yield trends. And, in turn, those trends impact our advance rates.
FHLBNY Advance Rates Observations
Front-End Rates
- Short-end rates were 1 to 3 bps higher week-over-week, moving higher in sympathy with slightly increased odds of another Fed hike priced by the markets. Net T-bill supply remains robust and is expected to experience further upticks, given the recent announcements from the Treasury regarding upsized auctions and issuance needs. But the supply continues to be absorbed well as Money Market Funds (MMFs) switch from the Fed’s RRP to T-bills with competitive yields. Moreover, FHLB supply has subsided from peak levels of spring, further assisting T-bill interest from investors and thereby containing any severe upward pressure on rates from T-bill supply.
- Economic data, especially Friday’s jobs report, should drive direction this upcoming week.
Term Rates
- The longer-term curve, generally mirroring the moves in USTs and swaps, flattened week-on-week, with 4-year-and-out tenors dipping 5 to 10 bps, while shorter tenors were a few bps lower to unchanged. The advance curve remains inverted out to 5-year, thereby offering opportunities to extend in advance duration at lower coupon cost. Kindly refer to the previous section for relevant market color.
- On the UST term supply front, the upcoming week serves 2/5/7-year auctions early in the week. Note that UST auctions usually occur at 1pm and can cause volatility near that time. Please contact the Member Services Desk for further information on market dynamics, rate levels, or products.
Price Incentives for Advances Executed Before Noon – Starting Tuesday, September 5, 2023 – The FHLB-NY is pleased to announce that beginning Tuesday, September 5, 2023, we will introduce price incentives for advances executed before Noon each business day. These pricing incentives offer an opportunity to provide economic value to our members, while improving cash and liquidity management for the FHLBNY. For further details, kindly refer to the bulletin.
Forward Start Advance (FSA): For members with upcoming borrowing or refunding plans, consider the FSA as a method to opportunistically “lock in” rates before advance settlement date. Please contact the Member Services Desk at (212) 441-6600 for more information.
The Symmetrical Prepayment Advance Feature
For those anticipating term funding needs, and with rates on an uptrend, it can be an appropriate juncture to consider our SPA feature. This feature allows the member to capture, at prepayment, changes in the fair value of the advance which are favorable to the member. Contact Member Services Desk to discuss.
Looking for more information on the above topics? We’d love to speak with you!
Questions?
If you wish to receive the MSD Weekly Market Update in .pdf format (includes FHLBNY rate charts) or to discuss this content further, please email the MSD Team.