Member Services Desk
Weekly Market Update
Economist Views
Click to expand the below image.
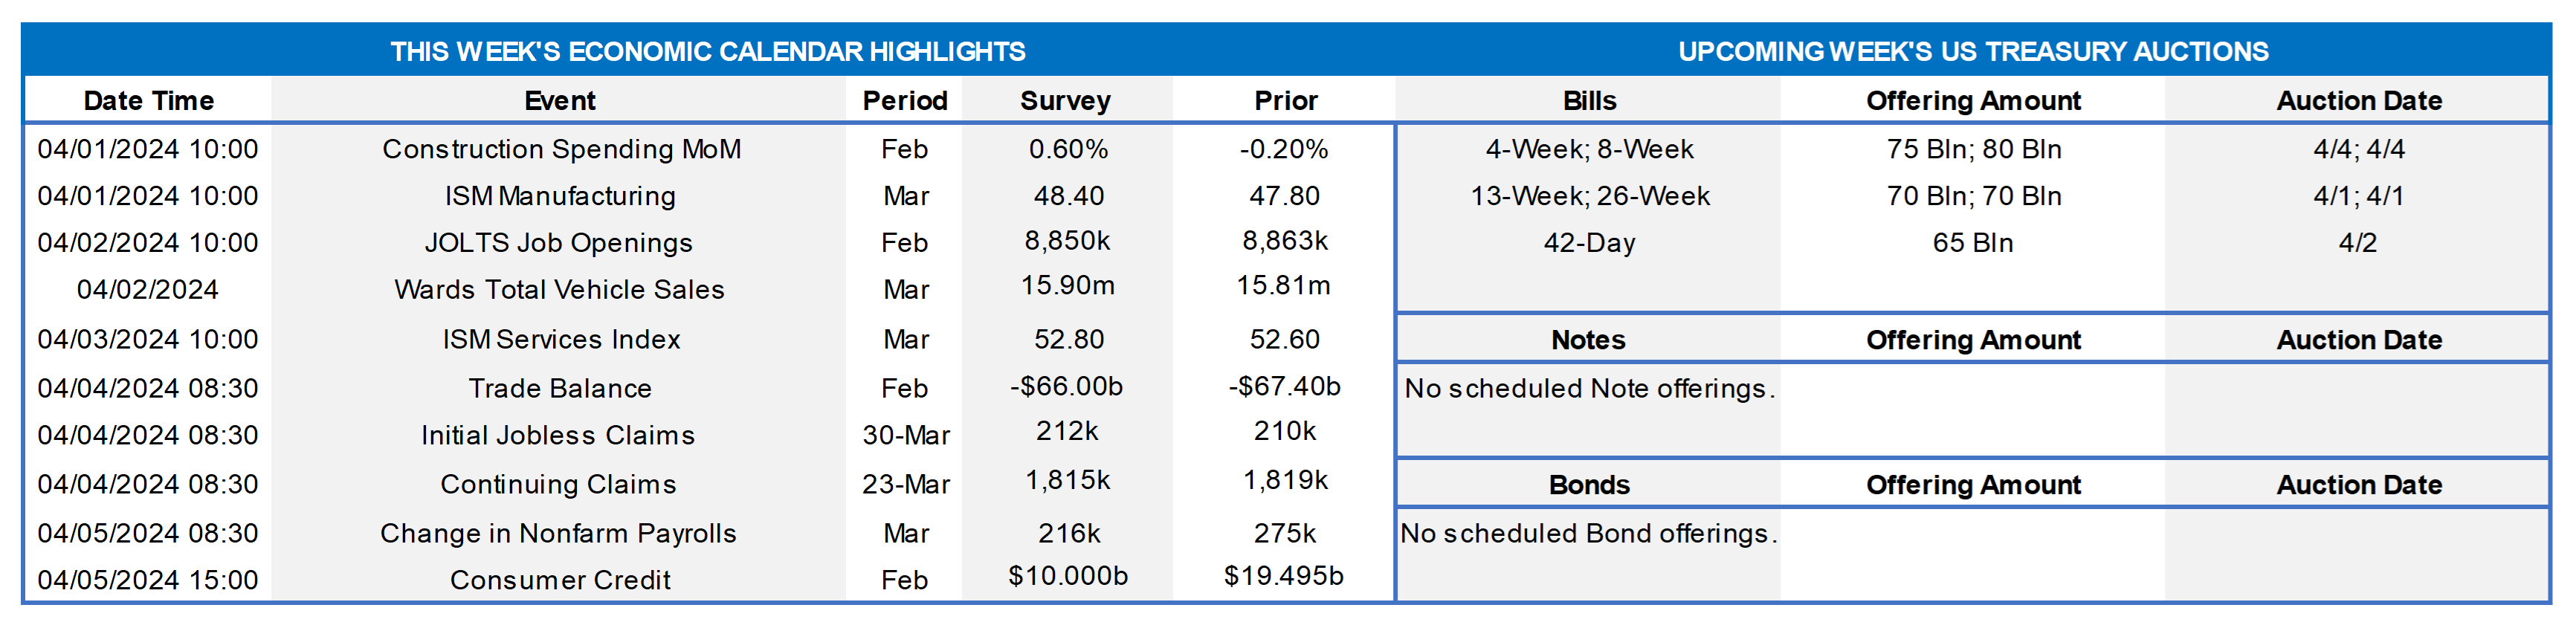
Construction Spending: Buoyed by favorable weather, the nominal value of new construction put-in-place is expected to have risen by .6% in February, erasing a .2% dip recorded in the prior month.
ISM Manufacturing Activity Index: Available canvasses suggest that nationwide activity contracted for a 17th straight month in March, with the index retreating to 47.2% from 47.8% in February.
Unit Motor Vehicle Sales: Supported by manufacturers’ discounts and increased availability of lease deals, unit motor vehicles purchases – a direct input into the Bureau of Economic Analysis’ real consumer spending estimates – likely rose by 3.1% to a three-year high seasonally adjusted annual rate of 16.3mn in March.
JOLTS Job Openings: A reported jump in online help-wanted postings suggests that nationwide job openings rose by 275K to a five-month high of 9.14mn in February. At an estimated 2.68mn, the excess of vacant positions nationwide would represent a little over 1.4 jobs per unemployed person.
Factory Orders: Stepped-up bookings of both durable and nondurable goods probably boosted factory orders by 1% in February, reversing one quarter of January’s reported decline.
ISM Services Activity Index: The expansion in activity likely continued for a 15th straight month in March, but the breadth of gains probably narrowed slightly to 52.1% from 52.6% in February.
Jobless Claims: Initial claims for unemployment benefits probably remained rangebound between 200-220K during the filing period ended March 30th. Continuing claims – the total number of persons collecting benefits – likely registered slightly above the 1.8mn mark during the week ended March 23 – a sign that the recently unemployed are having little problem finding work.
Employment Situation Report: Conditions likely remained tight in March. Positively impacted by mild weather during the period, nonfarm payrolls likely expanded by 275K, matching the larger-than-expected job gain witnessed in February. Data on the state insured unemployment rate collected after the February canvass period hint that the jobless gauge may have moved one tick lower to 3.8%. With the BLS’ collection period including the 15th of the month, the rise in average hourly earnings during the reference period probably will outpace the .3% uptick anticipated by the Street.
Consumer Credit: Consumer installment credit likely expanded by $16bn in February, following a larger-than-expected $19.5bn takedown at the beginning of 2024.
Federal Reserve Appearances:
- Apr. 2 New York Fed President Williams to moderate a discussion at the Economic Club of NY with Prof. Jeremy Siegel.
- Apr. 2 Cleveland Fed President Mester to give remarks on the outlook at Cleveland Assn for Business Economics luncheon.
- Apr. 3 Fed Chair Jerome Powell to speak at Stanford Business School’s Government and Society Forum.
- Apr. 4 Chicago Fed President Goolsbee to speak at a moderated Q&A with the Multi-Chamber Eco Outlook Luncheon.
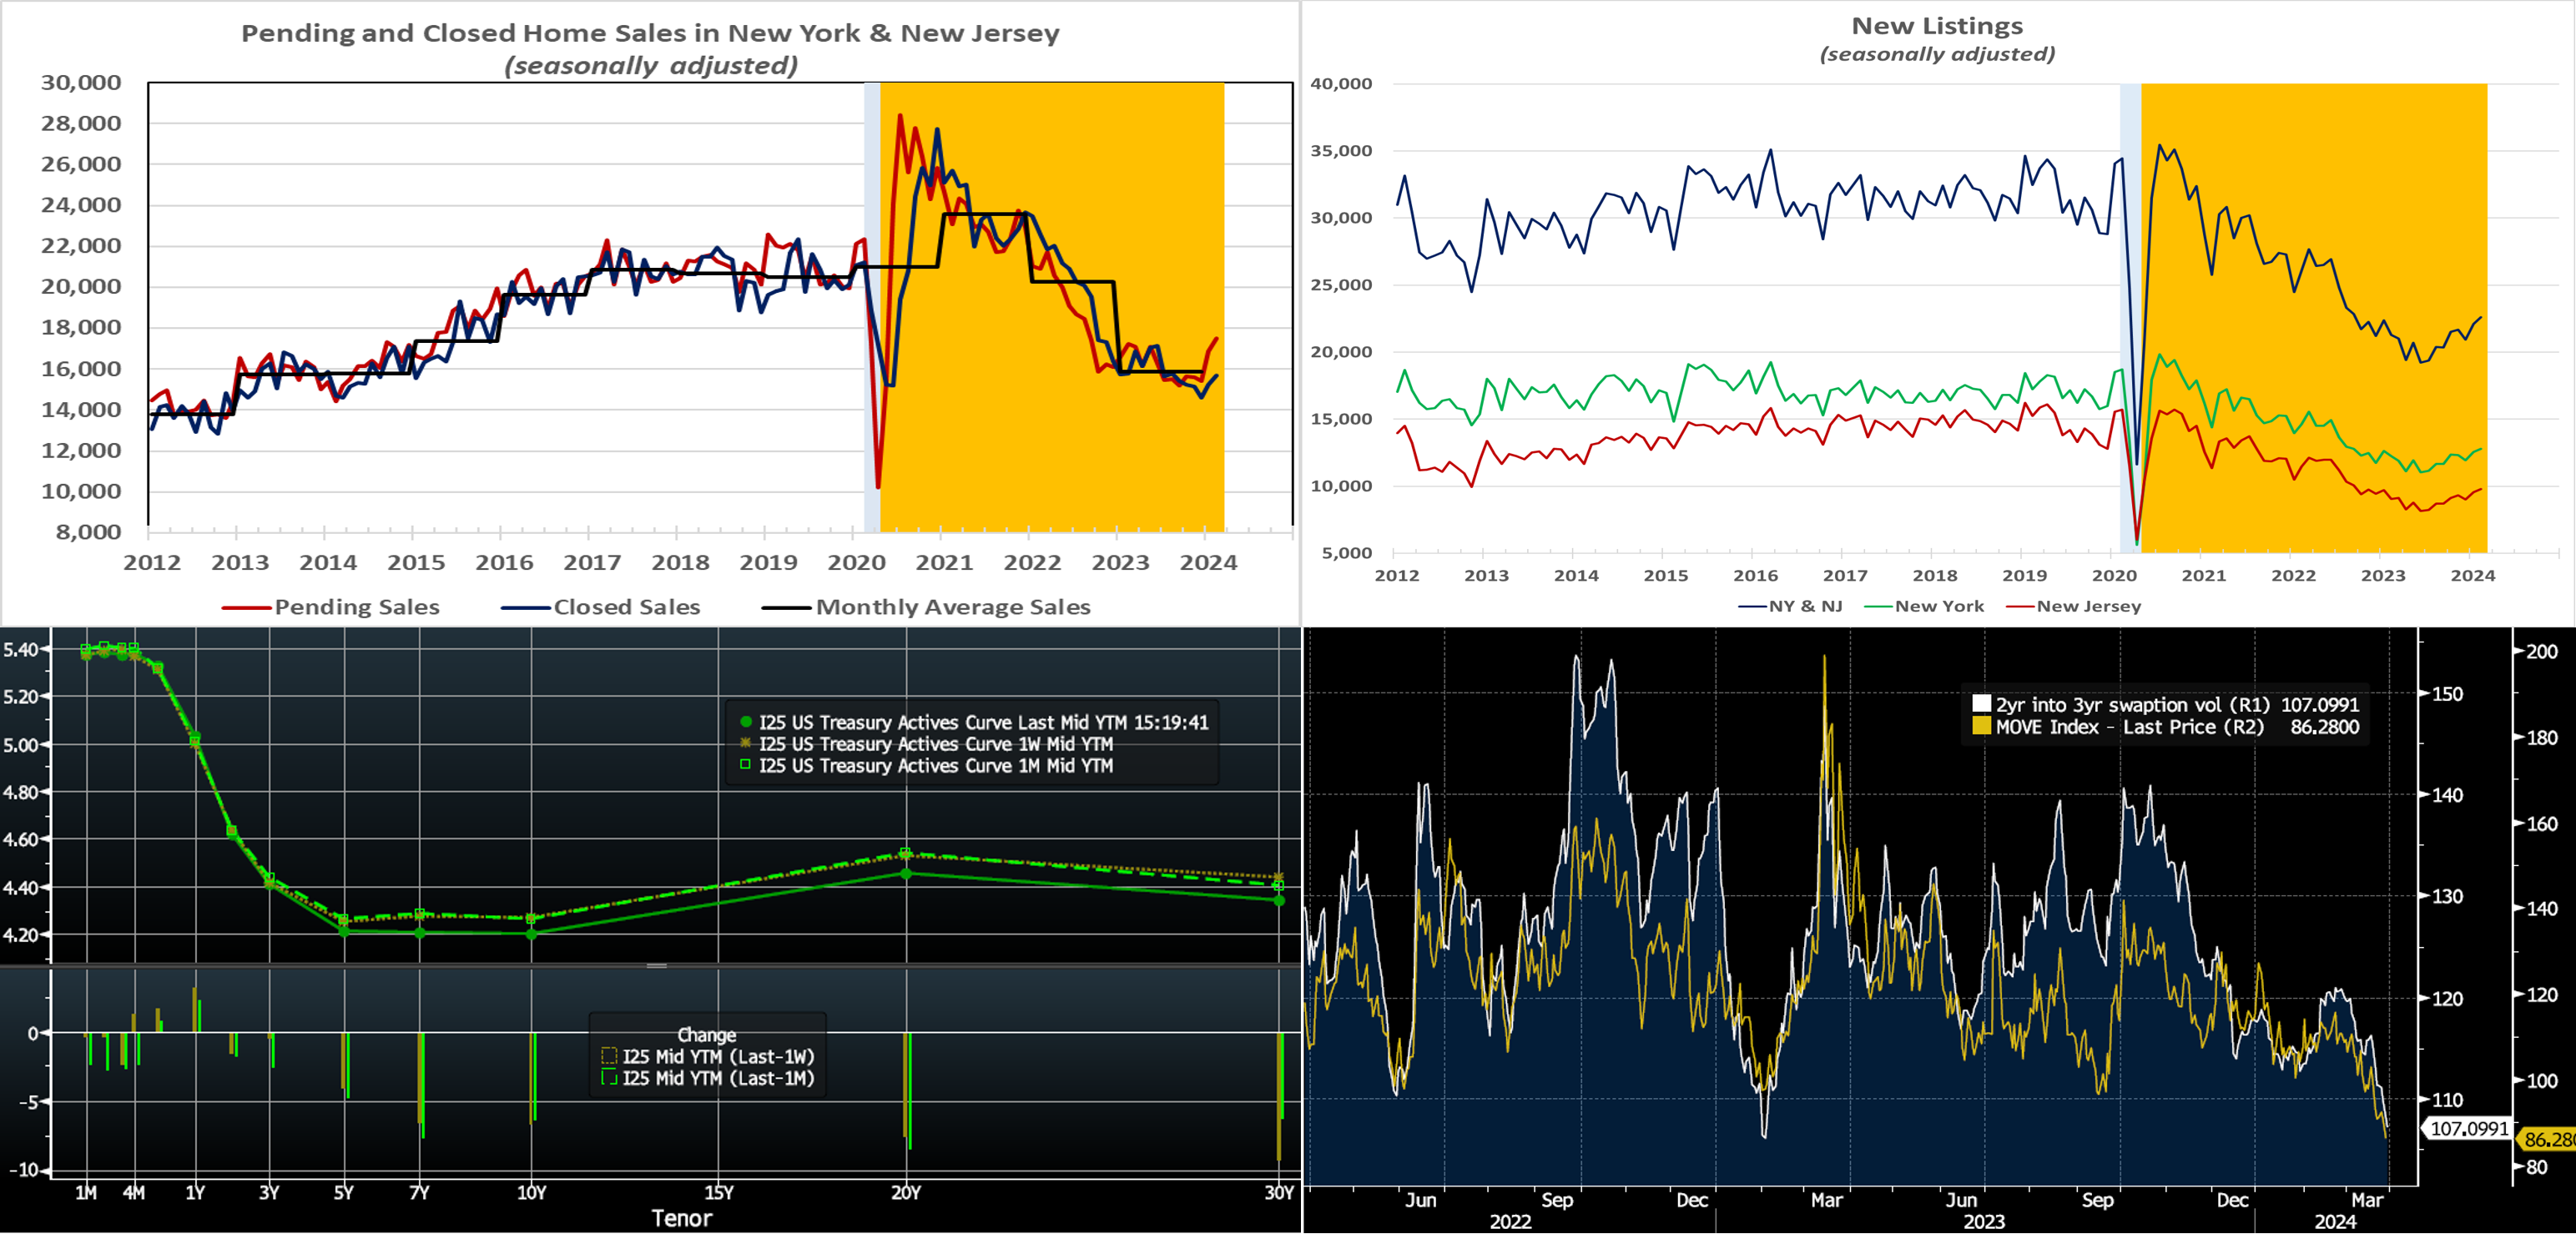
Source: National Bureau of Economic Research; NJ Realtors; NYS Association Realtors; FHLB-NY. The gap between home contract signings and closings across New York State and New Jersey has been steadily growing since last October and stood at a 3½-year wide in February. While the number of homes available for sale across the two states has been trending higher after hitting a record low last July, most of the recent surge in pending home sales appears to be attributable to homeowners at long last deciding to list their dwellings. Indeed, new listings in New York and New Jersey have jumped by an estimated 17.7%, or 3405 homes, after seasonal adjustment since last June, and at 22,612, stood at their highest level since September 2022.
CHART 3 LOWER LEFT
Source: Bloomberg. Top pane is yield (LHS, %), bottom pane is change (LHS, bps). From last Thursday afternoon to this one, the UST curve is slightly lower and flatter, with tenors 5-year-and-out down by 4 to 7 bps. Also shown here are the month-on-month changes in yields which are essentially the same as the past week’s changes. Data and Fedspeak over this market-holiday-shortened week continued to support a “wait and see” mode, regarding rate cuts, for the Fed. In terms of market-implied pricing of the Fed, a full 100% probability of a 25 bps cut is still August 1st, with the June 13th FOMC priced at ~65% chance, down from ~75% last week. The year-end 2024 forward is ~4.605%, roughly 8 bps higher than last week. Therefore, the market prices for a cumulative total of ~72.5 bps of cuts by the end of 2024, or ~8 bps less than a week ago.
CHART 4 LOWER RIGHT
Source: Bloomberg. Given the modest month-on-month change in rates and a prevailing range-trading pattern, there has been a notable decline in the implied volatility (“vol”) component of options. Shown here is the MOVE index (Gold, RHS-2, annual bps implied vol), a yield curve weighted index of implied vol on 1-month expiry options on USTs. Also shown is 2-year-into-3-year swaption vol (White, RHS-1, annual bps vol). As can be seen, vol has declined to the lowest levels since early 2023. This decline in vol, all else equal, decreases the value of options. In turn, it impacts our option-embedded Advance products; for instance, all else equal, it increases Putable Advance rate levels and lessens those for Callable Advances. The decline in option vol has also served to tighten MBS spreads by ~20 bps over the past month.
FHLBNY Advance Rates Observations
Front-End Rates
- Short-end rates were modestly higher by 1 to 3 bps week-over-week, with the 4- to 6-month zone leading the changes. A slight repricing of Fed rate expectations and lower demand for short-end paper in a holiday week prompted the move. Going forward, net T-bill supply, after a long spell in positive territory, is expected to decrease and eventually turn negative in the upcoming weeks. This development, all else equal, may help tighten spreads on FHLB paper. The looming April tax date is an item to monitor, however, as it may spur withdrawals from MMFs and banks.
- The market will focus on economic data, most notably the employment report, as well as a wealth of Fedspeak in the upcoming week.
Term Rates
- The longer-term curve, week-on-week and generally mirroring moves in USTs and swaps, was modestly higher in the shorter tenors and then lower on longer ones. The 2 and 3-year tenors were unchanged, while the 4-year-and-out sector was 2 to 10 bps lower in progressive fashion. Please refer to the previous section for color.
- On the UST term supply front, the upcoming week serves a reprieve from auctions. Note that UST auctions usually occur at 1pm and can occasionally cause volatility around that time. Please contact the Member Services Desk for further information on market dynamics, rate levels, or products.
The FHLBNY is pleased to announce the 2024 0% Development Advance (ZDA) Program, now available with a new streamlined submission process. This program provides members with subsidized funding in the form of interest rate credits to assist in originating loans or purchasing loans/investments that meet the eligibility criteria under the Business Development Advance (BDA), Climate Development Advance (CDA), Infrastructure Development Advance (IDA), or Tribal Development Advance (TDA). Please contact the Member Service Desk for information and/or visit our ZDA information page.
Price Incentives for Advances Executed Before Noon: In effect as of Tuesday, September 5, 2023, the FHLBNY is pleased to now offer price incentives for advances executed before Noon each business day. These pricing incentives offer an opportunity to provide economic value to our members, while improving cash and liquidity management for the FHLBNY. For further details, kindly refer to the Bulletin.
The Symmetrical Prepayment Advance Feature
For those anticipating term funding needs, and with rates on an uptrend, it can be an appropriate juncture to consider our SPA feature. This feature allows the member to capture, at prepayment, changes in the fair value of the advance which are favorable to the member. Contact Member Services Desk to discuss.
Looking for more information on the above topics? We’d love to speak with you!
Questions?
If you wish to receive the MSD Weekly Market Update in .pdf format (includes FHLBNY rate charts) or to discuss this content further, please email the MSD Team.