Member Services Desk
Weekly Market Update
This MSD Weekly Market Update reflects information for the week of August 22, 2022.
Economist Views
Click to expand the below image.
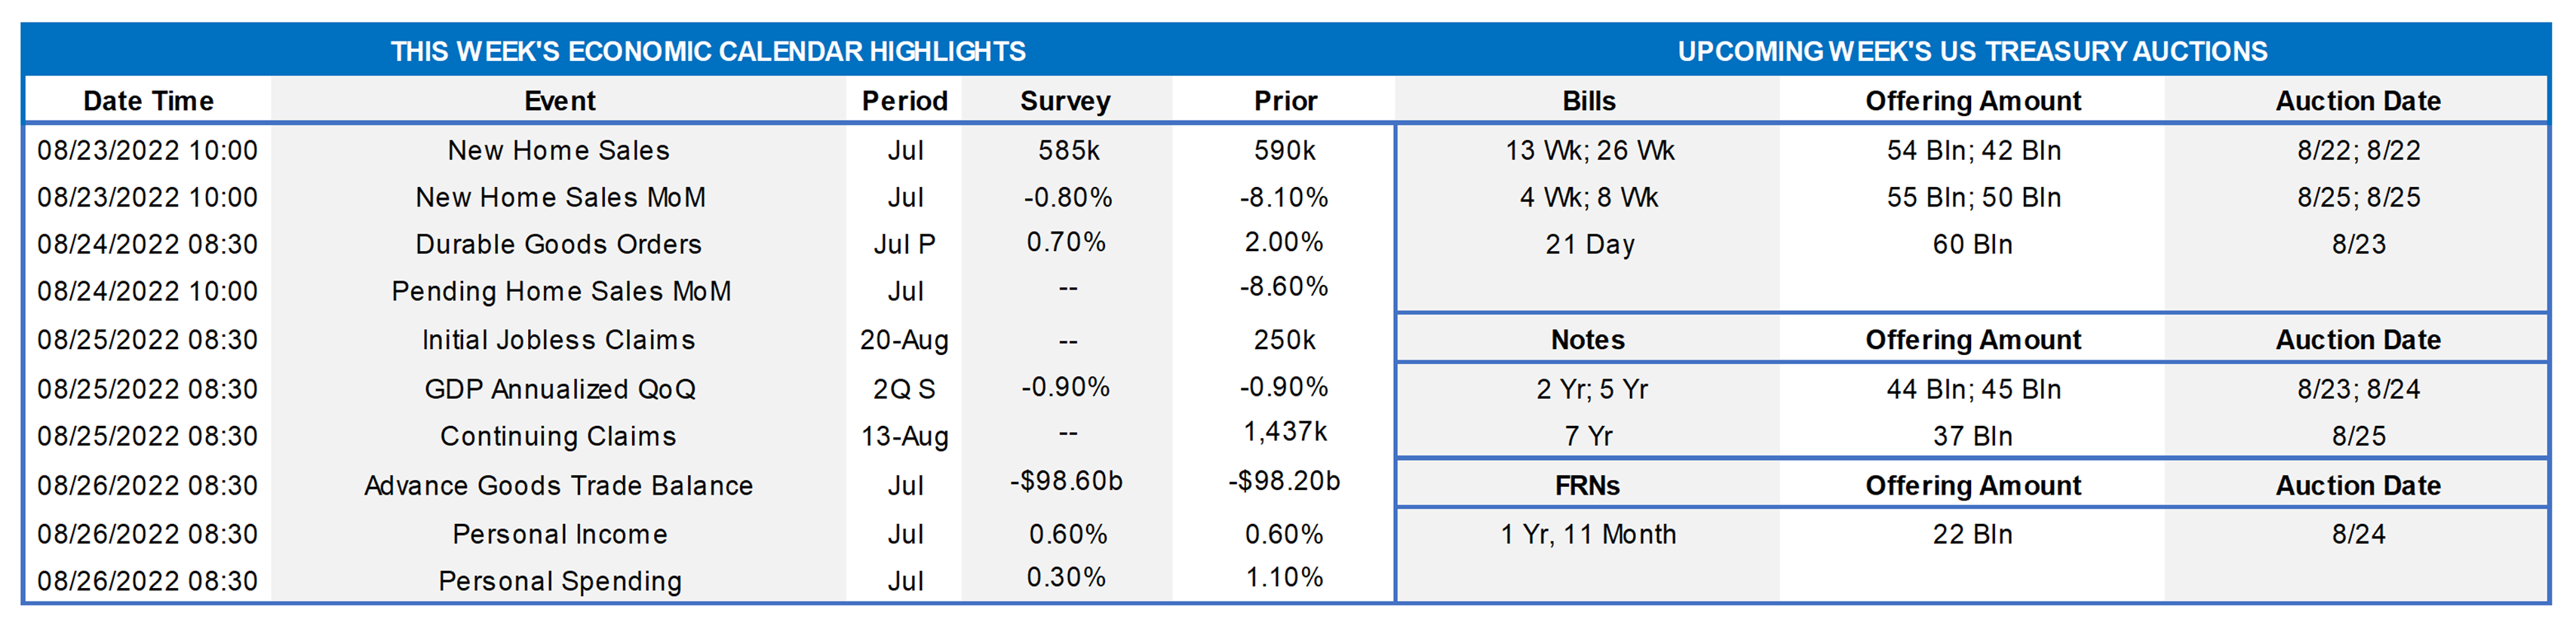
The Federal Reserve Bank of Kansas City’s annual symposium at Jackson Hole, Wyoming will be the marquee event of the upcoming week. Market participants will listen closely to Fed Chair Powell’s address for clues to the prospective pace of monetary policy tightening over the balance of the year. Powell can be expected to point out that, while the economy continues to expand with solid labor market conditions, consumer price inflation remains unacceptably high. Against that backdrop, additional federal funds rate increases are likely ahead and until progress is made in returning inflation to the desired 2% target. The data calendar probably will be mixed. Housing indicators likely will reflect that conditions continue to deteriorate. The Bureau of Economic Analysis may report that the economy expanded slightly during Q2. Soundings on consumer spending and merchandise trade in July will allow economists to update their tracking estimates for current-quarter real GDP growth.
New Home Sales: Reported declines in single-family building permits and housing starts suggest that new home sales tumbled by 9.3% to a seasonally adjusted annual rate of 535K in July – the fewest contract signings since the 532K posted in March 2016.
Durable Goods Orders: Durable goods orders are expected to have risen by .7% in July, boosting the cumulative increase since February to 4.7%. Excluding an anticipated uptick in transportation equipment requisitions, “hard goods” bookings likely edged .3% higher during the reference period, after a .4% gain in June. Nondefense capital goods shipments excluding jetliner deliveries will be watched closely to gauge the strength of business equipment spending at the beginning of the summer quarter.
Pending Home Sales: Affordability challenges suggest that home-purchase contract signings declined further in July, following an 8.6% dive in June.
Jobless Claims: Initial claims for unemployment insurance benefits likely remained in the recent 235-255K range during the period ended August 19. Pay particular attention to continuing claims under regular state programs for signs that laid-off employees may be having a more difficult time finding work.
Real GDP (Preliminary Estimate): Data released subsequent to the Bureau of Economic Analysis’ advance report suggest that real GDP may not have contracted during the spring quarter, as previously thought. The week’s report will also include preliminary Q2 estimates of corporate profits and real gross domestic income (GDI), an alternative measure of aggregate economic activity.
Merchandise Trade Deficit: The deficit on international trade in goods is expected to have widened slightly from the $98.2bn shortfall posted in June.
Personal Income & Spending: Buoyed by a solid rise in private wages and salaries, personal income probably climbed by .6% in July, matching June’s reported gain. Consumer spending likely rose by .5% during the reference period. With prices unchanged from those of the preceding month, real outlays are expected to have quickened, after the .1% uptick recorded in June.
Federal Reserve Appearances:
- Aug. 23 Minneapolis Fed President Kashkari to speak at a Q&A session with the Wharton Minnesota Alumni Club.
- Aug. 25 Kansas City Fed to host annual monetary policy symposium in Jackson Hole, Wyoming. The topic of this year’s conference is “Reassessing Constraints on the Economy and Policy.’’
Click to expand the below image.
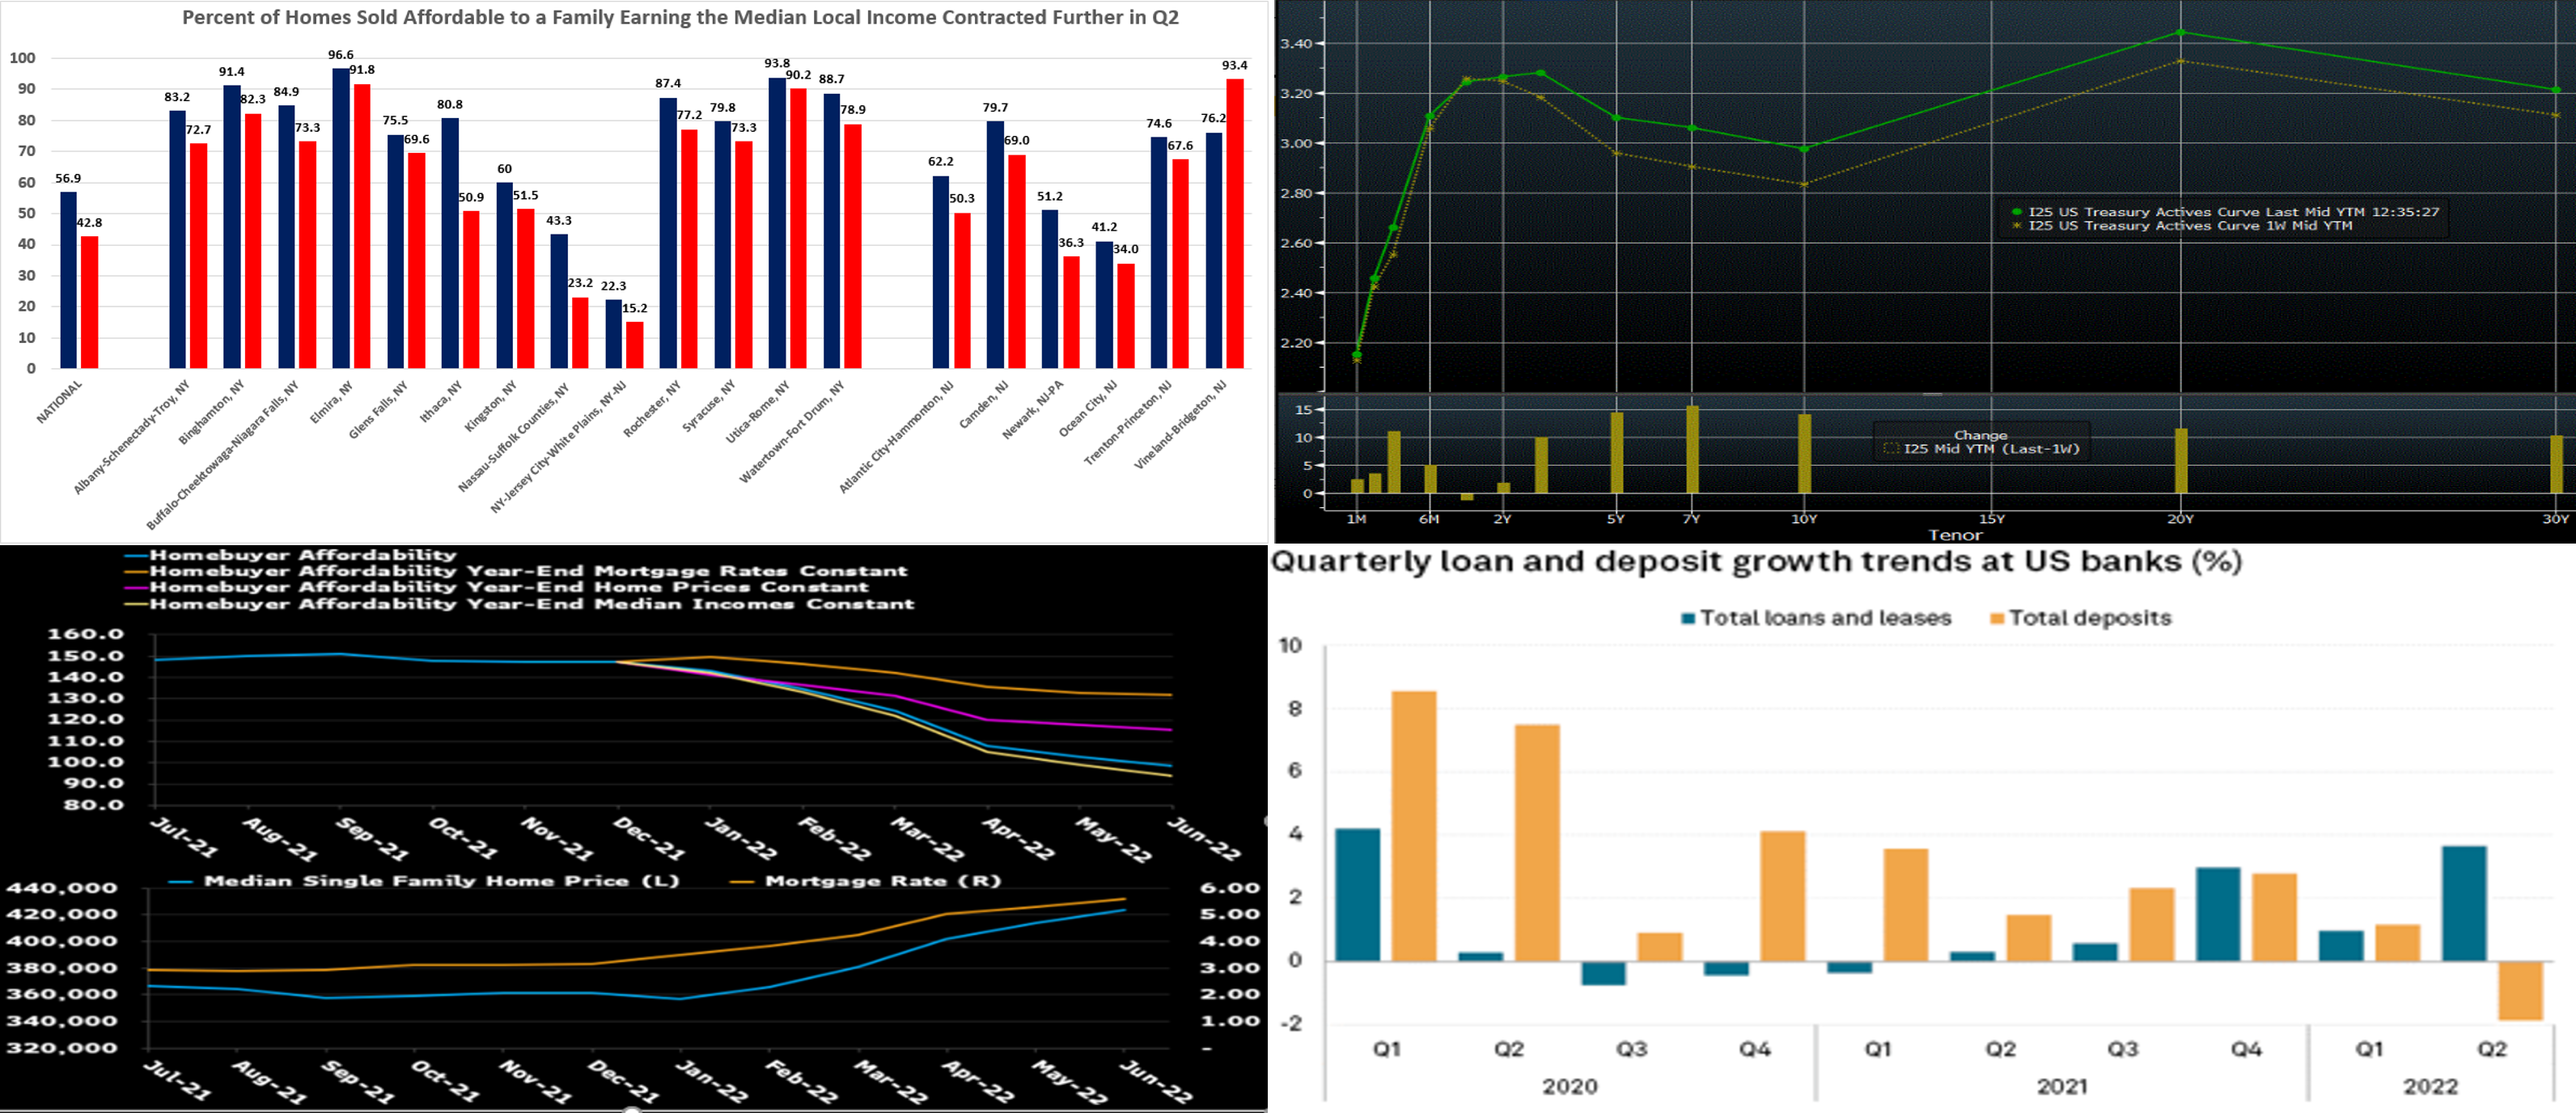
CHART 1 UPPER LEFT
Source: National Association of Home Builders/Wells Fargo; FHLB-NY. Housing opportunity deteriorated during the spring quarter. The NAHB/Wells Fargo Housing Opportunity Index is defined as the share of homes sold in an area that would have been affordable to a family earning the local median income, based on standard mortgage underwriting criteria. Therefore, there are two major components — income and housing cost. In all, just 42.8% of new and existing homes sold between the beginning of April and the end of June were affordable to families earning the U.S. median income of $90K. This is a sharp drop from the 56.9% of homes sold in Q1 that were affordable to median-income earners. The situation was similar across the FHLB-NY district during the reference period, with only the Vineland-Bridgetown, NJ area witnessing an improvement in housing opportunity. Given the more challenging housing backdrop, we encourage members to become acquainted with our affordable housing and community lending (discounted advance rates) programs. Please call the desk and/or visit https://www.fhlbny.com/community/.
CHART 2 UPPER RIGHT
Source: Bloomberg. Note: Top pane is yield (%), bottom pane is change (bps). The UST curve finished higher week-over-week, led by the 5 to 7-year zone. As of midday Friday, while 2-year yields were a few bps higher, the 3 to 7-year sector was 10 to 15 bps higher. Economic data released this past week was generally better than expectations. Meanwhile, the release of the July FOMC Minutes, while hinting that the Fed is in data-dependent mode, nonetheless reinforced that it will act with resolve to quell inflationary forces. These developments led the market to push back pricing of a prospective Fed rate cut cycle in 2023 from mid-year to closer to end-2023. These dynamics contributed to the upward move in rates. Please contact the desk for further information and color.
CHART 3 LOWER LEFT
Source: Bloomberg. Here is further context on home affordability. Median home prices are up nearly 40% nationally over the past two years, including a 17% increase in the first half of this year. At the same time, mortgage rates have nearly doubled because of Fed action, namely rate hikes of 225 bps since March and the start of runoff on its MBS and UST portfolios. Rising rates and home prices have pushed mortgage payments up by 57% for the median-priced home this year. Meanwhile, median incomes are up only about 5%. The chart provides scenario views of what the National Association of Realtors Affordability Index would have looked like now, if either rates, home prices, or incomes had held constant since end-2021. Higher home prices have clearly contributed to declining affordability, but higher mortgage rates have exerted a larger impact. If rates had stayed constant, affordability would still be at 131, instead of the current 103. The index would be even lower had it not been for income growth. Rates are unlikely to decline materially, near term or until inflation is more clearly under control. Therefore, for home affordability to improve, housing prices may need to decline.
CHART 4 LOWER RIGHT
Source: S&P Global Intelligence. U.S. banks undertook significant balance sheet changes during Q2. Total loans and leases jumped 3.7%, the highest quarterly increase since Q1 2020. Total deposits declined 1.9%, representing the first Q-over-Q decrease in four years. The loans-to-deposits ratio climbed more than 300 bps to 60.17%. The FHLB system, in turn, has experienced upward trends in advance balances. As always, FHLB-NY stands ready to help members navigate the changing dynamics in rates, funding, and the balance sheet.
FHLBNY Advance Rates Observations
Front-End Rates
- Short-end Advance rates finished higher and steeper week-on-week. While 1-month-and-in rates were mostly unchanged, 2 to 6-month terms were 5 to 6 bps higher, as these terms now cross further into Fed hike territory. Volatility in short-end markets has tempered in recent weeks, but the chance remains of dynamic moves both day-to-day and intraday, a situation likely to persist while the Fed embraces a “data-dependent” posture regarding rate hikes. As of this past Friday midday, the market priced for a 100% chance of a 50 bps hike at the September 21st FOMC, with ~48% chance (up from ~44% last week) of a 75 bps hike. For 2022 cumulatively from here, the market fully prices 100 bps of hikes, with ~78% chance of 125 bps.
- Given the Fed’s tightening and data-dependent posture, rates will remain highly responsive to economic data and Fed-speak.
Term Rates
- The longer-term curve finished higher and steeper week-over-week, generally mirroring the move in UST and swaps markets. Whereas 2-year was ~1 bp higher, 3-year-and-out was up 9 to 12 bps. Kindly refer to the previous section for relevant market color. The advance curve is extremely flat overall and inverted at various points, thereby offering opportunities to extend in advance duration for minimal or lower coupon cost.
- On the UST term supply front, this upcoming week carries 2/5/7-year auctions. Market focus will remain on economic data, particularly this week’s GDP and PCE inflation releases, and Fed-speak. Please call the desk for information on market dynamics, rate levels, or products.
Product Alert: FHLBNY is pleased to announce enhancements to our Advance Rebate Program, which provides members an opportunity to receive a cash rebate when prepaying an eligible advance and rebooking a new advance within a 30-day period. Rebate-eligible advances now must have a minimum of 6-months (reduced from 1-year) remaining. Moreover, the potential cash rebate has been increased. This program can be suitable for those wishing to extend their liability duration and/or potentially improve net interest margin. Please call the Member Service Desk at (212) 441-6600 for more information.
Forward Start Advance (FSA): For members with upcoming borrowing or refunding plans, consider the FSA as a method to opportunistically “lock in” rates before advance settlement date. Please call the Member Service Desk at (212) 441-6600 for more information.
The Symmetrical Prepayment Advance Feature
With rates at or near multi-year lows, it is a compelling juncture to use the SPA feature on term advances. This feature allows member to capture, at prepayment, changes in the Fair Value of the advance which are favorable to the member. Contact us to discuss.
Looking for more information on the above topics? We’d love to speak with you!
Questions?
If you wish to receive the MSD Weekly Market Update in .pdf format (includes FHLBNY rate charts) or to discuss this content further, please email the MSD Team.