Member Services Desk
Weekly Market Update
Economist Views
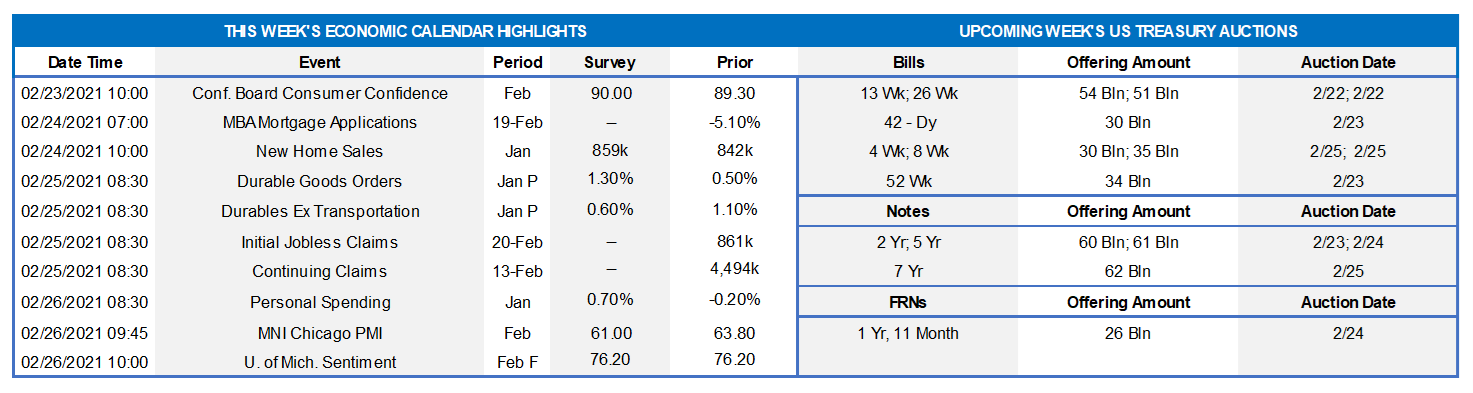
S&P CoreLogic CS 20-City Home Price Index: Home prices in the 20 metro areas canvassed by S&P CoreLogic Case-Shiller probably increased for a seventh straight month in December, finishing 2020 over 10% above their prior end-of-year level.
Conference Board Consumer Confidence: Weekly sentiment soundings suggest that the Conference Board’s consumer confidence gauge likely climbed to a three-month high of 92.5 in February, from the 89.3 reading posted in the prior month.
New Home Sales: Yet another solid rise in single-family building permits issued in January hints that contracts to purchase a new dwelling probably moved back above a seasonally adjusted annual rate of 900K for the first time since last October.
Durable Goods Orders: Durable goods bookings likely remained strong to start the year. Indeed, the 1.3% increase predicted by economists, if realized, would boost the cumulative rise from April’s pandemic low to a hefty 49%. Last month’s non-defense capital goods shipments data will provide insight into equipment spending’s potential contribution to current-quarter real GDP growth.
Real GDP Growth: Data released subsequent to the Bureau of Economic Analysis’ advance report suggest that Q4 real GDP expanded at faster pace than the original 4.0% annualized estimate.
Pending Home Sales: Home-purchase contract signings probably climbed in January, after a 5.6% decline over the final four months of 2020.
Personal Income & Consumer Spending: Buoyed by a resumption of government unemployment payments to individuals, personal income likely posted a double-digit percentage gain in January, after a comparatively modest 0.6% uptick in December. Solid increases in unit motor vehicle purchases and control retail sales suggest that consumer spending rebounded sharply at the beginning of the New Year, following a pullback over the November-December span.
Federal Reserve:
Feb 22: Fed Governor Bowman to discuss economic inclusion at a virtual event hosted by the Dallas Fed.
Feb 23: Fed Chair Powell to deliver semi-annual monetary policy report to Senate Banking Committee.
Feb 24: Fed Chair Powell to deliver semi-annual monetary policy report to House Financial Services Committee.
Feb 24: Fed Vice Chair Clarida to discuss economy and monetary policy at U.S. Chamber of Commerce virtual event.
Feb 25: Atlanta Fed President Bostic to deliver opening remarks at a banking outlook conference.
Feb 25: Fed Governor Quarles to discuss stress tests at a virtual banking conference hosted by the Atlanta Fed.
Feb 25: New York Fed President Williams to take part in virtual discussion hosted by One Hundred Black Men of N.Y.
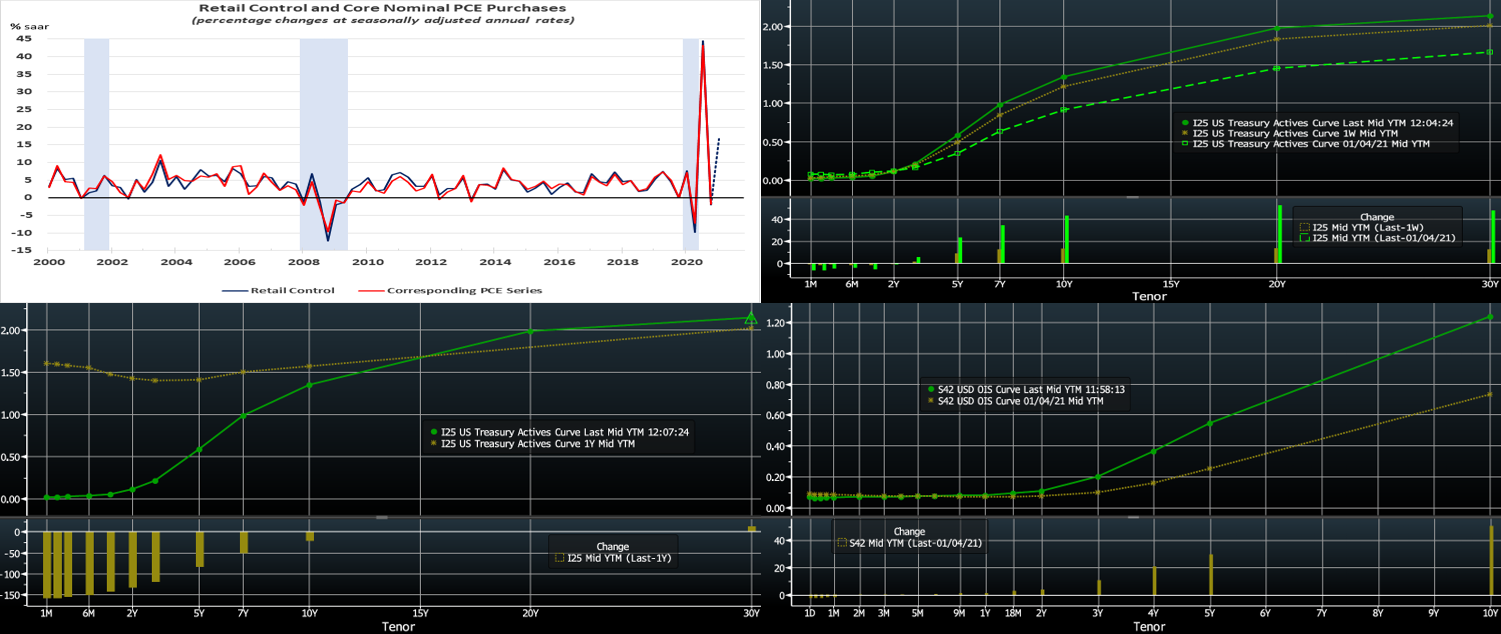
Source: U.S. Dept. of Commerce, FHLBNY. Note: Shaded areas denote recessions. Consumer spending began 2021 on a high note. The Census Bureau reported that retail and food services sales jumped by 5.3% in January, following revised declines of 1.0% in December and 1.3% in November. Last month’s gain far eclipsed the 1.1% rise anticipated by the Street and marked the largest one-month pop in purchases since last June’s 8.6% leap. Sales were universally solid across major segments during the reference period. Retail control – the portion of the report that is used by government statisticians to estimate nominal goods purchases in GDP – surged by 6.1% in January, more than offsetting the 3.6% decline over the final three months of 2020. Indeed, January’s tally placed core retail sales a whopping 16.8% annualized above their October-December average, following a -2.1% Q4 decline. Responding to the strength of retail sales in January, the Federal Reserve Bank of Atlanta boosted their tracking estimate for Q1 real GDP growth from 4.5% to 9.5% annualized, while the New York District’s forecast climbed from 6.7% to 8.3%.
CHART 2 – UPPER RIGHT
Source: Bloomberg. In a holiday-shortened week, the UST curve marched notably higher and steeper week-over-week, with shorter maturities essentially unchanged but maturities 4-year and out higher in progressive fashion by 7 to 14 bps. The 2-year/10-year slope now trades at its highest level in four years. The Fed’s guidance and programs continue to pin shorter-end yields. The Covid-19 pandemic has improved via downward trends in infections/hospitalizations/deaths and an upward trend in vaccinations. A further round of relief legislation remains “in the works”, with the attendant/expected UST supply to finance it. Moreover, Administration/D.C. talk of an infrastructure bill has sprouted and may garner nearer-term traction, given this past week’s episode in Texas. Except for jobs, recent economic data in the aggregate has outperformed consensus forecasts. These dynamics continue to support a steeper curve.
CHART 3 – LOWER LEFT
Source: Bloomberg. For perspective on the UST curve, portrayed here is the current curve vs. that of a year ago just prior to the pandemic’s onslaught. Yields 10-year and longer are nearing or have surpassed those of a year ago, while yields in the shorter end are well below pre-pandemic levels.
CHART 4 – LOWER RIGHT
Source: Bloomberg. Having noted that shorter-end yields are far below pre-pandemic levels, the market has begun to edge them higher. Here is the OIS (Overnight Indexed Swap – term Fed Funds yield curve) which reflects a bump higher/nearer since the beginning of the year. The market has basically moved forward the timing of a Fed hike and now prices ~25bp increase for 2023. Going forward and admittedly in very early stages, if the economy forges ahead from a reduced pandemic impact and new legislative plans, “Fed-watching” will become ever more important to anticipate changes.
FHLBNY Advance Rates Observations
Front-End Rates
Short-end advance rates finished unchanged to a bp lower, week-over-week. T-bill issuance was its usual market feature, but net supply has slowed and thereby allowed for easier market absorption. Money market funds’ AUM increased by ~$16bn this past week, led by Government-Only funds, thereby infusing demand for short paper. From a bigger-picture vantage point, an overall moderation in market supply of short paper, in tandem with high cash levels in the market, is expected to keep short-end rates relatively steady and under downward pressure in the year’s first half.
Heavy T-Bill issuance will remain a theme; UST issuance overall is now net positive supply in that more is being issued than what the Fed is buying in its programs. However, with short UST rates at rock-bottom levels and the Fed on hold for a long period, rates are likely to persist in a near-term sideways to softer pattern. Importantly, weekly net T-bill issuance has been lower since last summer and even negative at times in recent months, and Treasury has announced plans to shift issuance out the curve. Even with a new relief package and related borrowing, these market supply/demand and Treasury issuance dynamics should keep short rates in check on the upside. Indeed, short T-bills are threatening 0%.
Term Rates
On the week, medium and longer-term Advance rates were unchanged in the shorter tenors but 3 to 13 bps higher in progressive fashion past 3-year. Please refer to the previous section for further color on relevant market dynamics.
On the UST supply front, the week includes 2/5/7-year in nominal UST auctions. Recent auction sizes have been of record size and another contributor to the curve’s bear steepening. Focus this week will remain on Covid-19 and fiscal legislation developments.
New Product Alert: In order to satisfy member needs and provide greater product flexibility to match bond and derivative market conventions, FHLB-NY now offers SOFR-linked advances based on SOFR-index compounding. Note that this product is in addition to SOFR-linked advances based on SOFR-index averaging which have been offered since November 2018.
The Symmetrical Prepayment Advance Feature
With rates at or near multi-year lows, it is a compelling juncture to use the SPA feature on term advances. This feature allows member to capture, at prepayment, changes in the Fair Value of the advance which are favorable to the member. Contact us to discuss.
Looking for more information on the above topics? We’d love to speak with you!
Questions?
If you wish to receive the MSD Weekly Market Update in .pdf format (includes FHLBNY rate charts) or to discuss this content further, please email the
MSD Team.
Special Member Alert
The FHLBNY recently announced a newly expanded and flexible Disaster Relief Funding (DRF) advance program which offers discounted rate advances with maturities 1-mo and greater. Additionally, we have announced that PPP loans will be accepted as eligible collateral. Please contact us with any questions.