Member Services Desk
Weekly Market Update
Economist Views
Click to expand the below image.
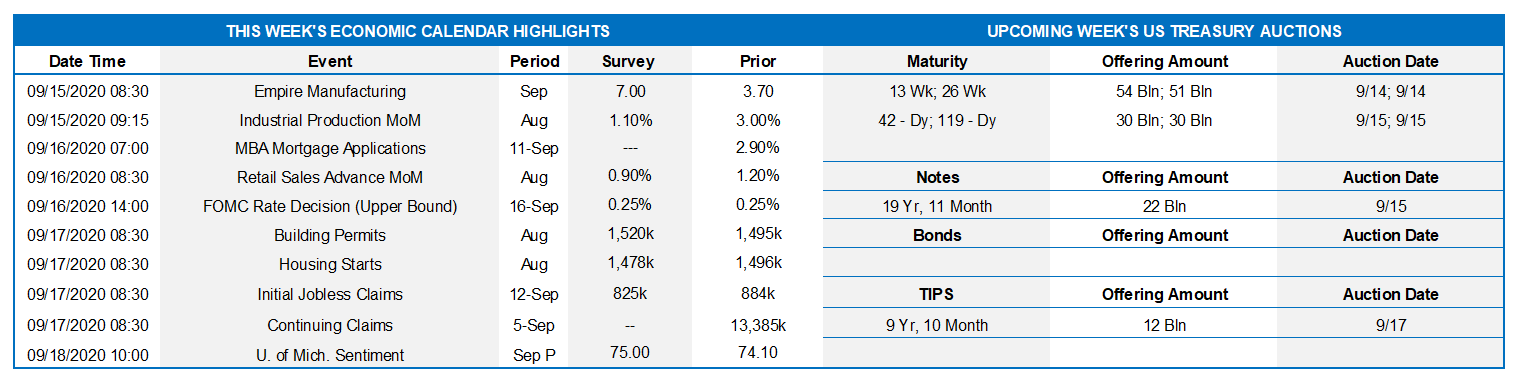
The FOMC meeting will be the most closely watched event of the week. Policymakers are universally expected to maintain the target range for the federal funds rate at 0 to .25%. The meeting will likely reiterate that the Fed will increase its holdings of Treasuries and agency residential and commercial mortgage-backed securities at least at the current pace over coming months, in order to sustain smooth market functioning. At the virtual Jackson Hole conference held in late August, the Fed released an updated Statement on Longer-Run Goals and Monetary Policy Strategy that implies the current accommodative stance will remain in place for an extended period of time.
As per custom, the communiqué after the September gathering will be accompanied by an updated Summary of Economic Projections (SEP). There is little reason to expect any changes to policymakers’ June expectations that there will be no change in the target range for the federal funds rate through the end of 2022. By contrast, data released since that time hint at potential revisions to Fed officials’ forecasts for key economic variables. Consensus expectations of an over 20% annualized jump in real GDP in Q3 and a further 6% gain in Q4 imply that the 6.5% calendar-year 2020 drop in GDP in the June SEP is too pessimistic. Moreover, the drop in the unemployment rate from a pandemic high of 14.7% in April to 8.4% in August hints at a sizable reduction to the 9.3% average anticipated by policymakers over the final three months of 2020. The previous estimates for inflation gauges probably will be left intact.
Industrial Production: Industrial output likely expanded for a fourth straight month in August, but a weather-related decline in electricity generation during the reference period hint that the consensus call for a 1.1% gain likely is too high.
Retail Sales: Retail sales are expected to remain on an upward path, rising by 0.9%, following a 1.2% gain in July. Focus on control purchases (ex-auto, building materials, and gas sales). This key metric, used by government statisticians to estimate nominal consumer goods spending in GDP, is expected to climb by 0.3%, thereby placing August’s reading 7.5% above its pre-pandemic level.
Housing Starts & Building Permits: Supporting expectations of a positive contribution to Q3 GDP growth from residential investment, this measure likely moved back above a SAAR of 1.5mn for the first time since February. The number of building permits issued is projected to top that level, after a revised 1.483 million in July.
Weekly Jobless Claims: Initial claims for regular state unemployment benefits likely dropped to a pandemic low of 795K last week from the 884,000 posted over the period ended September 5.
Michigan Sentiment Index: Early September readings suggest that the University of Michigan’s confidence gauge improved to a six-month high of 80.5 from August’s final 74.1 print.
Federal Reserve Appearances:
Aug. 15-16: FOMC Meeting.
Aug. 16: Fed Chair Jerome Powell to hold post-FOMC meeting press conference.
Aug. 18: St. Louis Fed President James Bullard to take part in a virtual discussion on the recovery from the COVID-19 pandemic hosted by Washington University in St. Louis and The Boeing Center. Text to be determined; audience Q&A.
Click to expand the below images.
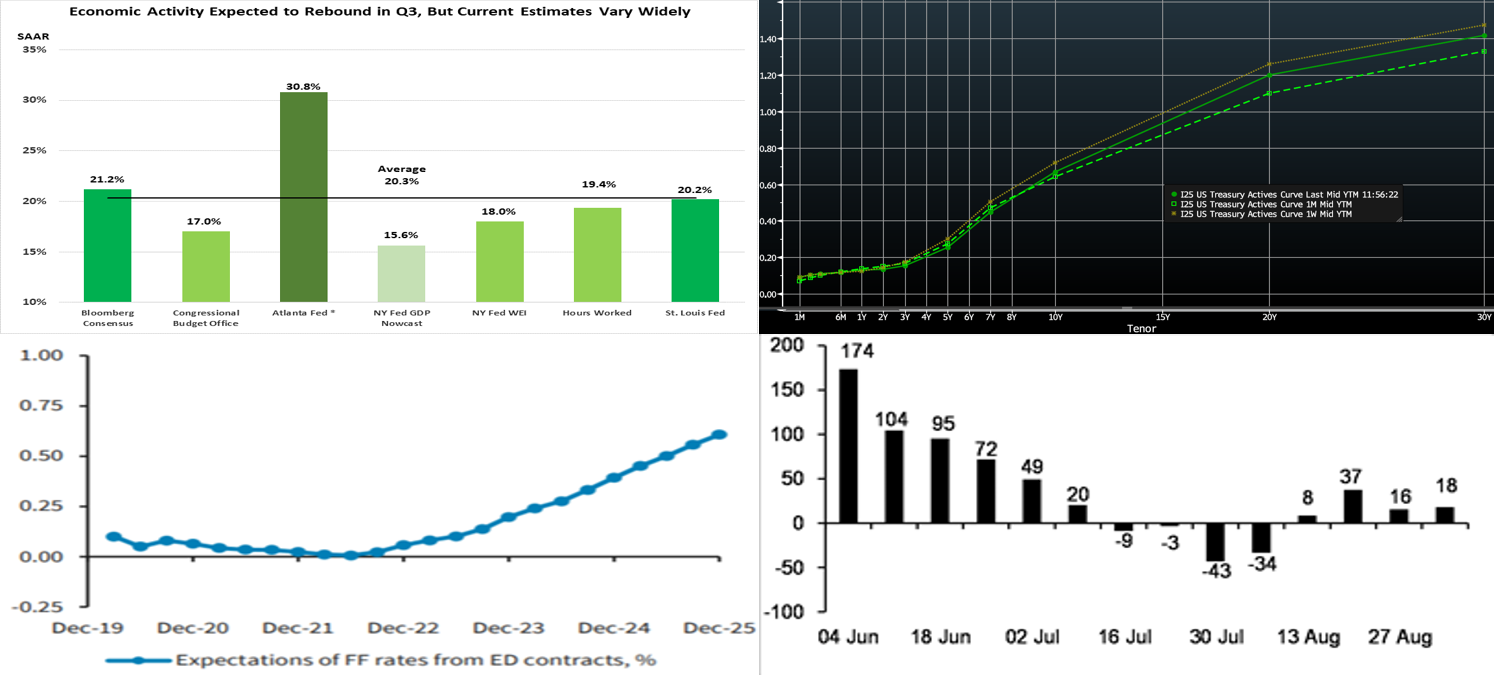
CHART 1 – UPPER LEFT
Source: FHLBNY. While all in double-digit territory, projections vary widely for the rebound in current-quarter GDP growth after Q2’s stunning 31.7% annualized contraction. Consensus projections beyond that point suggest that the lost activity in the wake of the COVID-19 pandemic will not be recovered fully until the end of 2021 or beginning of 2022. Important to note in this regard and in forthcoming data is the mathematical concept of “asymmetry of percentage returns”. Simply put as an example, a 50% decline subsequently requires a 100% increase to recover to the starting point. Hence, this economic recovery may be a protracted one. Note in chart: Asterisk denotes the most accurate estimate for Q2’s contraction in real GDP.
CHART 2 – UPPER RIGHT
Source: Bloomberg. The UST yield curve very mildly “bull flattened” this past week and remains in a tight range, especially 10-year and in. Inflows to bond funds and weakness in stocks helped demand for fixed income. Meanwhile, a strong 30-year UST auction on Thursday contributed to the long end of the curve edging a bit lower. As has been the case in recent months, the Fed’s guidance and programs have served to pin the shorter (5-year and in) portion of the curve in a tight range, and so it has been the longer end of the curve leading any moves. The market will monitor this week’s FOMC for any further guidance on rates and especially for any changes to its asset purchase plans, such as a potential shift to larger long-end UST purchases.
CHART 3 – LOWER LEFT
Source: Barclays Research. The market currently prices for no hikes in the Fed Funds rate until 2024. Here, forward Fed Funds rates are extracted from Eurodollar futures via adjusting the latter for the Fed Funds/Libor basis swap curve. It is highly unlikely that the FOMC this week will try to steer the market away from these expectations.
CHART 4 – LOWER RIGHT
Source: JP Morgan; US Treasury. Depicted here is weekly net issuance ($bn) of T-bills. After heavy issuance in early summer, it turned seasonally negative following the delayed July tax date and has since turned positive again but at a more moderate pace. This trend has enabled paper to be absorbed without much impact on rates, despite the decline in money market fund assets over the summer months. A new federal fiscal relief package, however, may add to net supply and is a subject to monitor.
FHLBNY Advance Rates Observations
Front-End Rates
Short-end Advance rates finished unchanged to a bp higher week-over-week. Heavy T-bill issuance was a feature, as usual, but net supply has been slowing (see chart previous section) and thereby allowing for easier market absorption. Government-only (G.O.) funds experienced ~$19.5bn and Prime funds ~$5.75bn of outflows on the week, somewhat sapping demand for paper.
Heavy T-Bill issuance will remain a theme; UST issuance overall is now net positive supply in that more is being issued than what the Fed is buying in its programs, and so this scenario could prove a small challenge. However, with short UST rates at rock-bottom levels, and the Fed likely on hold for a long period, rates may trade in a sideways pattern. Net T-bill issuance has been lower since mid-summer, and Treasury has announced plans to shift issuance out the curve, but a new fiscal relief package may complicate/alter this forecast.
Term Rates
Medium and longer-term Advance rates were unchanged to 2-3 bps lower, week-over-week, in a mild “bull flattener” shift. While rates were mostly unchanged 3-year and in, they were a few bps lower in progressive fashion in the 6 to 10-year space. See the previous section for more context on the move.
The past week experienced 3/10/30-year UST auctions; the 30-year performed surprisingly well and prompted a slight move lower in long-end rates. Corporate issuance should accelerate even further post-Labor Day in its usual pattern. Attention will remain on the prospects of further relief legislation and certainly also on COVID-19 and the question of whether or not it is being managed effectively enough to avoid any pauses in reopening. The main event of the week is the FOMC meeting.
The Symmetrical Prepayment Advance Feature
With rates at or near multi-year lows, it is a compelling juncture to use the SPA feature on term advances. This feature allows member to capture, at prepayment, changes in the Fair Value of the advance which are favorable to the member. Contact us to discuss.
Looking for more information on the above topics? We’d love to speak with you!
Questions?
If you wish to receive the MSD Weekly Market Update in .pdf format (includes FHLBNY rate charts) or to discuss this content further, please email the
MSD Team.
Special Member Alert
The FHLBNY recently announced a newly expanded and flexible Disaster Relief Funding (DRF) advance program which offers discounted rate advances with maturities 1-mo and greater. Additionally, we have announced that PPP loans will be accepted as eligible collateral. Please contact us with any questions.