Member Services Desk
Weekly Market Update
This MSD Weekly Market Update reflects information for the week of June 1, 2021.
Economist Views
Click to expand the below image.
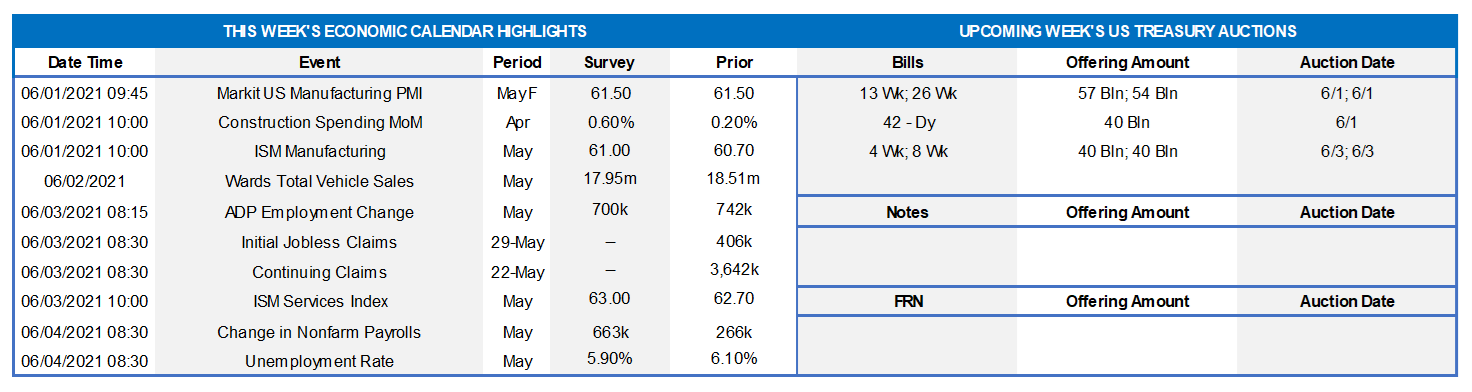
Construction Spending: The nominal value of new construction put-in-place is expected to have edged .6% higher in April, following a modest .2% uptick in March. The median Street projection, if realized, would place construction outlays at the beginning of the spring 2.2% annualized above their January-March average, after an 8.6% annualized winter-quarter gain.
ISM Manufacturing Index: The nationwide manufacturing expansion probably marked its one-year anniversary in May. Available regional and national surveys suggest that the Institute for Supply Management’s (ISM) closely followed barometer shed one-half percentage point to 60.2 during the reference period but remained well above the 50% breakeven mark.
Motor Vehicle Sales: Historic low inventories, combined with significantly less attractive manufacturers’ incentives, likely capped passenger car and light truck sales at 17.1mn annualized in May, down from the 16-year high 18.5mn posted in April. Despite the projected decline, vehicle purchases would remain roughly 40% above the 12.2mn posted a year earlier.
ADP National Employment Report: ADP Employer Service’s update on private sector hiring in May could color expectations for the official government report on Friday. Reported reductions in both initial and continuing jobless claims since the April canvassing period point to a 560K rise in private payrolls in May, after a 742K prior-month jump.
ISM Services Index: District Federal Reserve Bank surveys hint that the ISM’s service-producing activity barometer likely rebounded to an all-time high of 65.5% in May, following a 62.7% reading in the preceding month. Growing COVID-19 vaccinations and attendant easing of social-contact restrictions hint that further gains likely are in store through the summer.
Employment Situation Report: The Bureau of Labor Statistics’ update on the employment situation in May will enjoy pride of place this coming week. Payroll employment growth is expected to have reaccelerated, with the consensus anticipating a hefty 665K net new positions to be added after April’s tepid 266K gain. The marked improvement in consumers’ appraisals of available jobs during the reference period hints that the civilian jobless rate may have fallen sharply from the 6.1% posted in April. Average hourly earnings will undoubtedly receive considerable attention in the May report, following the surprisingly large .7% prior-month gain.
Federal Reserve Appearances:
June 2: Philadelphia Fed President Harker to deliver pre-recorded remarks to a forum on racism and the economy.
June 2: Philadelphia Fed President Harker to discuss the outlook at event hosted by Women in Housing and Finance.
June 2: Federal Reserve to release the Beige Book summary of commentary on current economic conditions.
June 2: Atlanta, Chicago, and Dallas Fed presidents to take part in a panel discussion on racism and the economy.
June 3: Philadelphia Fed President Harker to discuss an equitable workforce recovery at a virtual event.
June 3: Fed Vice Chair for Supervision Quarles to speak at a virtual SIFMA event.
June 4: Fed Chair Powell to participate in a panel on climate change with ECB President Lagarde and other officials.
Click to expand the below images.
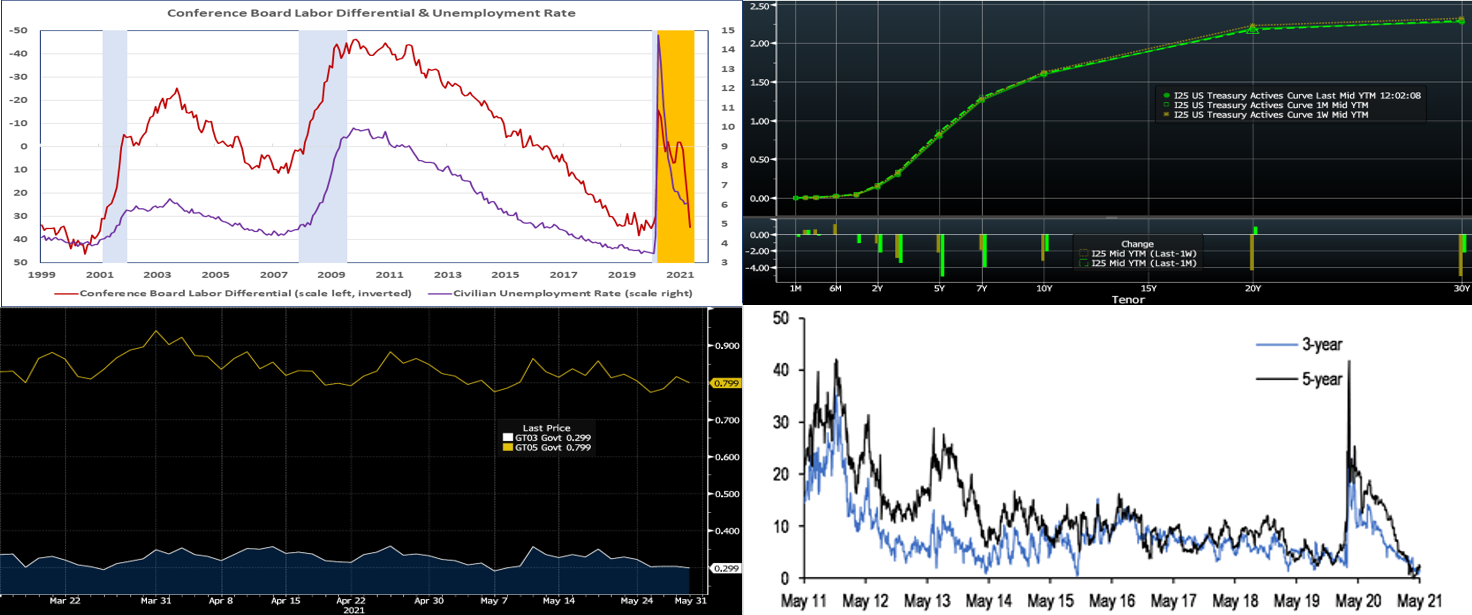
Source: BLS, Conference Board; FRB St. Louis; FHLBNY. Notes: Blue-shaded areas denote recessions; orange denotes period beyond April 2020 when probability that the economy was in recession dipped below 1%. Consumers’ appraisals of current labor market conditions improved markedly in May. Indeed, the so-called labor differential – the percentage of survey respondents believing that “jobs are plentiful” less those who feel that positions are “ hard to get” – widened by thirteen percentage points to 34.6% this month – the healthiest reading since January 2020 before the pandemic struck. The May sounding suggests that the civilian unemployment rate could dip lower and through the 6% mark in the upcoming employment situation report.
CHART 2 – UPPER RIGHT
Source: Bloomberg. Note: top pane is yield (%), bottom pane is change (bps). UST yields closed a few bps lower, week-over-week, led by the 5 to 7-year sector. The yield decline occurred despite generally strong economic data and higher-than-expected inflation readings on Friday morning. Indeed, the market essentially shrugged off Friday’s data, thereby indicating the market believes that the curve’s current pricing for inflation is “fair”. Meanwhile, the Fed continues to express patience via “stay the course/transitory”-type language in reaction to inflation concerns. And the Fed, as well as foreign and real money (such as banks and pension funds) investor buying, continues to provide a steady demand backdrop for bonds. In the past week or two, a few Fed members (Dallas Fed President Kaplan, for instance) have begun to express that “the time to talk about tapering” of its asset purchase program is drawing nearer. All in all, this mix of dynamics has served to keep yields relatively range-bound, as evidenced in the chart, over the past week and month.
CHART 3 – LOWER LEFT
Source: Bloomberg. The range-bound pattern of UST yields is evident here. Since the early-year selloff in bonds, both the 3-year (RHS, white, %) and 5-year (RHS, gold, %) yields have traded in narrow bands over the past few months. Their all-time low yields are .11% and .19%, respectively, which were reached last summer during the pandemic and initial governmental and Federal Reserve response efforts. While yields are off those record low levels, they are not dramatically so, especially the 3-year; they also now trade near the lower end of the past few months’ range. For those with risk on their balance sheet to an upward rates move and/or a need to match-fund longer assets, the lower end of these ranges could be a compelling zone in which to secure term funding. Note that our Symmetrical Prepayment Advance (“SPA”) “special” has been extended for another month and can serve as a hedge to a large upward yield moves. Please see further details in the last section herein and/or call the desk to inquire on further specifics.
CHART 4 – LOWER RIGHT
Source: JP Morgan. Depicted here are 3 and 5-year Agency bond spreads (x-axis year, y-axis bps). Like most all bond credit spreads, they are trading at very tight levels to the UST curve. This dynamic, in turn, allows for more compelling term advance offerings to members and amplifies the above color regarding term funding and the SPA special.
FHLBNY Advance Rates Observations
Front-End Rates
Short-end Advance rates finished flat to a bp higher week-over-week. Money Market Funds’ AUM increased by a massive ~$68bn on the week, led by a $62bn increase in Government-Only funds, thereby providing sustained demand for short paper. Meanwhile, the GSEs continue to invest larger sums into money markets, and the US TGA continues its decline. In a more recent development, state and local governments are receiving federal disbursements from the most recent relief bill and are parking funds in short-term investment “placeholders”. For any members experiencing such municipal deposit inflows, consider our Refundable Municipal Letter of Credit product; please call the desk to discuss. From a bigger-picture vantage point, the overall moderation in the supply of short paper, relative to high cash levels in the market, is expected to keep short-end rates relatively steady and under downward pressure in the year’s first half.
UST issuance overall is now net positive supply in that more is being issued than what the Fed is buying in its programs. However, with short UST rates at rock-bottom levels and the Fed on hold for a long period, rates are likely to persist in a near-term sideways to softer pattern. Importantly, weekly net T-bill issuance has been lower since 2020 and negative in recent months, and Treasury has announced plans to shift issuance out the curve. The latest relief package and related borrowing may lead to an eventual increase of T-bill auction sizes and positive net supply, but overall market supply/demand dynamics should keep short rates in check on the upside.
Term Rates
On the week, medium and longer-term Advance rates were lower by 1 to 5 bps, led by the 3 to 7-year sector. Kindly refer to the previous section for further color on relevant market dynamics.
On the UST supply front, this week brings a reprieve in auctions. The market will maintain its attention on any Covid-19 and legislative developments this week, while also paying a close mind to fresh economic news and/or “Fed-speak”.
New Product Alert: In order to satisfy member needs and provide greater product flexibility to match bond and derivative market conventions, FHLBNY now offers SOFR-linked advances based on SOFR-index compounding. Note that this product is in addition to SOFR-linked advances based on SOFR-index averaging which have been offered since November 2018.
The Symmetrical Prepayment Advance Feature
With rates at or near multi-year lows, it is a compelling juncture to use the SPA feature on term advances. This feature allows member to capture, at prepayment, changes in the Fair Value of the advance which are favorable to the member. Contact us to discuss.
Looking for more information on the above topics? We’d love to speak with you!
Questions?
If you wish to receive the MSD Weekly Market Update in .pdf format (includes FHLBNY rate charts) or to discuss this content further, please email the
MSD Team.
Special Member Alert
The FHLBNY recently announced a newly expanded and flexible Disaster Relief Funding (DRF) advance program which offers discounted rate advances with maturities 1-mo and greater. Additionally, we have announced that PPP loans will be accepted as eligible collateral. Please contact us with any questions.